


Unless explicitly stated below (for example, due to improvements in data processing and calibration), the NEOWISE Single-exposure Images are subject to the same limitations and exhibit many of the same features as those from the WISE All-Sky Data Release and the 2013 Post-Cryo Data Release. We recommend that you begin by reviewing the cautionary notes for the W1 and W2 Single-exposure images from the All-Sky and the 2013 Post-Cryo data releases before using the NEOWISE products. Some of the key features are repeated here, as are new findings specific to the reactivated NEOWISE survey.
Pixel units in the Single-exposure (intensity and uncertainty) images are not calibrated in terms of absolute surface brightness or flux. Their units are digital numbers (DN). The images are designed for photometric measurements relative to a local background using the photometric Zero Point Magnitude (MAGZP) provided in their FITS headers. Section III.3.c describes how photometric measurements on the Single-exposure images (in DN) can be converted to absolute flux units.
The NEOWISE Single-exposure images contain many artifacts and anomalies associated with bright sources, artificial satellites, transient detector behavior, spacecraft jitter and inaccurate tracking. Categorized examples for most of these were shown in section II.4.a.ii of the All-Sky Data Release Explanatory Supplement, and section VIII.2.b.i of the 2013 Post-Cryo Data Release documentation.
For examples of new anomalies in Single-exposure Images from the reactivated NEOWISE survey, see the NEOWISE Image Anomalies and Features gallery.
The NEOWISE Single-exposure image archive contains all of the Single-exposure images acquired and processed during the NEOWISE survey regardless of their quality.
Some of the W1 and W2 Single-exposure image sets suffer from the following problems:
You can identify good quality Single-exposure image sets in the NEOWISE Data Release using several of the keywords in the FITS headers and/or values in the Image Metadata Table as follows:
A new channel-noise correction algorithm was implemented for the reactivated NEOWISE survey. This performed extraordinarily well, being more reliable than in earlier processing phases. Instances of large residual channel offsets are still seen in the NEOWISE Single-exposure Images (primarily in W2), but are few and far between. These are triggered primarily by complex background emission and present a challenge for extended-source photometry.
An additional (but rare) caveat was discovered in the NEOWISE Single-exposure images. Occasionally, when the detectors observed a large background gradient perpendicular to the detector read-out (amplifier) channels, the channel-noise correction algorithm could not reliably correct for the intrinsic channel-to-channel variations, resulting in very large residual gradients. This effect was most common in W1 due to its greater sensitivity to background gradients relative to the underlying ambient (thermal) and zodiacal backgrounds. This was more likely when a bright off-axis source perpendicular to the scan direction was present since the W1 detector channels are aligned with scan direction. An example is shown in Figure 5 of section III.2.c. A threshold parameter was updated on May 20, 2014 to mitigate this effect. Therefore, there may be more instances of this anomaly prior to this date.
To validate the accuracy of the flat-field calibrations during the NEOWISE survey, spatially-binned residual maps using the difference between source photometry from the NEOWISE Single-exposures and the AllWISE Data Release Catalog were constructed (section IV.2.a.viii.1).
For the 2015 NEOWISE Data Release only (data acquired and processed during 12/13/2013 - 12/13/2014), spatial residuals in the relative gain were typically ± 1.6% in W1 and W2, although these may have been as high as ± 4% during the first couple of months following reactivation (prior to mid-February 2014) where the detectors were in their initial cool-down phase and their throughput changing rapidly. This implies that the photometry from multiple apparitions of the same object falling on different image locations across the multiple exposures will be subject to the same variation. An example is shown in Figure 17 of section IV.2.a.viii.1. Our calibration procedure was updated towards the end of 2014 to bring these residuals down to < 1% for both bands. Therefore, spatial variations in responsivity are appreciably reduced in Single-exposure products from the 2016 and later NEOWISE Data Releases (acquired and processed after 12/13/2014).
There are instances during NEOWISE data processing when dynamic "sky-offset" calibrations could not be made from consecutive blocks of frames along scans. These were typically frames that exhibited complex background emission and/or high source density (e.g., over the galactic plane), or were severely contaminated by the moon. This was intentional since these frames would have lead to bad calibrations and hence a large number of badly calibrated frames. Therefore, expect to see (rare) instances of Single-exposure images containing an exorbitant number of residual hot and cold pixels not tagged in the image bit masks.
Pixels identified as unusable (or "fatal") while deriving the time-dependent instrumental calibrations are set to IEEE NaN (Not a Number) in the Single-exposure intensity and uncertainty images. These are predominately pixels that were characterized as "noisy" (or unstable) throughout or for specific periods during the NEOWISE survey. For details, see sections IV.2.a.ii and IV.2.a.iii.
Furthermore, all pixels that are identified as saturated according to the sample-up-the-ramp encoding on board the spacecraft are set to NaN. All pixels that are NaN'd in the Single-exposure intensity and uncertainty images are tagged in the accompanying bit-mask images with specific bits. The NaN pixel values were convenient for NEOWISE processing since they were automatically recognized and excluded from profile-fit photometry in the pipeline.
Every attempt was made to tag (or "NaN-out" unusable) bad pixels that occurred during the NEOWISE survey in the image bit masks, whether they were bad ab initio and remained that way for the duration of the survey, or became transient and noisy over time (e.g., section IV.2.a.ii). Complete tagging of every possible bad-pixel, however, cannot be guaranteed. We recommend that you examine the Single-exposure intensity and bit-mask images visually before using them. See also section III.3.a for advice on how to use multiple (redundant) Single-exposures of the same region of sky (when available) to mitigate bad-pixels, charged-particle hits, and other image anomalies.
The spacecraft payload electronics encoded pixels in the raw images that saturated the amplifier A/D converters on any sample-up-the-ramp read-outs, and that encoding was captured in the Single-exposure bit mask images. This on-board encoding, however, was not reliable during the Cryogenic and Post-cryogenic phases of the WISE mission (e.g., section VII.3.b.iv.1 in the All-Sky Explanatory Supplement), leading to many instances of mis-tagged saturation, particularly in the cores of bright sources that were expected to saturate. To the best of our knowledge, saturation masking in the Single-exposure products from the reactivated NEOWISE survey was much more successful, with one exception.
Between 13 July 2024 21:51:41 UTC and 24 July 2024 03:24:12 UTC (scans 63694r-64017s), the DEB saturation thresholds were inadvertently set to the much higher values intended for the WISE Cryogenic mission. This resulted in underflagging and masking of saturated pixels in the Single-exposures and their bit-masks during this period. The saturation thresholds were returned to the correct values following this until the end of the Reactivation survey.
Pixel distributions (histograms of pixel values) in Single-exposures from the NEOWISE Data Release do not exhibit the "false-mode" feature as in the earlier 4-band (All-Sky) and 3-band Cryo Data Releases. The problem in the dynamical calibration that produced the spike in the pixel value distribution, or the "false-mode," was corrected for the 2013 Post-Cryo and AllWISE Data Releases, as described in section V.2.a of the AllWISE Explanatory Supplement. The same software was used to process Single-exposure images from the reactivated NEOWISE survey. Therefore symptoms of this feature, such as faint source flux underestimation if one were to co-add multiple Single-exposures to improve sensitivity, will not occur when using Single-exposures from the NEOWISE Data Release.
The Single-exposure uncertainty images store the 1-σ uncertainty estimates for each pixel in the corresponding intensity images. Their computation and validation against robust measures of the local pixel-RMS noise in the intensity images are outlined in section IV.2.a.iv. These uncertainty images account for all instrumental calibration steps and can be used to compute uncertainties in photometric measurements made on the intensity images (section III.3.e).
From global (scan-medianed) trending analyses (e.g., Figure 10 in section IV.2.a.iv), the pixel-uncertainties are accurate to <~ 4% in W1 and W2, although we cannot guarantee this applies to all products when used on an individual Single-exposure basis. We recommend exercising caution when using the pixel uncertainties to ensure they are not excessively over- or under-estimated for an individual image. A suggestion on how to perform this check is outlined in III.3.e.
The absolute astrometric accuracy of sources in the NEOWISE Single-exposure Database is generally very good, with typically an RMS of <~ 0.08 arcsec (per axis) with respect to the ICRS for sources with a W1 signal-to-noise ratio >~ 20. We advise checking the Single-exposure Source Database for your sources of interest, and if measurements are available, using the astrometrically calibrated positions therein. However, if you measure the equatorial (J2000) positions of sources directly on the astrometrically-calibrated Single-exposure images using your favorite source-position estimation algorithm (or source-extractor), you may find these will differ slightly from positions in the Single-exposure Source Database. There are two reasons for this:
| Band | #sources used | <δx> [arcsec] |
σ<δx> [arcsec] |
RMS(δx) [arcsec] |
<δy> [arcsec] |
σ<δy> [arcsec] |
RMS(δy) [arcsec] |
δr= √(<δx>2+<δy>2) [arcsec] |
upper 95th-percentile in δr [arcsec] |
|---|---|---|---|---|---|---|---|---|---|
| 1 | 331038 | -0.27634 | 0.00132 | 0.55768 | -0.15226 | 0.00134 | 0.56362 | 0.31552 | 1.48518 |
| 2 | 73986 | -0.11167 | 0.00327 | 0.63733 | 0.02332 | 0.00324 | 0.63261 | 0.11408 | 1.76939 |
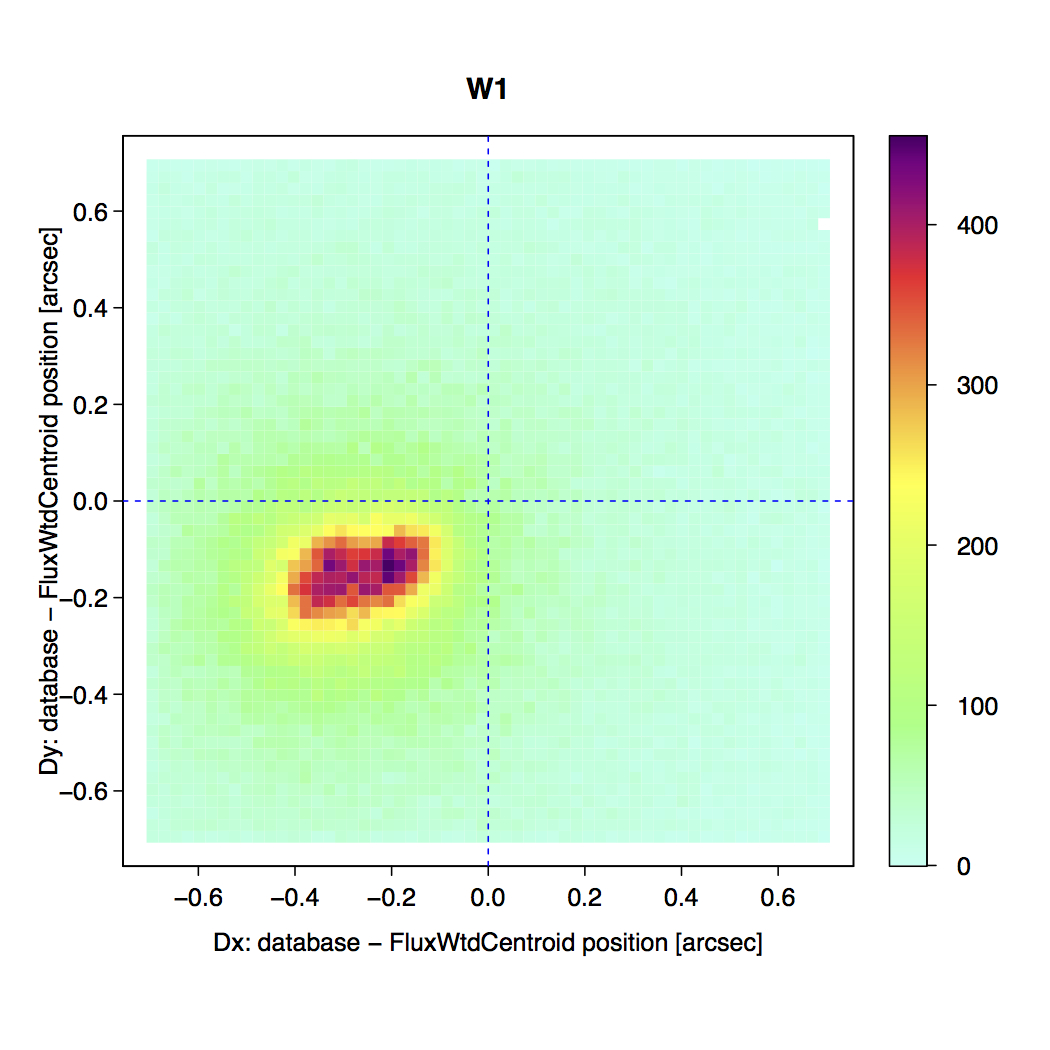 |
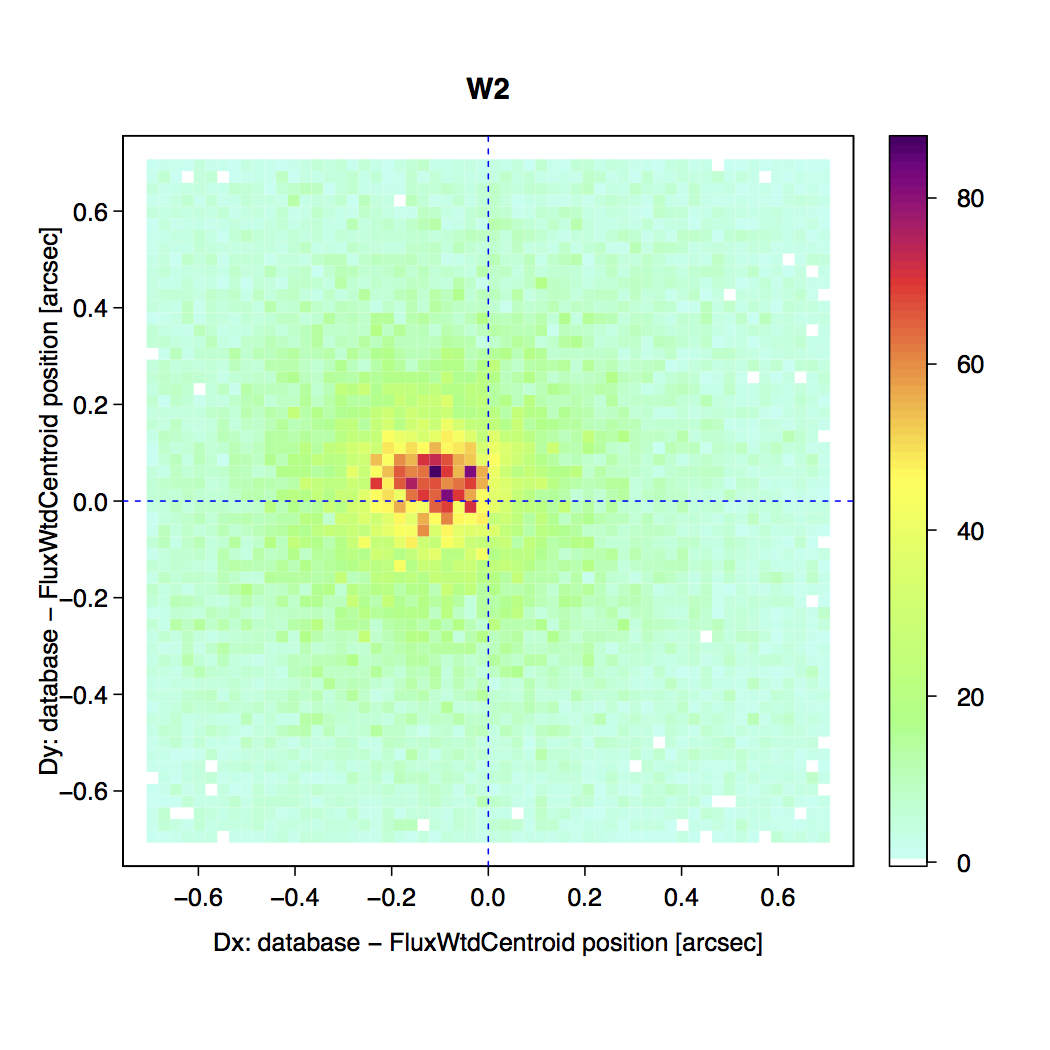 |
| Figure 1 - x-y density plot of difference: "database source position - flux-weighted W1 image centroid position." Click to enlarge. | Figure 2 - x-y density plot of difference: "database source position - flux-weighted W2 image centroid position." Click to enlarge. |
The W1 and W2 Single-exposure Images have intrinsically different pixel sizes, orientations, and distortions. Therefore, sources will not fall at the same raw pixel locations in these bands. These effects are accounted for by the WCS parameters and SIP-distortion coefficients in the FITS headers, which are recognized (for example) by the DS9 image analysis tool that is in wide use by astronomers. Other image analysis tools may not utilize this information.
The astrometry in the FITS headers of the NEOWISE Single-exposure Images is calibrated with respect to the positions of a bright, reliable subset of the 2MASS PSC that were corrected for motion between the 2MASS and NEOWISE observation epochs using proper motions from the UCAC4 catalog (Zacharias, N. et al. 2013). Therefore, the astrometric solutions attached to the NEOWISE Single-exposure images do not need to be corrected for the motion of the reference frame. See also Cautionary Note II.2.k pertaining to the NEOWISE Single-exposure Source Database.
The 2MASS reference source positions were not corrected for proper motion during the astrometric calibration of Single-exposure Images in the WISE All-Sky, 3-Band Cryo, and NEOWISE Post-Cryo Data Releases. Therefore, in addition to the possible biases noted in Cautionary Note m (above), you may see small systematic offsets between the NEOWISE image-derived positions and those from the earlier image-data sets. Correction for the systematic motion of the reference frame was made for AllWISE position reconstruction, so NEOWISE-AllWISE astrometric comparisons should not show significant biases.
The observation mid-point times listed in the NEOWISE image headers and metadata tables may differ slightly from the true observation mid-points because of several systematic and random effects that are described in I.2.c.iii.1. For images acquired before 23, 2015 11:29:30.47 UTC (mjd=57196.47882488), the mid-point of the observation times are approximately 1.57±0.25 sec earlier than the times given in the headers. For images acquired after that date, the observation times are approximately 0.57±0.25 sec earlier than the header values.
The photometric zero points provided in the NEOWISE image headers (MAGZP) are derived from the photometry of sources detected in the images. Therefore, the image photometric calibrations exhibit the same stability as the source photometric calibration throughout the NEOWISE mission, as survey as discussed in IV.2.d.ii. The W2 calibration exhibits systemic and seasonal variations that are correlated with variations in focal plane temperatures over time. During most of the Reactivation survey these variations were <0.03 mag. However, during the final two months of the survey when focal plane temperatures exceeded 80K, the W2 photometric offset rose to nearly 0.06 mag.
The W1 photometric calibration was stable to better than 0.005 mag during most of the Reactivation survey. In the final two months of the survey, the W1 calibration offset reached a maximum of just over 0.01 mag.
These small calibration variations have not been corrected in the photometric zero points provided in the NEOWISE Single-exposure Image headers. Photometric calibration offset corrections that can be applied to the zero point values are provided in IV.2.d.ii.
Last update: 13 November 2024