


We describe below the instrumental calibration (ICal) of single exposures in the post-cryo phase of the mission to support two data releases: (i) a preliminary release (July 2012), and (ii) the May 2013 release (referred to as "2013 Release" below). Full details of the preliminary processing pipeline were described in section IV.3.a of the Preliminary Data Release Explanatory Supplement, while full processing details for the 2013 release were described in section IV.4.a, with some updates performed to support 3-Band Cryo processing (section VII.3.b).
We summarize below additional updates made to the W1 and W2 calibrations, starting from their initial preliminary and 3-Band Cryo processing versions that supported the 2012 (preliminary) and 2013 Post-Cryo Data Releases respectively. These updates optimized the scientific return from the WMOPS pipeline to support the NEOWISE program.
The post-cryo phase was from Sep 30, 2010 to Jan 30, 2011. For the 2012 (preliminary) release, the calibration updates described below were only applied to data acquired from ~Nov 5, 2010 onwards. The updates were primarily to darks, flats, bad-pixel masks, and frame-noise scaling parameters. Prior to this, the default preliminary calibrations were used. All other processing steps and calibrations not mentioned below (including bit-mask definitions) are the same as used in first-pass processing for the Preliminary Data Release. Furthermore, all the cautionary notes pertaining to the Preliminary Data Release apply here.
All single-exposures from the post-cryo period were subsequently reprocessed during Aug - Oct 2012 using much improved calibrations and algorithms. This was to support the May 2013 post-cryo release. The starting point was the processing pipeline used to support the 3-Band Cryo Data Release (section VII.3.b; which in turn was inherited from the All-Sky release pipeline described in section IV.4.a). The updates were primarily to darks, flats, bad-pixel masks, electronic gains, read-noise values, and methodologies to correct for amplifier/channel variations, bad-pixel transients, and skyoffsets. All other processing steps and calibrations not mentioned below (including bit-mask definitions) are the same as those used to support processing for the 3-Band Cryo Data Release. If a specific calibration was not updated in 3-Band Cryo processing, then it was inherited from All-Sky Cryo processing. Furthermore, unless otherwise mentioned, all the cautionary notes pertaining to the All-Sky and 3-Band Cryo data releases apply here.
The initial W1 and W2 darks used in first pass processing were from cover-on exposures acquired during In-Orbit Checkout. As temperatures rose and the cryogen was depleted, the data showed evidence that these darks were no longer applicable. Refined darks were derived from the post-cryo survey data in conjuction with the relative responsivity (see below). We used the same procedure as used to derive the W3 and W4 darks from flight data. This used a self-consistent calibration method that tracked the change in response of each pixel relative to the overall background. The slope from a linear least-squares fit to this trend was the relative responsivity and the dark was derived from the intercept. As in preliminary processing, the goal here was not to obtain accurate estimates of the absolute dark level, but to calibrate the spatial structure in the dark and bias over each array, at a time in the post-cryo phase when the detectors were in a quasi-stable state.
For both the dark (and flat-field calibrations), we used 5100
W1 and W2 frames within the scan range 09633a - 09662a, after filtering
frames contaminated by moon-light (within 40 degrees of the moon),
high source density, abnormal noise, and any frame falling within 5 degrees
of the galactic plane. Figures 1 and 2 compare the new darks generated from post-cryo frames
to those used in preliminary first-pass processing for W1 and W2 respectively.
The spatial variations are significantly different between the two darks,
becoming more prevalent in the post-cryo versions. The accuracy
of the dark calibrations for W1 and W2 was ~5%/pixel relative to the median
dark level.
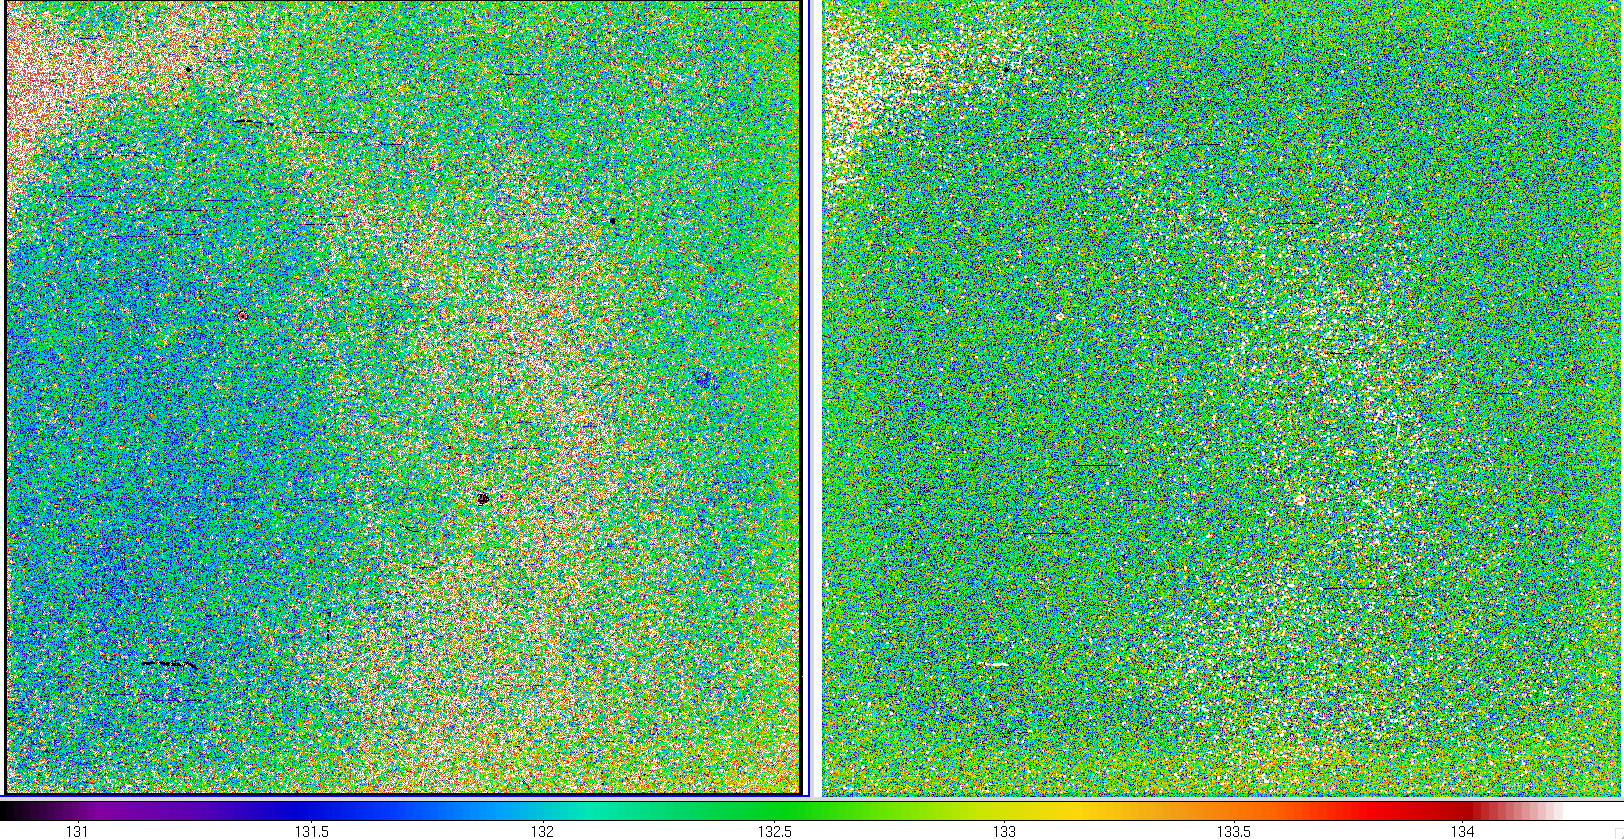 |
| Figure 1 - W1 dark generated from post-cryo data (left), compared to that used in preliminary (first-pass) processing (right). |
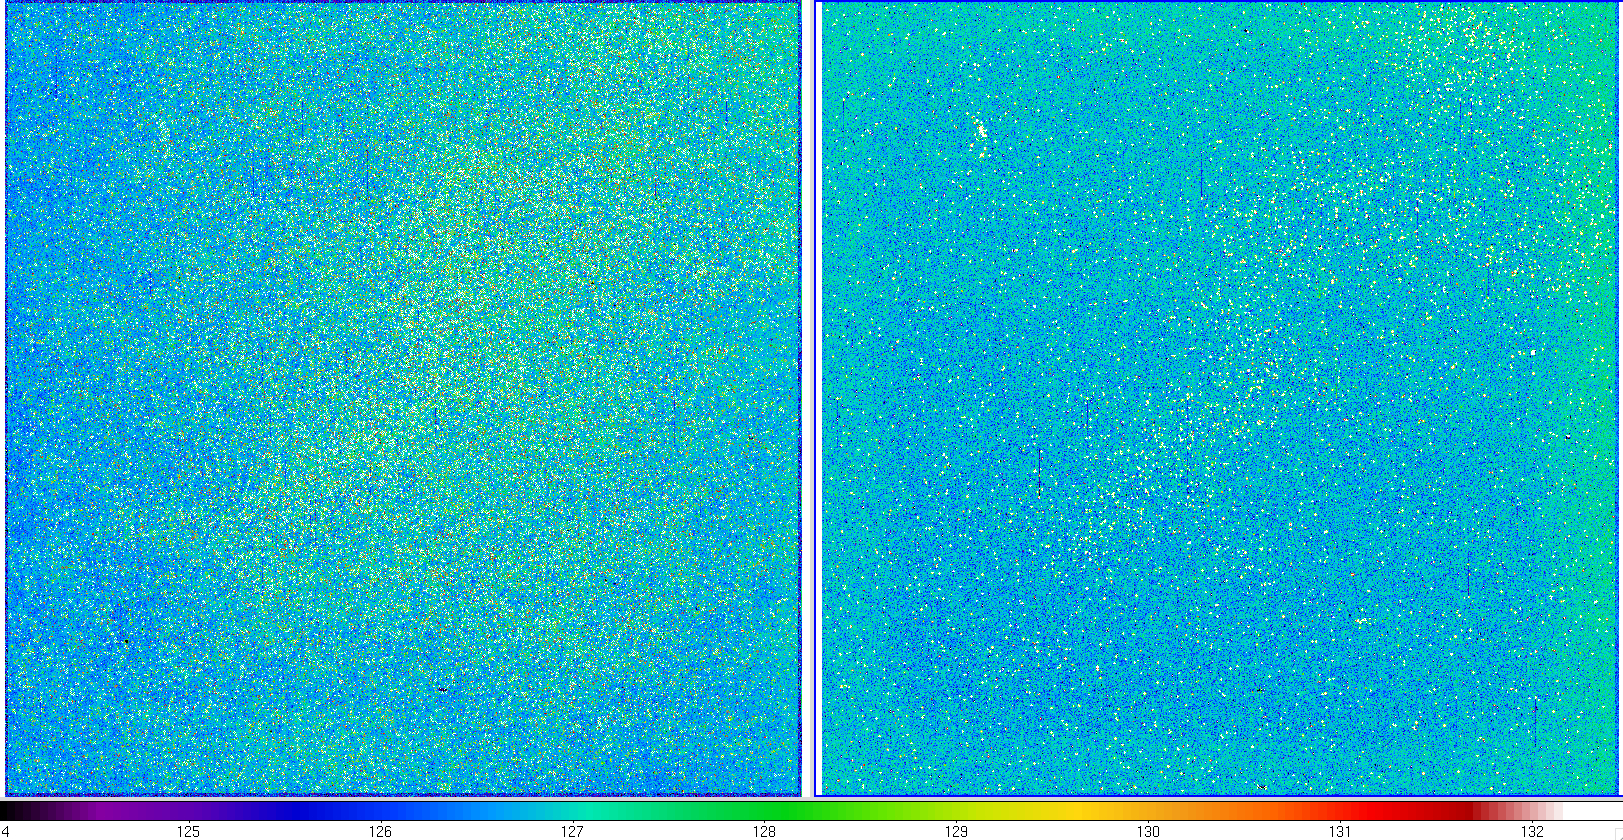 |
| Figure 2 - W2 dark generated from post-cryo data (left), compared to that used in preliminary (first-pass) processing (right). |
To support processing for this release, we used a similar method as above. That is,
we derived darks in conjunction with the new reponsivity maps described
in section iii.2. This was the same procedure as used
to construct the W3 and W4 darks in previous processing phases
(e.g., section IV.4.a.v.).
This method tracked the change in
response of each pixel relative to the overall background. The slope from a linear
least-squares fit to this trend was the relative responsivity and the dark was
the intercept. The goal here
was not to obtain accurate estimates of the absolute dark level, but
to calibrate the spatial structure in the dark and bias
over each array. Given these calibrations were based on knowledge of
the responsivity maps for two calibration intervals
(frame-ID ranges 08746a001 - 09548a277 and 09549a001 - 12514b213),
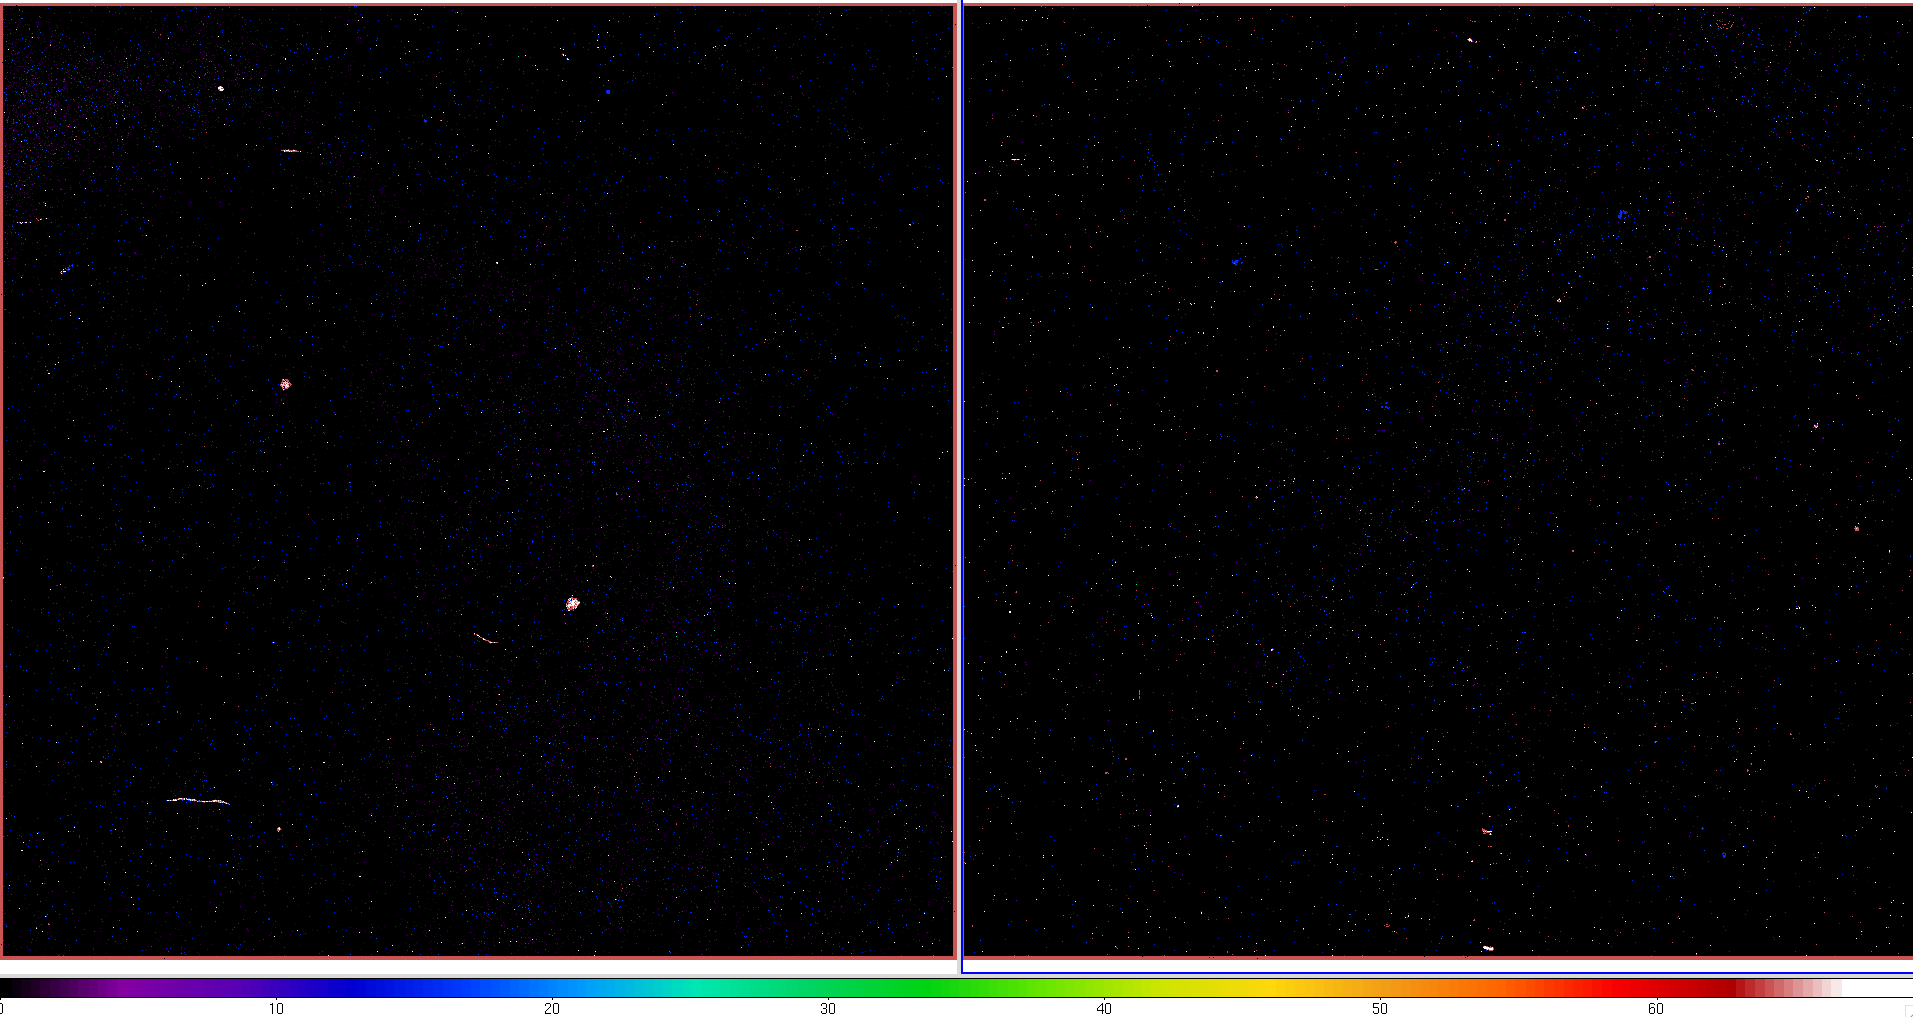
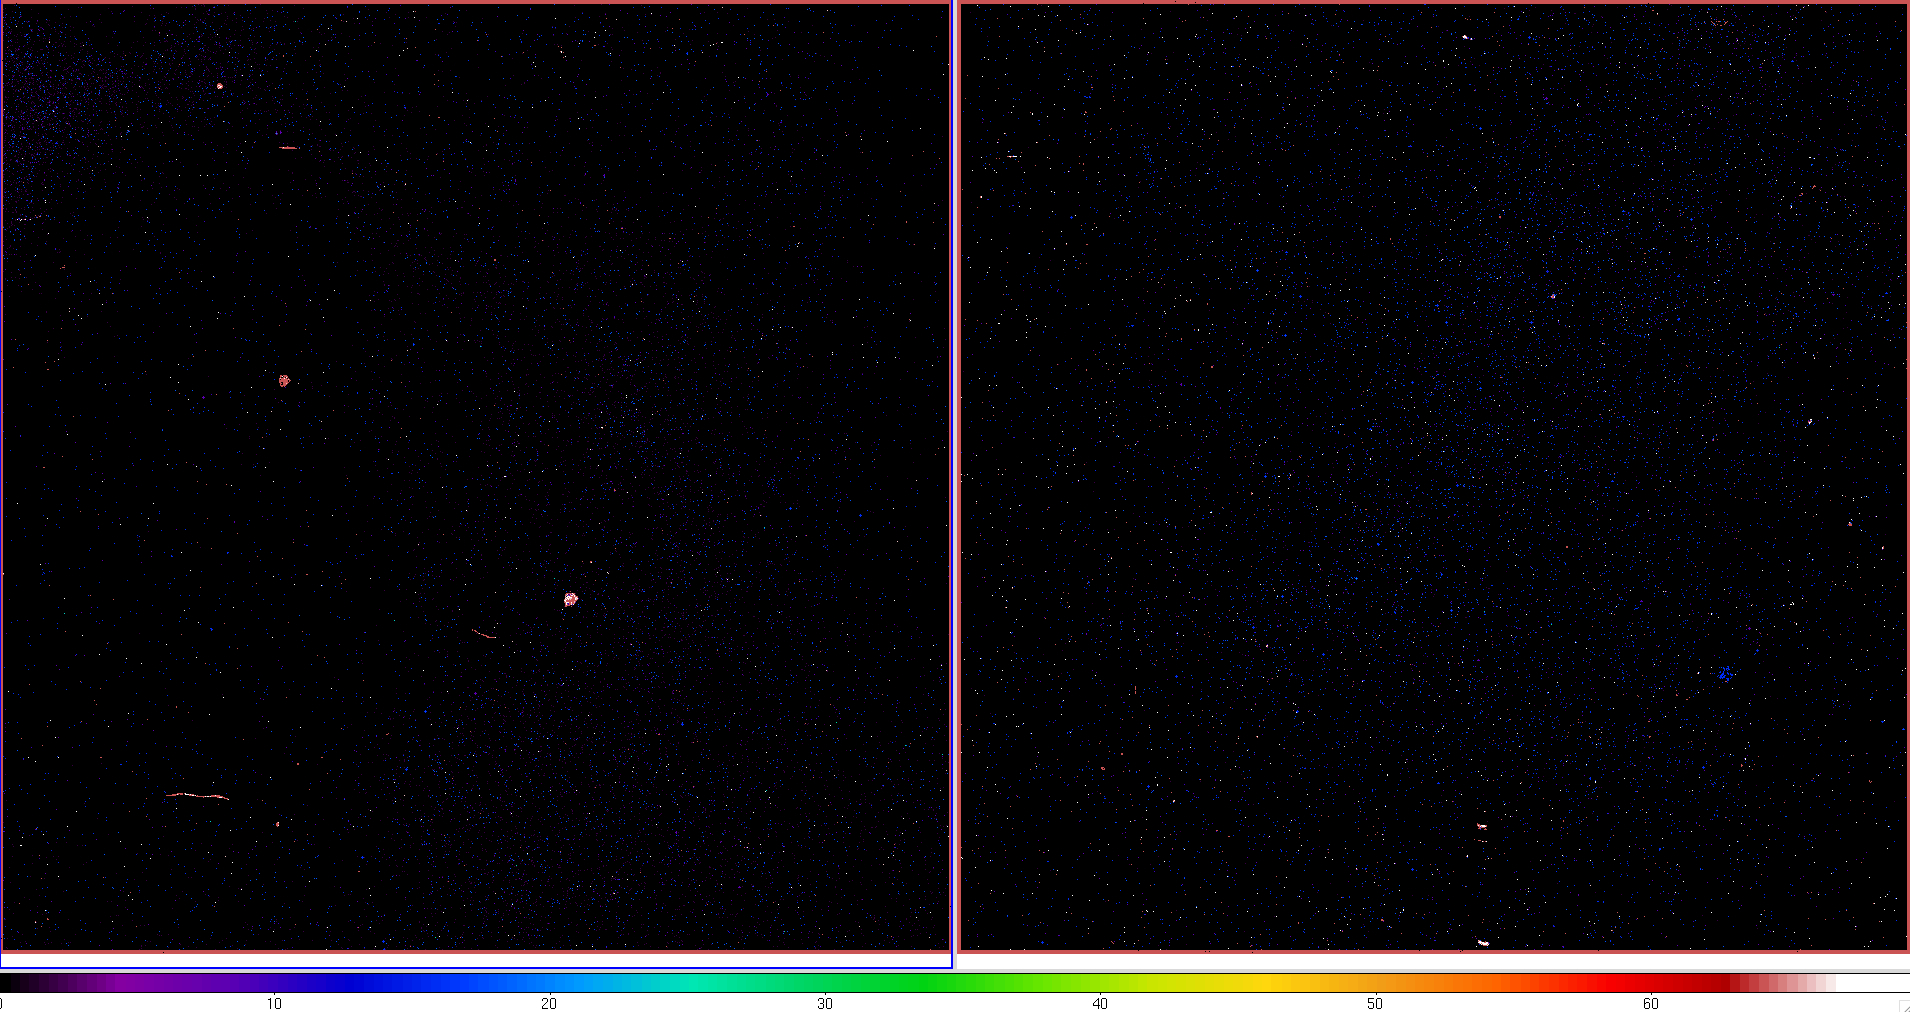
darks were only possible for these intervals. The darks are shown in Figures 3 and 4.
The median accuracy per pixel
based on the accompanying uncertainty maps is of order 3% for both bands.
 |
| Figure 3 - Darks for the calibration interval spanning the frame ID range 08746a001 - 09548a277 for W1 (left), and W2 (right). Color bar gives the range of values. Click to enlarge. |
 |
| Figure 4 - Darks for the calibration interval spanning the frame ID range 09549a001 - 12514b213 for W1 (left), and W2 (right). Color bar gives the range of values. Click to enlarge. |
As for the preliminary (first-pass) and All-Sky (second-pass) cryo calibrations, W1 and W2 flat-fields for the post-cryo period were created from the survey data using the same methodology. This entailed tracking the change in response of each pixel relative to the overall background. The slope from a linear least-squares fit to this trend was the relative responsivity. Uncertainties were also estimated per pixel.
Like the dark calibrations, the flat-fields used 5100
W1 and W2 frames within the scan range 09633a - 09662a, after filtering
frames contaminated by moon-light (within 40 degrees of the moon),
high source density, abnormal noise, and any frame falling within 5 degrees
of the galactic plane. Figures 5 and 6 compare the new responsivity maps generated
from post-cryo frames
to those used in preliminary first-pass processing for W1 and W2 respectively.
The spatial variations are significantly different between the two,
with the post-cryo products being more spatially uniform than the
cryo versions.
The accuracy of the post-cryo flat-fields for W1 and W2 was ~1%/pixel.
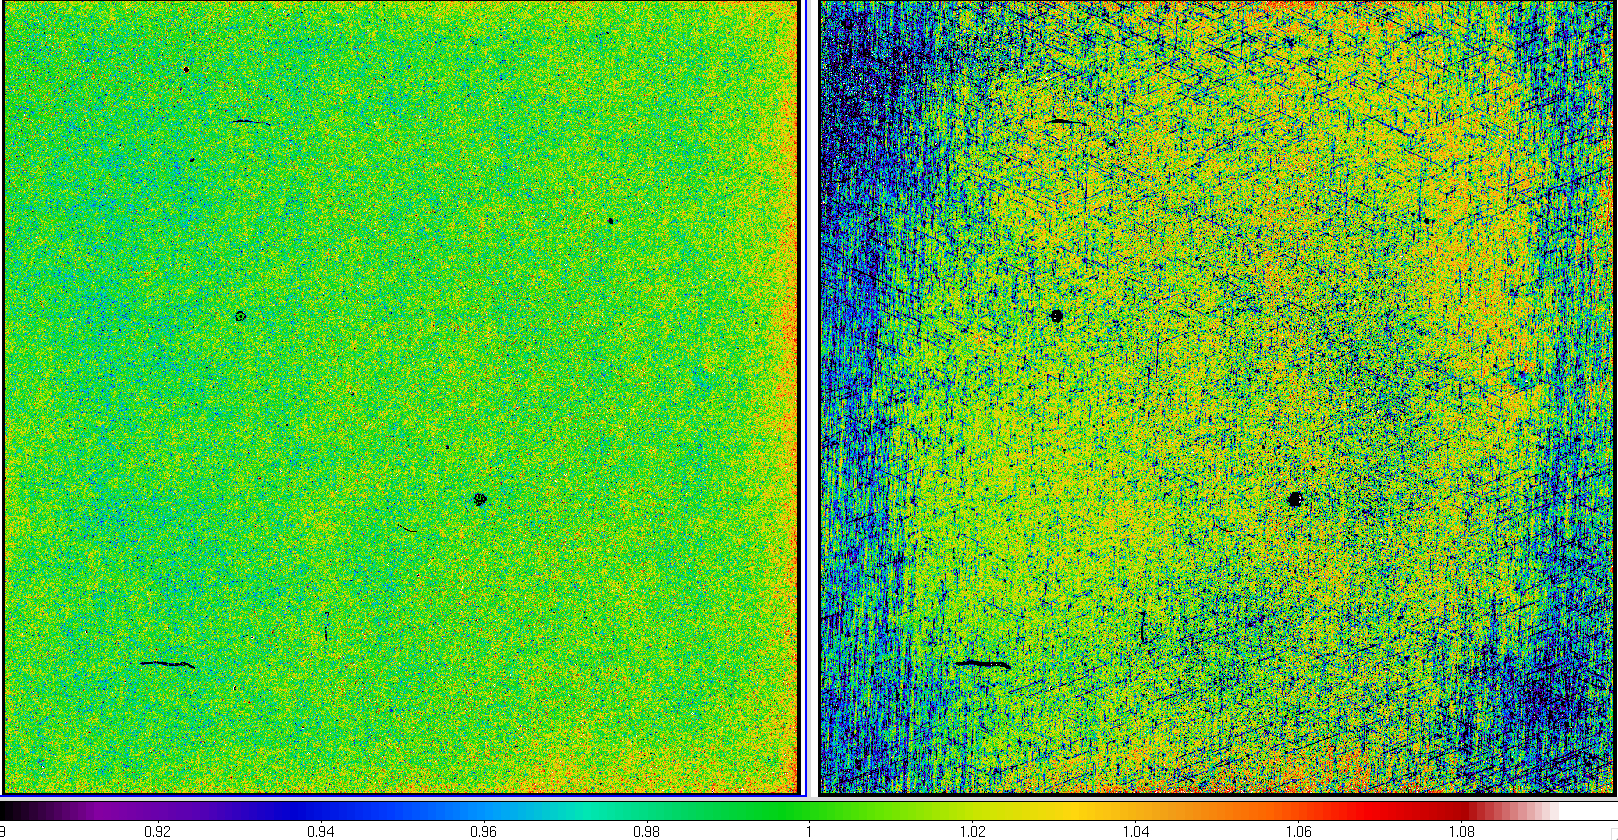 |
| Figure 5 - W1 relative responsivity map generated from post-cryo data (left), compared to that used in preliminary (first-pass) processing (right). |
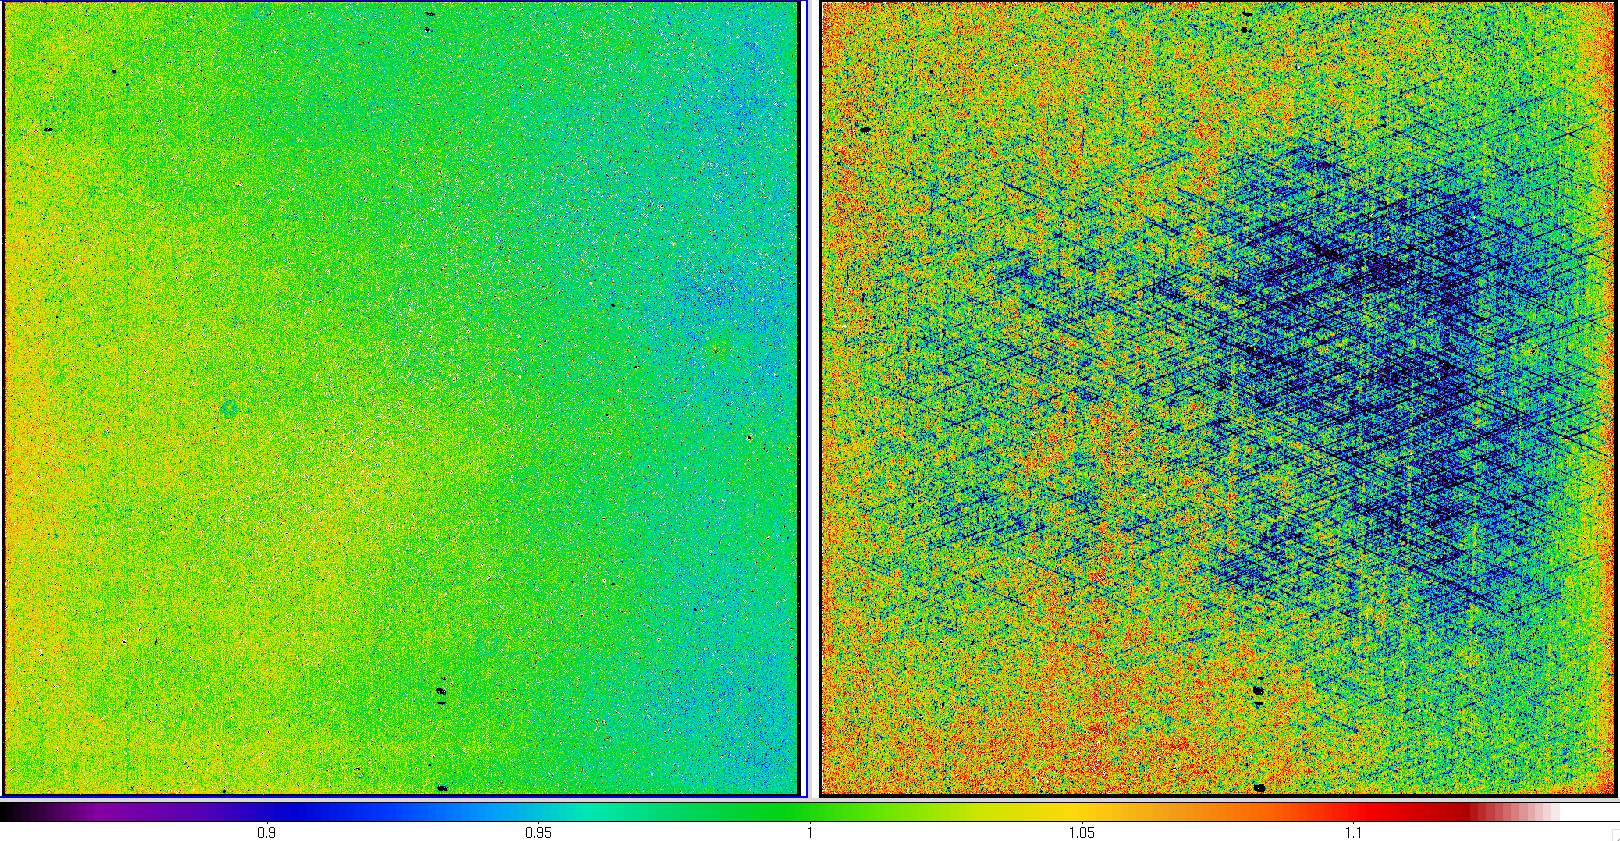 |
| Figure 6 - W2 relative responsivity map generated from post-cryo data (left), compared to that used in preliminary (first-pass) processing (right). |
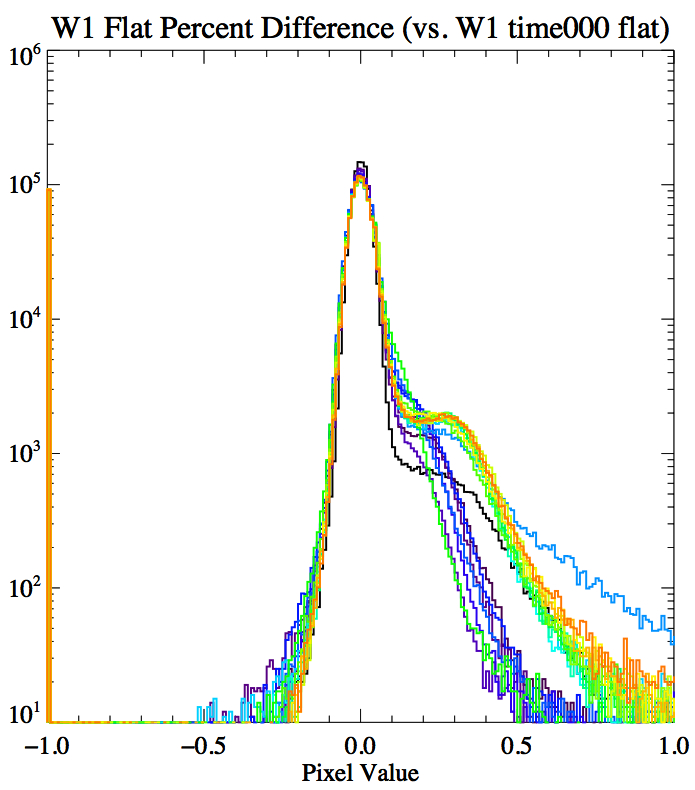
As for the 3-band and 4-band cryo flat-field calibrations (section IV.4.a.vii), new W1 and W2 flats for the post-cryo period were created directly from the survey data. Due to the changing telescope and focal plane temperatures during this period, calibrations were derived for two intervals covering the frame ID ranges: 08746a001 - 09548a277 and 09549a001 - 12514b213. The selection of these intervals was driven by an analysis of the variation in overall pixel responsivities on a finer temporal grid. Twenty equally-spaced time intervals were initially explored and the difference in pixel responsivities relative to the first interval were computed (i.e., (flat[t] - flat[t=0])/flat[t=0]). This is shown by the histograms in Figure 7. Two broad intervals emerged between which the overall spatial structure in the responsivity for each band was significantly different. This difference was greater for W1 than W2 (see Figures 8 and 9 below).
The survey frames used to analyse the time-dependence
of the responsivity were selected to have galactic latitudes
|b| > 15° and with distance > 50° from the moon.
Approximately 9000 frames were used to construct the final
responsitivity maps for each time interval and band.
 |
 |
||
| Figure 7 - Histograms of fractional difference in pixel responsivities for 20 equally-spaced time intervals throughout the post-cryo period relative to those in the responsivity map for the first interval. (W1 - left; W2 - right). Black lines represent the first interval and yellow is the 20th interval. Click to enlarge. | |||
Unlike in 3-band and 4-band cryo processing where the W1 and W2 flats were created using the "classic stacking method", the new post-cryo flats were created using the "slope" method (which was exclusively used for W3 and W4 in the earlier processing phases). This method measured the change in intensity on a pixel in response to the variation in overall intensity on a frame (e.g., from the zodiacal background). The relative responsivity for a pixel is given by the slope of a linear fit to the pixel versus overall frame intensity. This was beneficial for W1 and W2 during the post-cryo period because it did not depend on knowing the absolute level of the dark and bias, which inevitably varied throughout this period.
For these flats, the median accuracy per pixel as derived from the accompanying
flat-field uncertainty maps was ~1.3% and 0.7% for W1 and W2 respectively.
The performance of these flats as quantified in terms of the flat-fielding
residuals in the final calibrated frames is described in section viii.2.
 |
| Figure 8 - Relative responsivity maps for the calibration interval spanning the frame ID range 08746a001 - 09548a277 for W1 (left), and W2 (right). Color bar gives the range of values. Click to enlarge. |
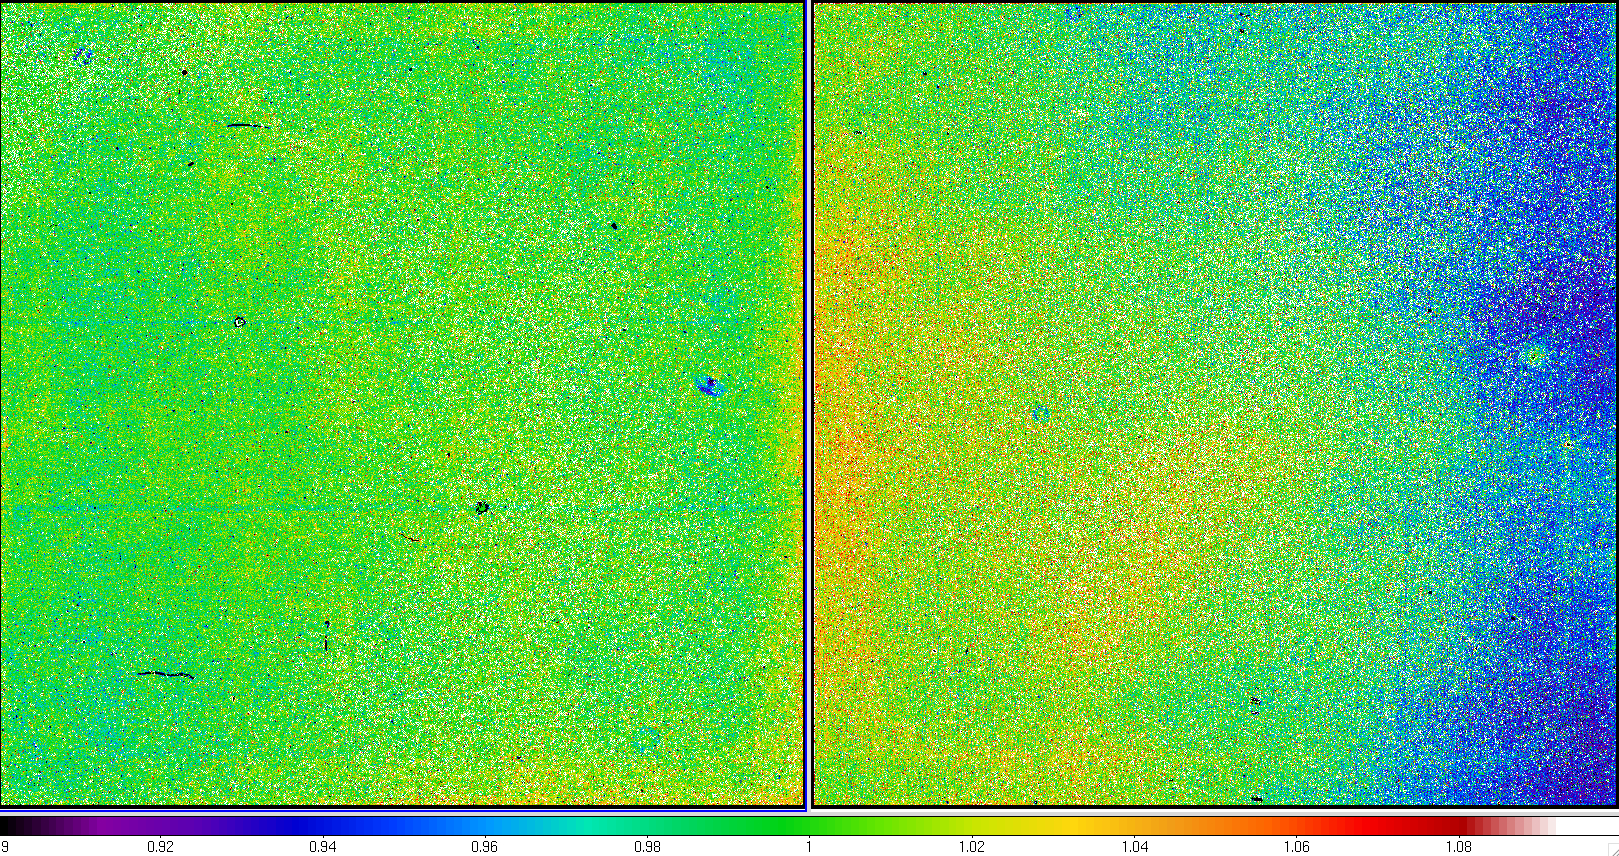 |
| Figure 9 - Relative responsivity maps for the calibration interval spanning the frame ID range 09549a001 - 12514b213 for W1 (left), and W2 (right). Color bar gives the range of values. Click to enlarge. |
The frame-mask bit-definitions for the preliminary post-cryo products were the same as in preliminary (first-pass) cryo processing. As in cryo processing, the frame mask was initialized in the ICal pipeline by first copying all information from the "static" calibration mask into the first 8 bits of a 32-bit buffer and then setting the dynamic bits as each processing step was applied (e.g., saturated pixels and dynamic transient pixel tagging within dynacal).
We started with the W1 and W2 static calibration masks from preliminary cryo processing and updated them with new bad pixels found from characterizing the post-cryo calibrations. Most of the new "bad hardware" pixels were found from analysing the dark and flat calibrations and their uncertainties inferred from the RMS in image stacks. This allowed us to tag additional pixels with a low or high dark value, and/or responsivity, and/or which were relatively noisy over time. Only outlying pixels which consistently did not cleanly subtract or divide out after applying the dark and flat calibrations were masked. The RMS uncertainty threshold for declaring a noisy pixel was >2% for both W1 and W2.
Figure 10 shows a blink animation comparing
the bad-pixel masks (containing only the "statically" tagged
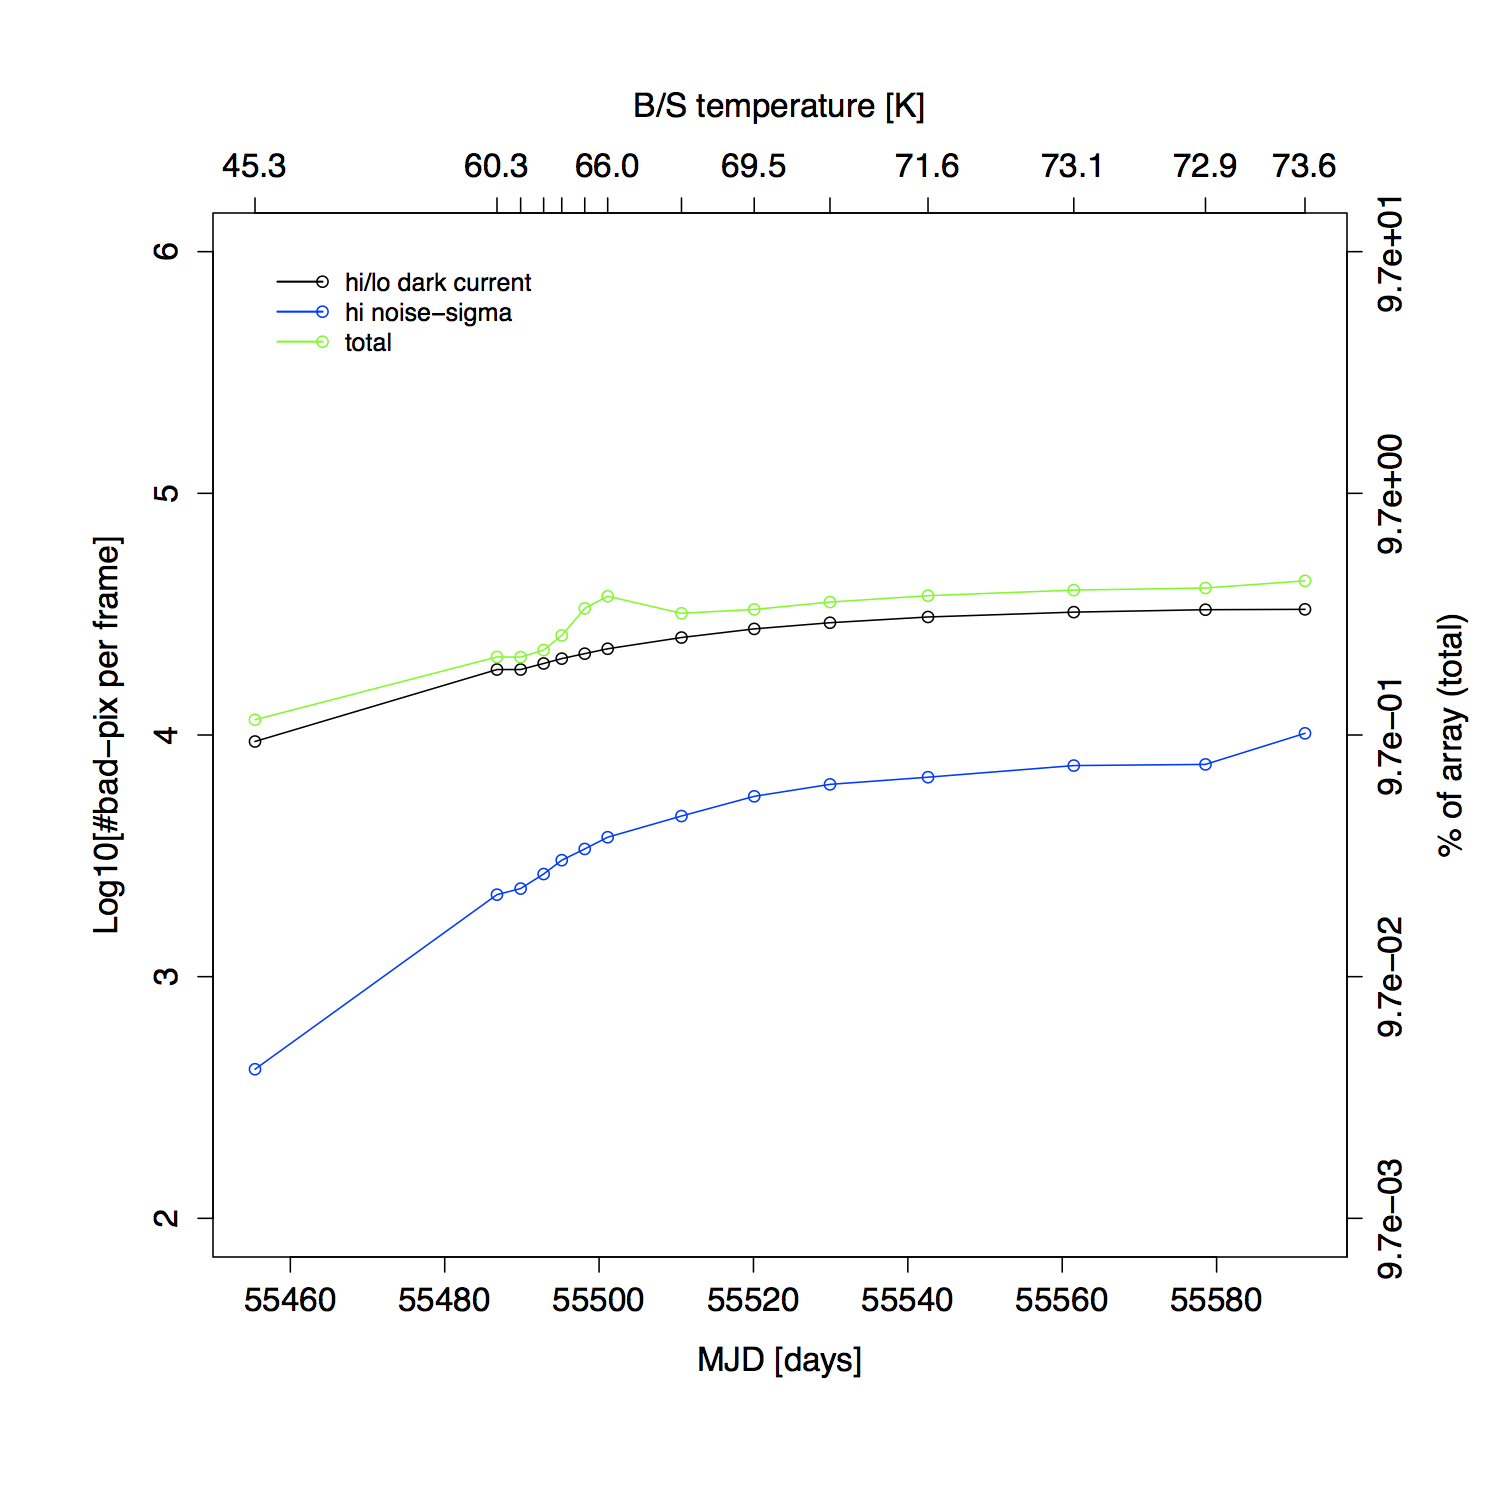
bad-hardware pixels) from preliminary processing of cryo and post-cryo frames. Figures 11 and 12 show
trends in the number
of bad pixels as a function of time and temperature (at the
beam-splitter) over the entire post-cryo period. Only those
bad-pixel conditions tagged "in the majority"
were enumerated, i.e., with high noise and/or low/high dark value, where the
latter may include instances of low/high responsivity.
From the start to the end
of the post-cryo phase, the number of bad pixels tagged
increased by factors ~3 and ~2 for W1 and W2 respectively.
 |
 |
| W1 | W2 |
| Figure 10 - Click on any panel for a blink animation that compares the bad pixels tagged in preliminary (first-pass) cryo processing, to those tagged to support preliminary post-cryo processing. Only the first 7 "statically" tagged bits are shown. | |
 |
 |
| Figure 11 - W1 bad-pixel statistics versus time and temperature over the entire post-cryo period. | Figure 12 - W2 bad-pixel statistics versus time and temperature over the entire post-cryo period. |
The "static" bad-pixel masks were rederived to support processing for the 2013 release to reflect the new calibrations. That is, it is likely the new darks and flats will have removed any new bad pixels after they were applied to the data and it's important to mask only new bad pixels not removed by the new calibrations. We started with the "cleaner" static calibration masks from 4-band cryo processing and updated them with new bad pixels by stacking sets of pre-normalized calibrated frames using an average and then detecting outliers in the pixel distribution. If the flats and darks perfectly removed all "static" bad pixels, no residual outlying pixels should be present in the stacked products. Instead, of order 2500 and 2800 pixels were additionally tagged as having an abnormally high/low dark current and/or responsivity in the W1 and W2 masks respectively.
We also tagged "noisy" (temporally varying) pixels by
examining the flat-field stack-uncertainty maps. There were a few hundred
of these for each band (in addition to those from 4-band cryo).
New masks were created for two calibration intervals
as shown in Figures 13 and 14.
These are the same calibration intervals
on which all other post-cryo calibrations were derived.
 |
| Figure 13 - Static bad-pixel masks for the calibration interval spanning the frame ID range 08746a001 - 09548a277 for W1 (left), and W2 (right). Color coding approximately represents the decimal values involving the first 7 (static) mask bits. Click to enlarge. |
 |
| Figure 14 - Static bad-pixel masks for the calibration interval spanning the frame ID range 09549a001 - 12514b213 for W1 (left), and W2 (right). Color coding approximately represents the decimal values involving the first 7 (static) mask bits. Click to enlarge. |
We used the same calibrations as used in first pass processing to support the preliminary data release (section IV.3.a.ii.1).
The electronic gain and read-noise for use in the pixel error
model (Eq. 2 in section IV.4.a.ii)
were derived in the same manner as for 3-band and 4-band cryo described in
section IV.4.a.ii.1. For post-cryo, these were derived for two calibration intervals defined
by the frame-ID ranges in Table 1.
| Band / frame-ID range | Gain [e-/DN] |
Read-noise sigma [DN/pixel] |
|---|---|---|
| 1 (08746a001 - 09548a277) | 2.813 | 2.930 |
| 1 (09549a001 - 12514b213) | 2.400 | 2.883 |
| 2 (08746a001 - 09548a277) | 3.709 | 2.858 |
| 2 (09549a001 - 12514b213) | 3.725 | 3.132 |
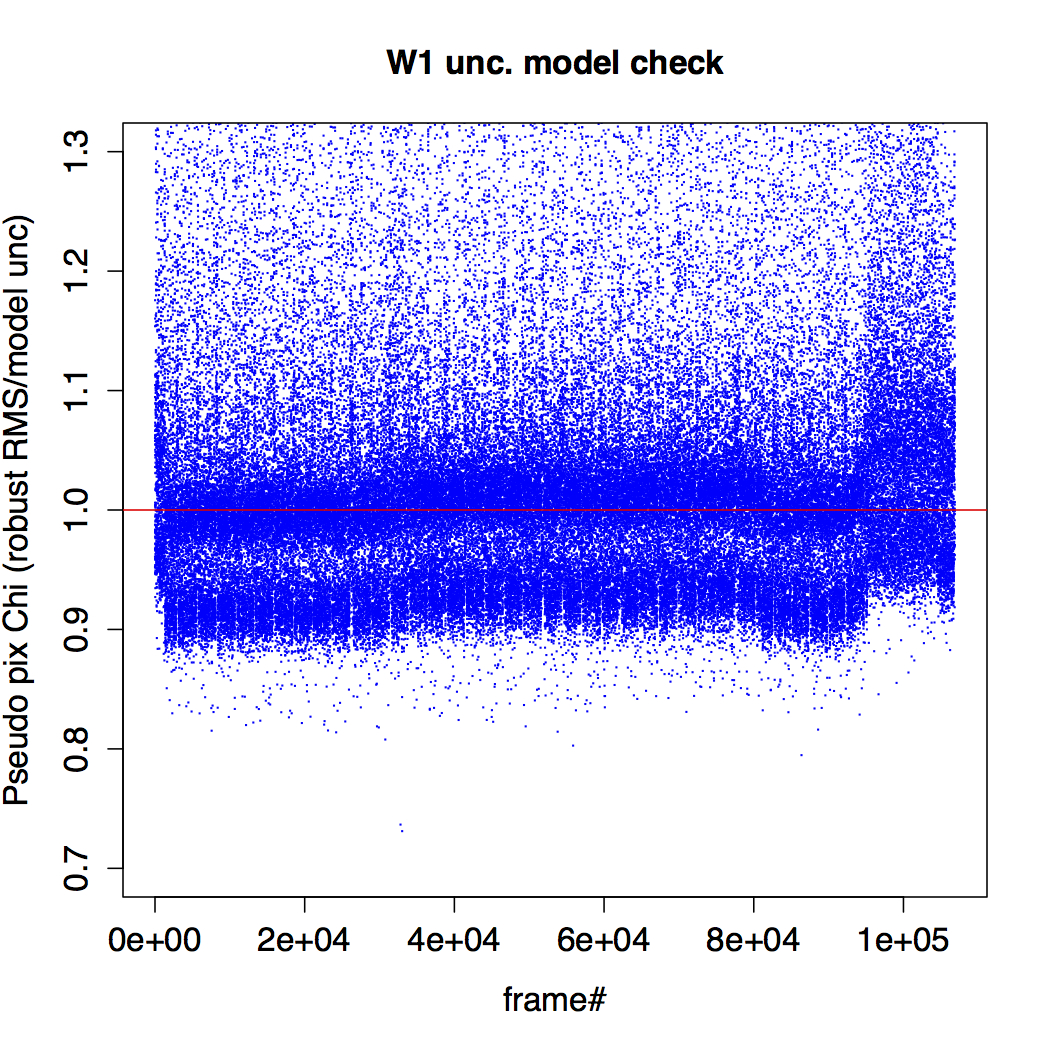
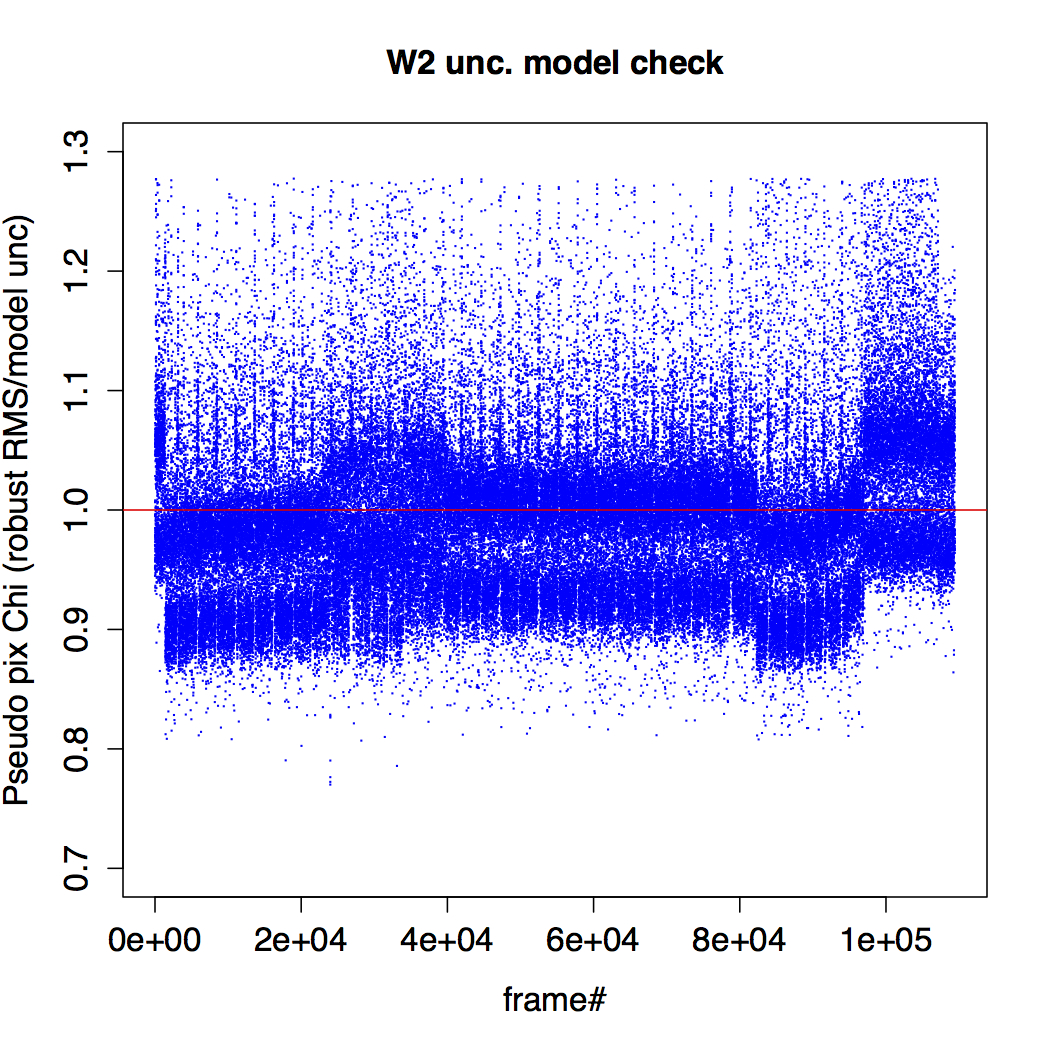
The uncertainty frame products based on the gains and read-noise values
in Table 1 were validated against
measurements of the RMS fluctuation about the background in the
corresponding intensity frames.
A trimmed lower-tail standard deviation from the
mode was used as a proxy for the robust RMS. This measure was divided by the mode
of pixel uncertainties over the same regions to compute
a pseudo χ measure per pixel.
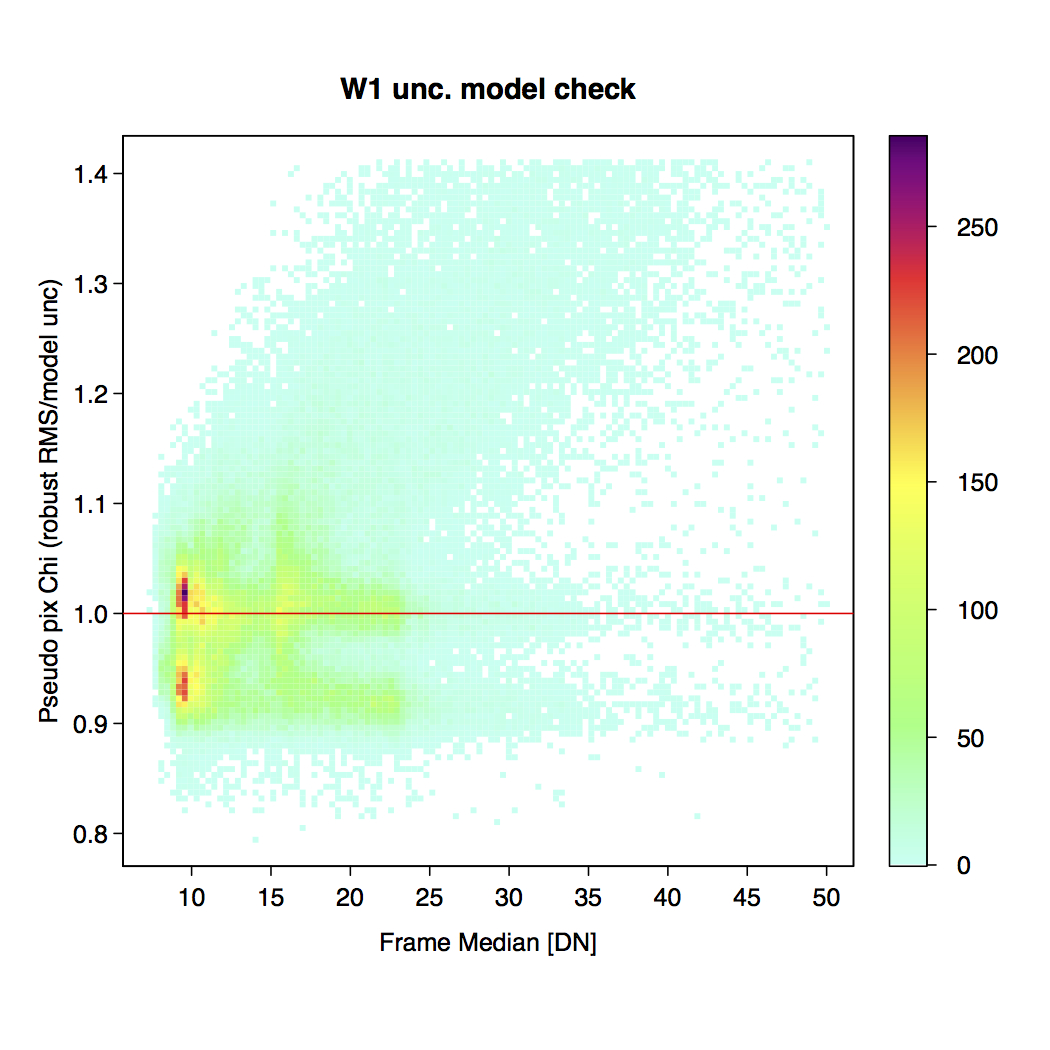
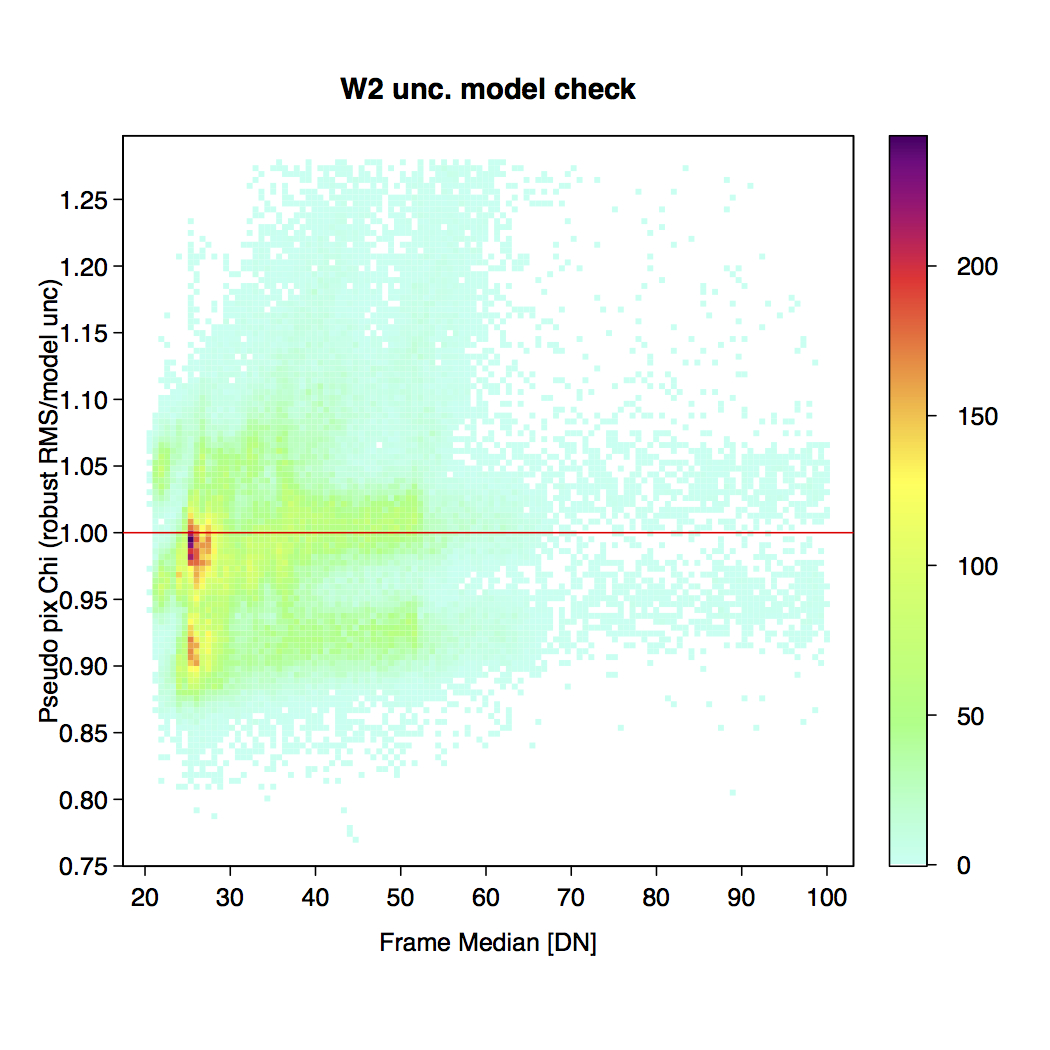
This measure is shown as a function of frame number in Figure 15 for
scans in the middle of the post-cryo period and also versus
frame pixel median in Figure 16. The bi-modality in χ values in these Figures is due to galactic
plane crossings during the post-cryo phase where the RMS, even though robust,
was still affected by the high stellar density when observing from
one side of the WISE orbit.
Overall, our pixel uncertainty model estimates tracked
the noise fluctuations in pixel signals reasonably well over
the post-cryo period.
 |
 |
||
| Figure 15 - Ratio of "robust pixel RMS/model (modal) pixel uncertainty" versus continuous frame# in the middle of the post-cryo period (W1 - left; W2 - right). | |||
 |
 |
||
| Figure 16 - Ratio of "robust pixel RMS/model (modal) pixel uncertainty" versus frame median for ~100,000 frames (per band) shown as color-density plots. Point densities are represented by the color bar (W1 - left; W2 - right). | |||
Processing for this release did not include any corrections for amplifier/channel-noise biases.
An overview of the algorithm for correcting channel-noise biases to support the AllSky and 3-Band Cryo Data releases was given in section IV.4.a. For these releases, we made extensive use of the "reference" pixels at the ends of each channel, which mostly recorded the amplifier bias levels. The reason for this is that in the cryo phase of the mission, the signal in the reference pixels correlated rather well with the signal in their corresponding "active" pixels for each channel. This enabled a robust algorithm to be used. However, as the detectors warmed up and equilibrated in the post-cryo phase, this correlation was lost. We therefore resorted to correct for the "bulk channel fluctuations" using the active pixels for each channel. This entailed computing the pixel mode in each channel and checking for significant offsets relative to the adjacent channels. If significant, the levels were equalized across channels.
In addition to the "bulk channel fluctuations", other parameters and thresholds were tuned to optimize corrections for the other flavors of channel-noise summarized in section IV.4.a. These flavors exhibited different signatures in the post-cryo phase. Figure 17 shows a blink animation comparing post-cryo frames processed using the old (cryo-based) algorithm versus those processed using the new algorithm optimized for post-cryo.
Given we used the active pixels to compute and apply the bulk-channel
corrections, there was a potential to be affected by complex
background emission, leading to erroneous corrections. To minimize
this, we used relatively high thresholds. However,
there are frames in the 2013 Post-Cryo release where an erroneous
correction was inadvertently applied. This is more prevalent in
W2 where some frames show elevated channels.
This was rare and most likely occurred when
bright extended emission spanned a large area of a channel.
 |
 |
| W1 | W2 |
| Figure 17 - Click on any panel for a blink animation that compares the channel noise corrections on post-cryo W1, W2 frames using parameters tuned for the cryo phase versus those optimized for post-cryo. | |
We used the same dynamic-calibration procedure for tagging bad-pixel transients and computing sky-offsets as used in first pass processing for the preliminary data release.
This release fixes two issues with regards to dynamic calibration (dynacal), first, the tagging of bad-pixel transients was not done optimally for the All-Sky and 3-Band Cryo releases. In the course of testing, it was discovered that there was a potential to overestimate the number of dynamically tagged bad pixels by a factor of 1.5 to 2. The impact on the All-Sky and 3-Band Cryo Data releases was that more pixels were masked than necessary in downstream multiframe processing.
The second issue in the All-Sky and 3-Band Cryo Data releases regarded
computation of the dynamic sky-offsets. This was discovered indirectly by its impact on
the catalog photometry. The problem arises from including
the actual frame on which the sky-offset was applied
in the windowed frame-stack itself. This resulted in
an excess of pixel values around the stack median
in the final processed frame. This excess is discerned
as a spike in the pixel histogram (see Figure 18a).
Given a finite number of Nw frames in a window are stacked,
a fraction 1/Nw of the pixels in the frame
will inevitably equal the median exactly by chance. This
is because the median will pick-out discrete values equal
to one of the input measurements when the number of inputs is
an odd integer. This anomaly was present throughout the
cryo mission processing and caused local backgrounds to be overestimated
during photometry.
Consequently, this lead to photometeric fluxes being systematically
underestimated as described in section VI.3.c. The impact was mostly to W1 and W2, while the higher backgrounds
in W3 had a tendency to suppress the effect. The fix was simply to omit
the target frame from the input stack used to compute the sky-offset. Figure 18 shows an example of a W1 frame pixel histogram before and after the
"spike" fix.
 |
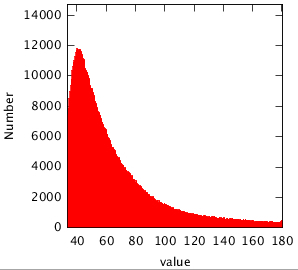 |
| Figure 18a - Example of a W1 frame pixel histogram before the sky-offset "spike" fix. | Figure 18b - Pixel histogram for the same frame after the fix. |
To explore the accuracy of the interim post-cryo calibrations described above, we applied them to a handful of frames and compared the products to those generated using the former preliminary (cryo-tuned) calibrations. The dynamic calibration pipeline was also exercised here since it was an integral part of the processing. This process generated the sky-offset calibrations whose intent was capture short-term variations in the bias and dark structure that could not be corrected by the static longer-term calibrations.
Results are shown in Figures 19 and 20 for W1 and W2 respectively.
The top row in these figures (left-to-right) shows
a frame that was processed using the
old (cryo-tuned) calibrations before subtracting the sky-offset, after subtracting the sky-offset,
and the sky-offset calibration itself. Note how the sky-offset
picked up the residuals from use of a bad static
dark and flat-field calibration.
The bottom row in these figures represents the same frame
sequence but now using the new dark and flat tuned to post-cryo data.
Note how the residual variations in the sky-offset product
are more clustered around zero (see color bar).
The new post-cryo dark and flat calibrations therefore provided
the dynamic calibration pipeline with more accurate priors.
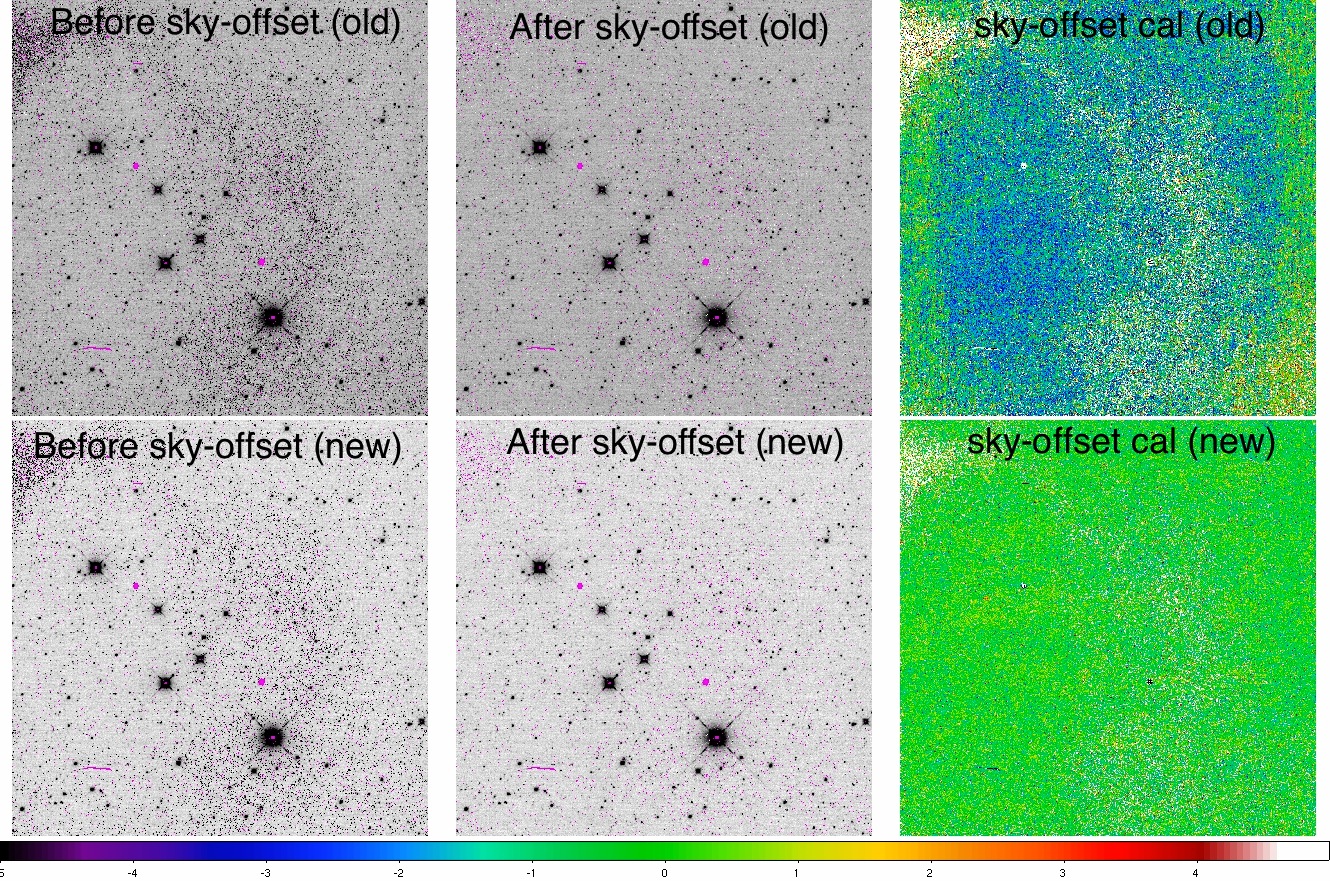 |
| Figure 19 - Montage of W1 frame products processed using the old (cryo-tuned) and new post-cryo calibrations before and after application of the dynamic sky-offset. See section VIII.3.b.v for details. |
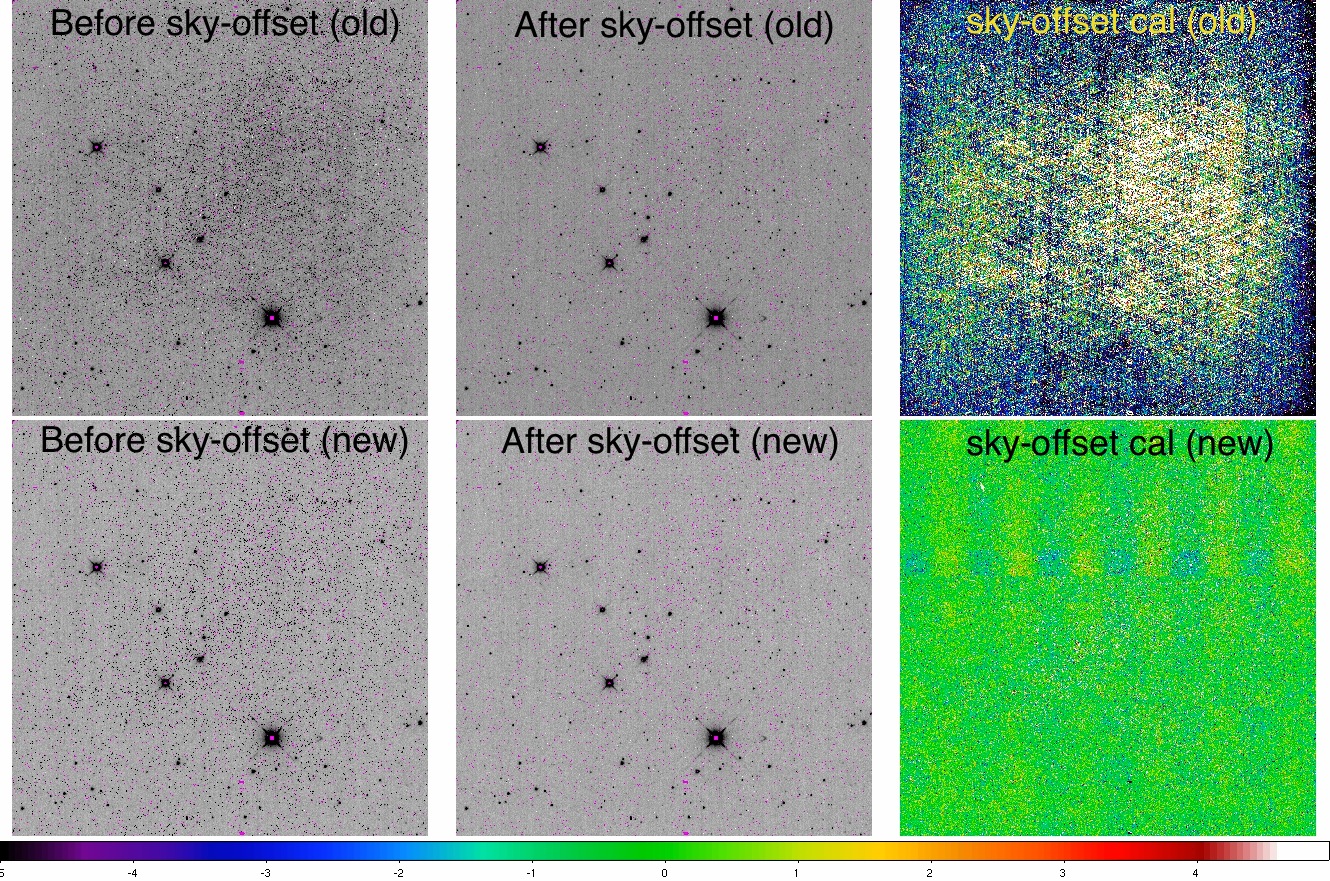 |
| Figure 20 - Montage of W2 frame products processed using the old (cryo-tuned) and new post-cryo calibrations before and after application of the dynamic sky-offset. See section VIII.3.b.v for details. |
Our second test involved exploring the impact of the new post-cryo
calibrations on the RMS-noise in frame products
relative to the older (cryo-tuned) calibrations.
If the new calibrations removed more residual systematic structure,
then a drop in the spatial RMS relative to the
old calibrations was expected. We examined the pixel-noise statistics over
a run of 50 consecutive frames in a scan using a robust
estimate of the RMS: the median (50th percentile) -
16th percentile of the pixel distribution in a frame. Figures 21a and 21b show the results.
Indeed, a consistent drop of ~2% was seen in the pixel RMS in both
the W1 and W2 frame products.
 |
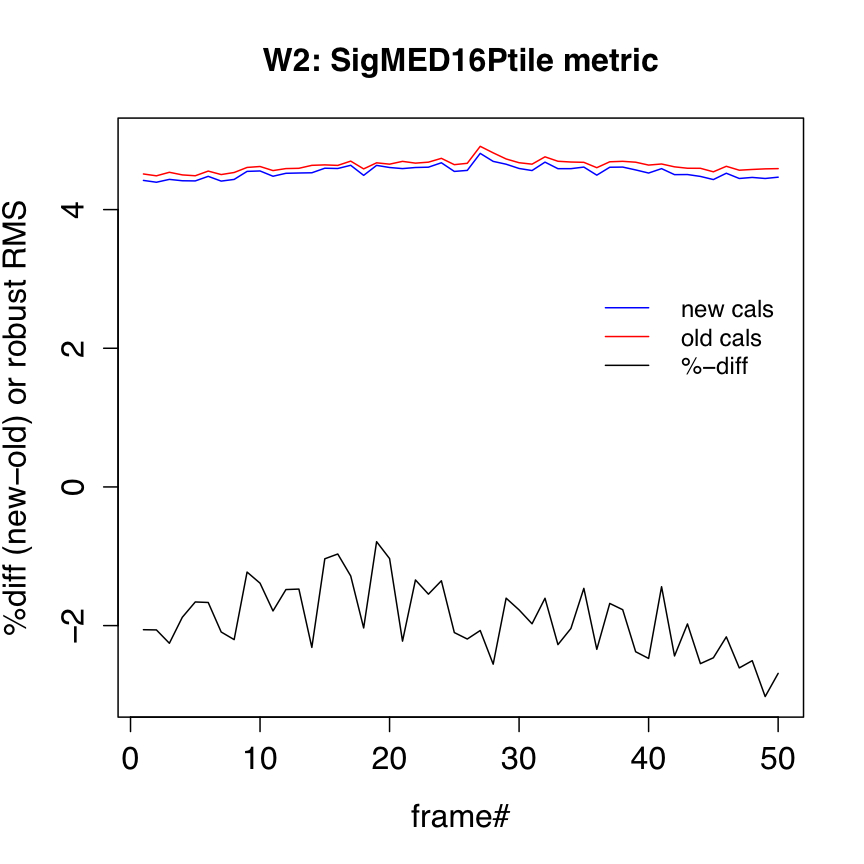 |
| Figure 21a - W1 pixel RMS and its percentage difference in frame products processed using the new post-cryo and old (cryo-tuned) calibrations. | Figure 21b - W2 pixel RMS and its percentage difference in frame products processed using the new post-cryo and old (cryo-tuned) calibrations. |
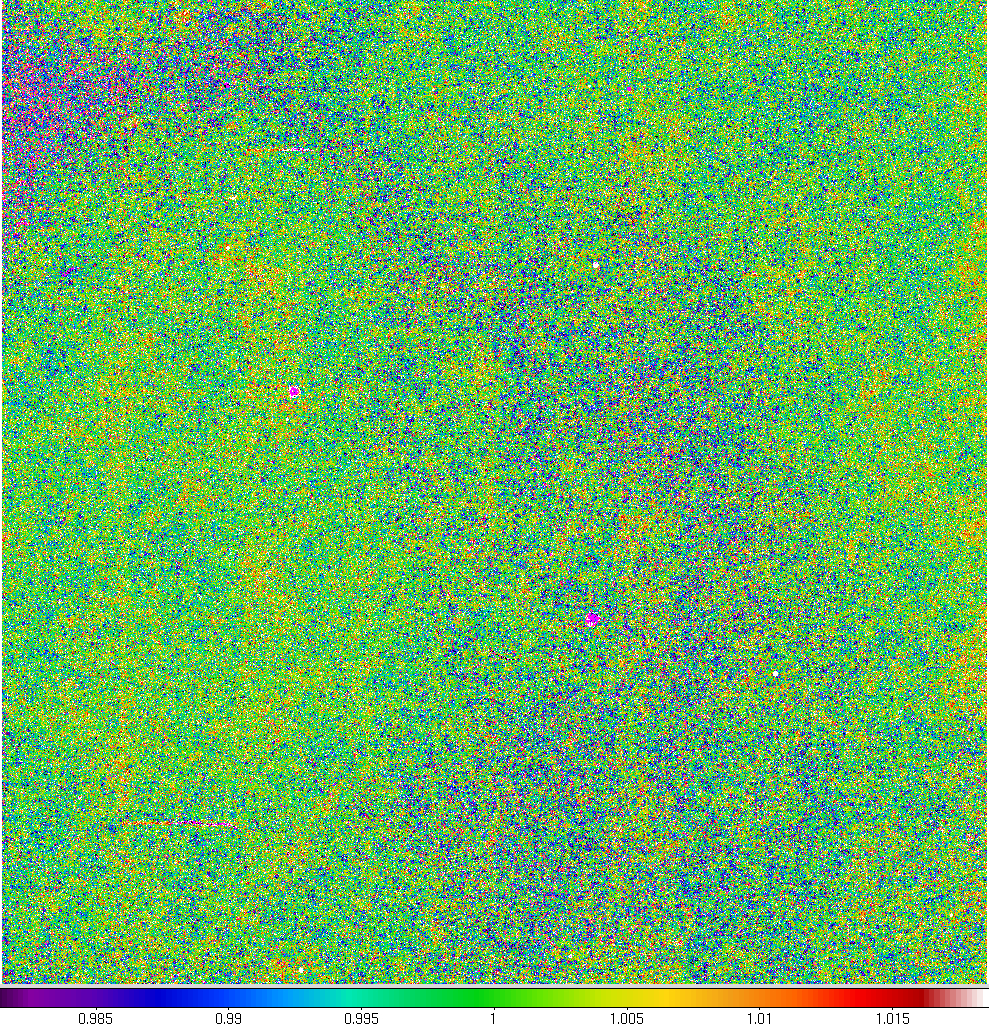
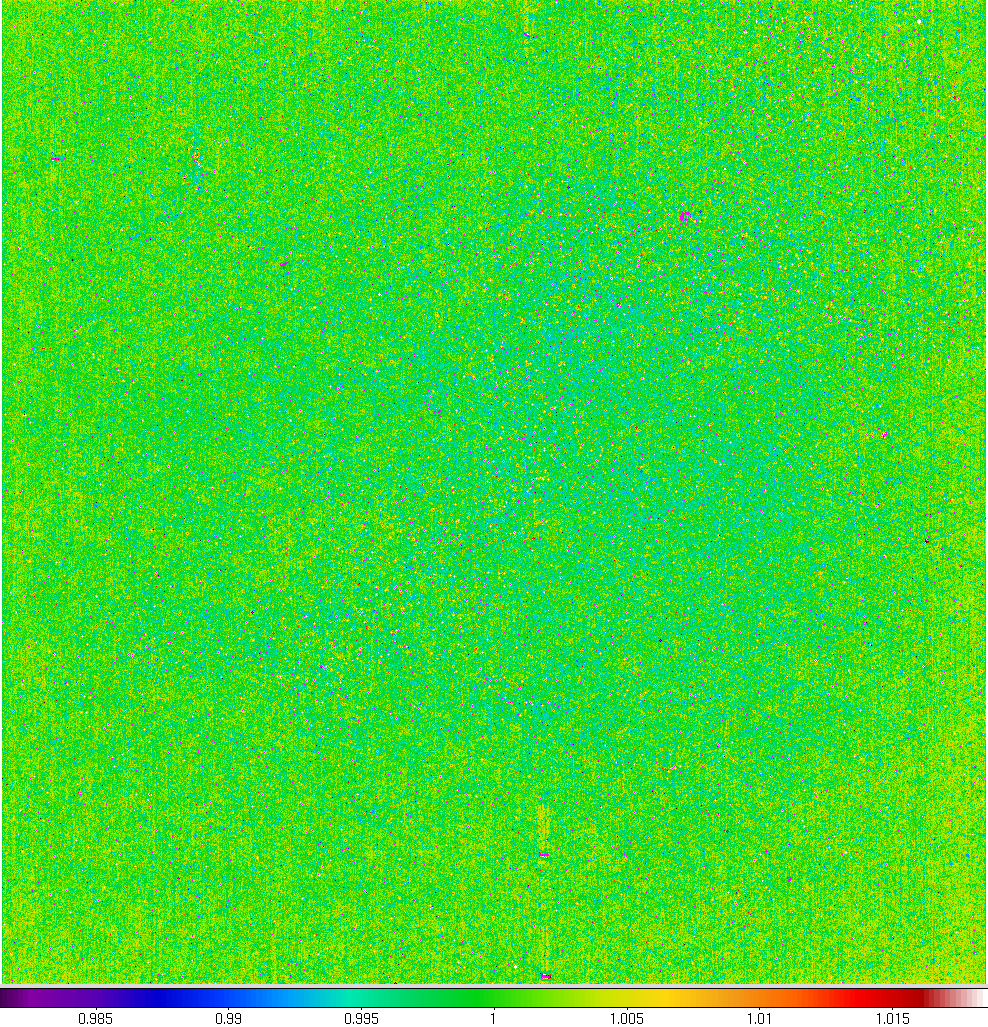
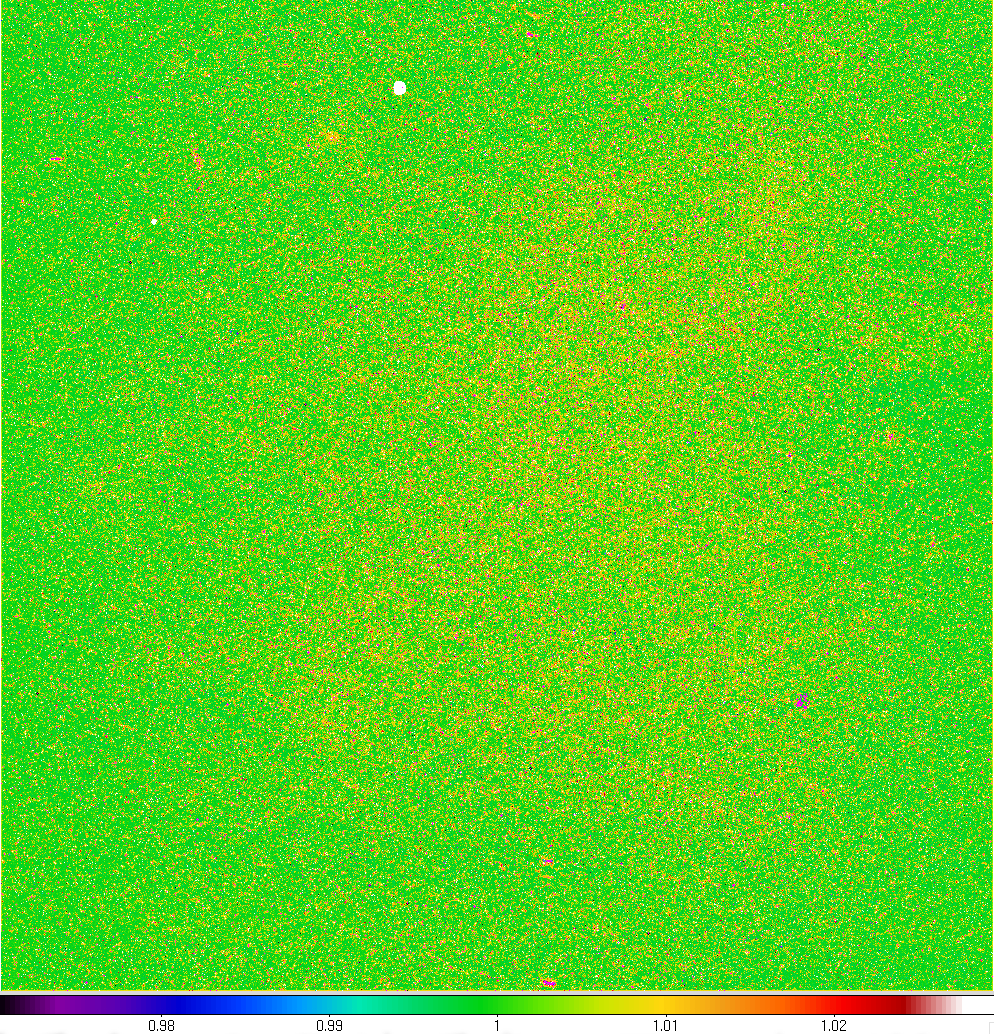
One of the checks performed for this release was the relative flat-fielding accuracy in the calibrated single-exposures. We combined approximately 30,000 instrumentally calibrated frames using a trimmed average and then renormalized to derive a residual pixel-gain map. Each input frame was first normalized by its modal pixel value. Only frames > 35° from the moon and with |b| > 15° were used. This was done separately for an early and late set of post-cryo scans [ranges 08748a - 08925a and 12181a - 12514a respectively].
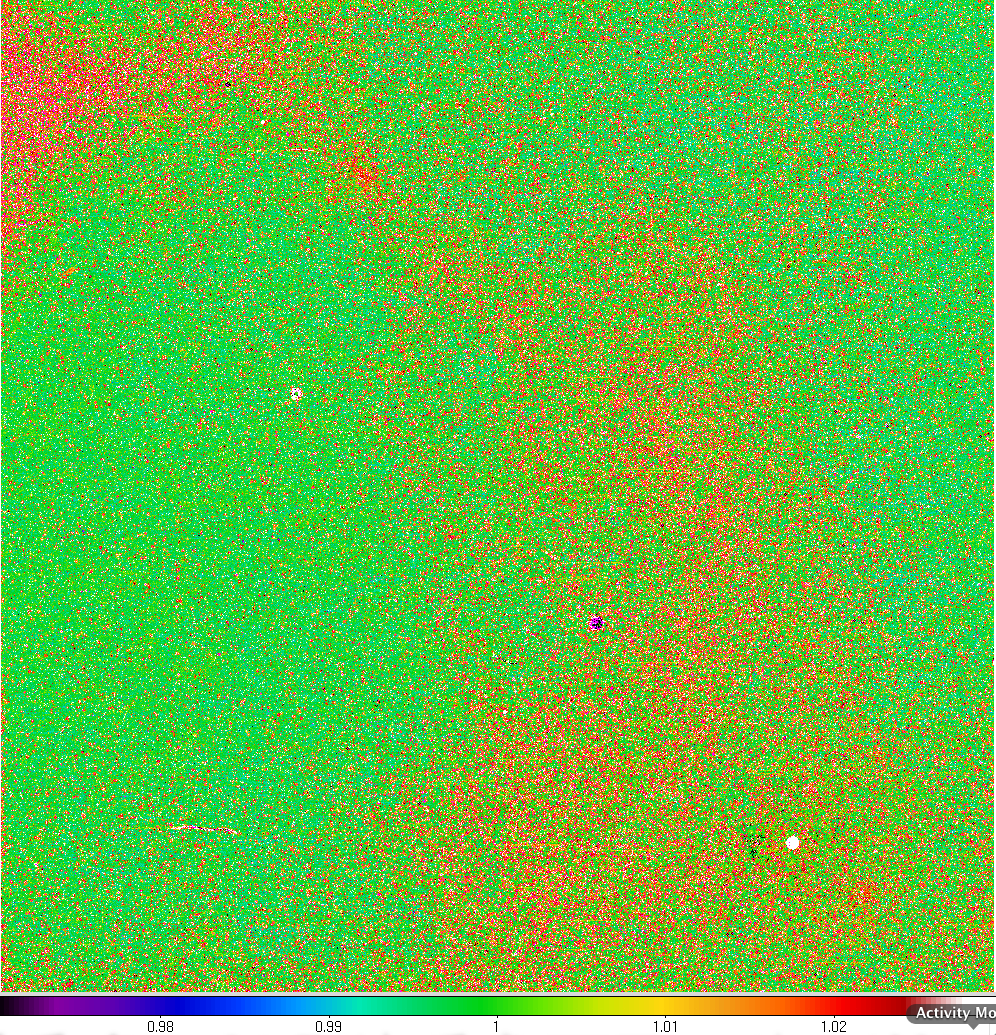
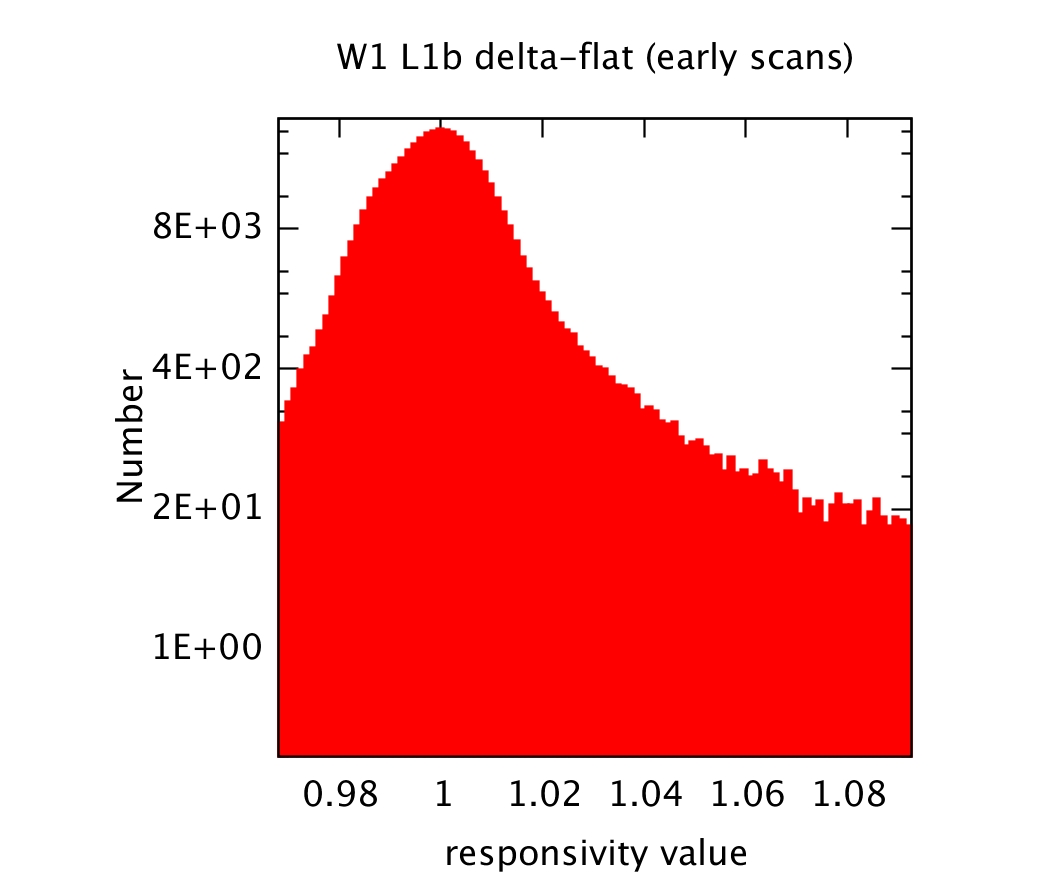
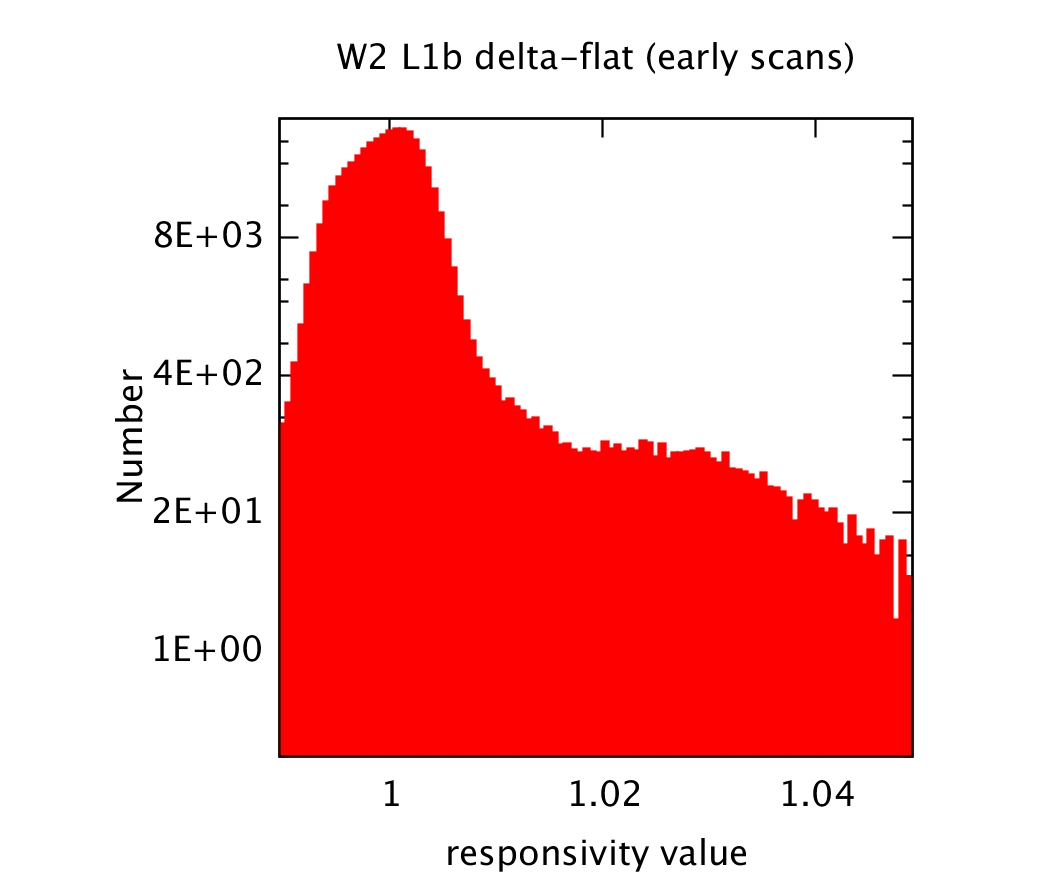
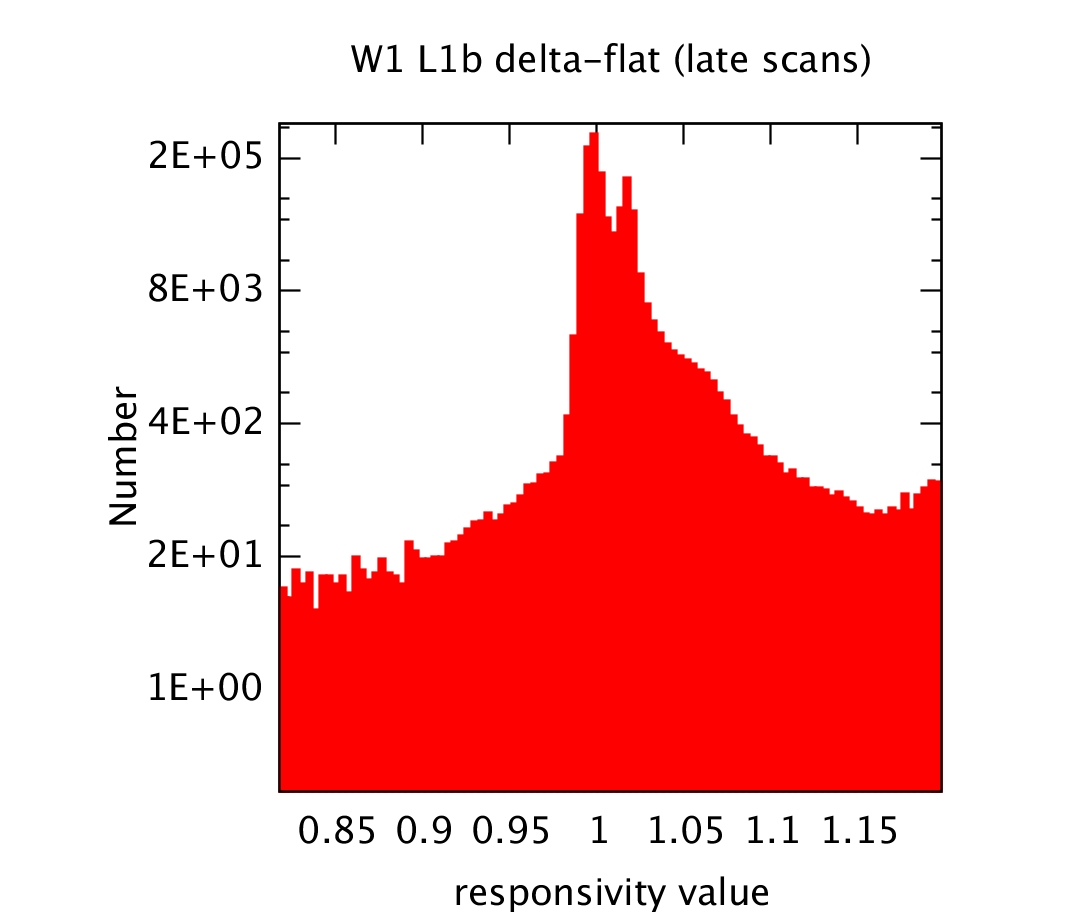
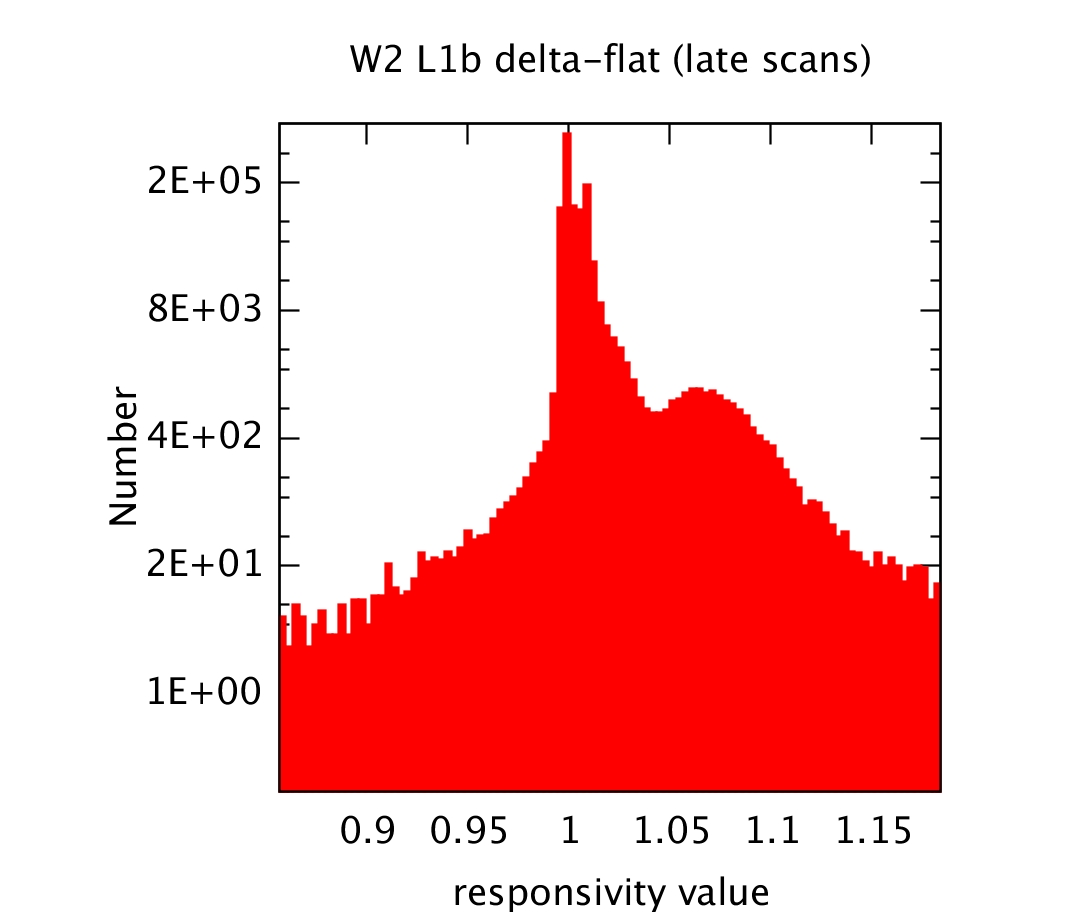
Figures 22 and 23 show the residual gain maps for the early and late scans respectively. The uncertainty per pixel in these gain maps is ~ 0.15 - 0.25%. The color bars depict the range of pixel values. Corresponding histograms are shown in Figures 24 and 25 respectively. Bad pixels (NaN'd pixels in the input frames) are colored magenta.
For the early post-cryo phase, ~95% and ~99% of the pixels have residual "gain" values falling in the range 0.98 to 1.02 (i.e., within ±2%) for W1 and W2 respectively.
For the late post-cryo cryo phase, ~86% and ~95% of the
pixels have residual "gain" values falling in the range 0.98 to
1.02 (i.e., within ±2%) for W1 and W2 respectively. This
implies that the relative responsivity variations were
calibrated more accurately in the earlier phase of post-cryo.
 |
 |
||
| Figure 22 - Left: W1 residual gain map for "EARLY" post-cryo scans. Right: Same for W2 with same stretch [Click to enlarge]. | |||
 |
 |
||
| Figure 23 - Left: W1 residual gain map for "LATE" post-cryo scans. Right: Same for W2 with same stretch [Click to enlarge]. | |||
 |
 |
||
| Figure 24 - Histograms corresponding to the residual gain maps in Figure 12 made from "EARLY" post-cryo scans. Tails are truncated. | |||
 |
 |
||
| Figure 25 - Histograms corresponding to the residual gain maps in Figure 13 made from "LATE" post-cryo scans. Tails are truncated. | |||
Last update: 2013 June 6