

Distortion in the WISE optics began to change as soon as payload temperatures started to increase following the exhaustion of hydrogen ice in the WISE outer cryogen tank. During the 3-Band Cryo phase, these changes were most pronounced in W3 (see VII.3.d). As temperatures rose further during the Post-Cryo survey phase, the distortion began to change noticeably in W1 and W2, and continued to change throughout that survey period.
The most significant update to the position reconstruction pipeline module for second-pass Post-Cryo data processing was the introduction of time-dependent distortion maps to track system changes during the Post-Cryo survey phase. This results in improved overall astrometric accuracy for the NEOWISE Post-Cryo data release products. Derivation and performance of the time-dependent distortion model are described below.
A static distortion model that was originally developed for the 4-Band-Cryo data was used during first-pass processing of the Post-Cryo data that produced the NEOWISE Post-Cryo Preliminary Release data products. Consequently, astrometric solutions of the NEOWISE Post-Cryo Preliminary Release image and source data exhibit time-dependent biases that are effectively equivalent to the time-dependent effects captured in the dynamic distortion modeling described below. The NEOWISE Post-Cryo Preliminary Release astrometry also suffered from the effects of a pipeline coding error which significantly biased the reconstructed position of about 20% of the faint (W1>13 mag) sources by as much as 1 arcsecond. This error was corrected in all second-pass processing of WISE data . The 2013 NEOWISE Post-Cryo Release products do not suffer from this astrometric bias.
Distortion modeling for the second-pass Post-Cryo position reconstruction was carried out using the same approach that was used for the full cryogenic mission, as described in IV.4.d.vii. The equatorial positions of 2MASS astrometric reference sources (2MREF) are mapped into band-frame pixel X,Y coordinates and differenced from the positions of the corresponding of single-band WISE source extractions over a large number of frames. These differences are then fitted with a 4th-order polynomial in each band separately. The resulting fits not only provide non-linear distortion terms, but also scale adjustments and, taken together, band-to-band translation and rotation.
To model the time-varying distortion behavior, the Post-Cryo period was divided into 99 windows equally spaced in time, with the exception of the endpoints and one discontinuity point. Ninety-nine separate distortion fits to the data were made, most of which were separated by 1.25 days, with each fit based on three days of data. For clarity, we refer to the 1.25 day separation as the "use-window" width and the three days as the "fit-window" width. This approach was the result of a trade-off between having sufficient data for a reliable fit while maintaining enough time resolution to track rapidly varying changes. Note that this results in some smoothing, since overlapping data are used in adjacent fit windows. Because of the smoothing, neither fit nor use windows were allowed to span a discontinuity. For this reason the use-window center point does not always coincide with the fit-window center when near a discontinuity. For Post-Cryo data, the significant discontinuities were at the transition from 3-Band Cryo phase and at a time point around MJD=55501 when the spacecraft reaction wheel friction coefficients were updated. When the distortion fits were used by Single-exposure position reconstruction (SFPRex) in second-pass pipeline processing there was no interpolation done on the distortion coefficients. In other words the distortion coefficients were kept static over all frames in a given "use-window."
Given that the distortion fits included linear terms in addition to the higher order terms, separately fitting each band to 2MRef accounted for band-to-band position and rotation changes with time as well. Figure 1 demonstrates how rapidly changes occurred during the Post-Cryo phase. In it, the differences in distortion fit constant terms (W2-W1) are plotted as a function of MJD throughout the Post-Cryo period. For clarity these differences were zeroed out at the beginning. If one were to assume a constant distortion model, as was the case during the first-pass processing, these errors would go uncorrected. They would show up in the W2 band-frame positions, given that W1 errors are essentially nulled out in the Single-exposure position reconstruction.
Evaluating the relative position reconstruction errors between bands (i.e. the band-frame errors) as a function of time provides a good indication of the performance of time-dependent model. To that end, a sample of 83,578 frames was randomly selected from Post-Cryo data and the W1 and W2 single-band source positions were separately compared to 2MRef positions. A linear least-squares fit was made for each band-frame resulting in five fit parameters: 2 translation (dX and dY), one rotation and two scale parameters. The results were then broken down into 99 time bins and evaluated.
The mean W2-W1 position difference errors are plotted as a function of MJD in Figure 2. This indicates how well the band-frames are aligned after the time-dependent distortion fits have been applied. Over most of the time period the mean dX values are close to zero and the mean dY values are less than 10 mas.
The mean W1 and W2 frame rotation errors (red=W1 & blue=W2) as measured with respect to 2MRef are plotted as a function of time in Figure 3. Again,the W1 errors are very close to zero throughout the period. The mean W2 errors are slightly larger, but still negligible. The mean W2 rotation errors average 1.67 arcsec with a peak around 5 arcsecsec. So on average the resulting W2 source position error at an extreme corner of the focal plane is about 16 mas, and much less over most on the focal plane.
The mean fractional W1 and W2 X and Y scale factor errors as measured with respect to 2MRef are plotted as a function of time in Figures 4 and 5, respectively. The W1 Y scale errors are slightly smaller than those in X, but both X and Y errors are <2x10⁻⁵. On average the W1 band-frame scale error in X contributes 17 mas to a W1 source position error at frame edge. W2 shows even smaller band-frame scale errors. One should bear in mind that the source position errors based on band-frame reconstruction referred to in this section refer to single-band source position errors, not final multi-band reconstructed source position errors that are discussed below. This was necessary in order to derive the band-level evaluation needed. In general the contribution of band-frame errors to the final reconstructed source position errors is even smaller, except where W1 and W2 band-frame errors are highly correlated.
The accuracy of the reconstructed source positions that are given in the NEOWISE Post-Cryo Release Single-exposure Source Database were compared to positions in the 2MASS Point Source Catalog. To accomplish this, one out of every five Post-Cryo Single-exposure frames with a quality score of 5 or higher were randomly selected. From the selected frames, sources with W1 SNR>20 were matched to 2MASS and matches with a 2D position Chi-Sq>16 were retained to minimize chance associations. Note that the matching was done to to the full 2MASS PSC, not 2MRef, so include fainter WISE sources than those used in the band-frame evaluation. This exercise resulted in a sample of almost 161 million WISE-2MASS matches upon which the analysis in this section is based.
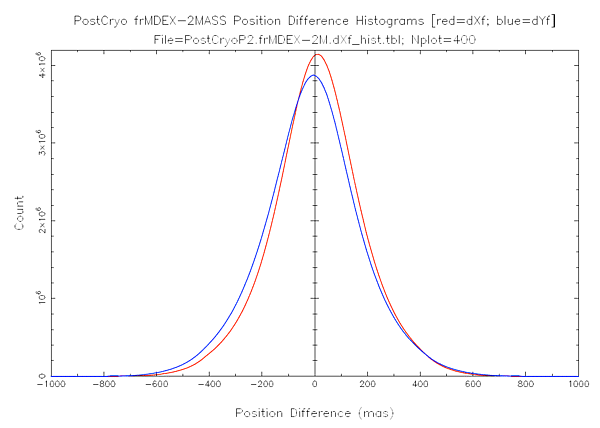
Histograms of the WISE-2MASS X and Y position differentials for all associated sources are plotted in Figure 6. The mean and RMS offsets in each coordinate are given in Table 1. As has been observed for other survey phases the reconstruction is slightly poorer in the Y coordinate than in the X coordination. This is most likely because Y corresponds to the scan direction and small variations in the scan rate can lead to slight elongations of the PSF.
| Coordinate Axis | Mean offset (mas) | RMS offset (mas) |
|---|---|---|
| X | 10.5 | 175.3 |
| Y | -10.5 | 187.9 |
 |
| Figure 6 - Histograms of the X (red) and Y (blue) position differences between the Post-Cryo Single-exposure Source Database and the 2MASS Point Source Catalog. |
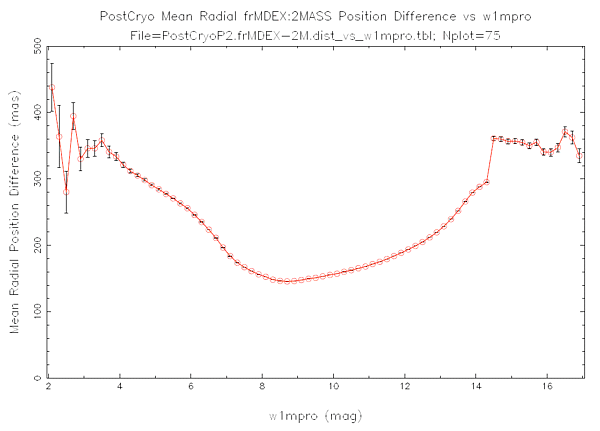
Position differences on coordinate each axis (X and Y) between the NEOWISE Single-exposure Source Database and the 2MASS PSC are plotted as a function the W1 profile-fit source magnitude (w1mpro) in Figure 7. The radial position separations are plotted as a function of W1 brightness in Figure 8. Position residuals increase for sources brighter than w1mpro<8.0 magnitudes because of the onset of saturation. Residuals increase slowly towards fainter magnitudes as photon noise begins to limit the source extraction accuracy. The number associations between WISE and 2MASS drops off significantly fainter than W1=14.5 mag, leading to the jump in apparent scatter.
 |
| Figure 8 - Mean Radial position differences between the Post-Cryo Single-exposure Source Database and the 2MASS PSC, plotted as a function of W1 source magnitude. |
The mean X and Y Post-Cryo Single-exposure Source Database - 2MASS PSC position differences are plotted as a function of time during the Post-Cryo survey phase in Figure 9. The mean cross-scan (X) residual increase most rapidly at the beginning of the Post-Cryo phase, while the mean in-scan (Y) residuals increase steadily throughout the full period. Even so, the maximum deviations on each axis reach only about 15 mas.
To evaluate the possible impact of errors in the non-linear portion of the time-dependent distortion model fits, the NEOWISE-2MASS associated sources were binned into a 31x31 grid based where the reconstructed WISE positions mapped into the W1 focal plane. Mean X and Y position errors were computed in each bin and then the mean errors over the entire focal plane were subtracted from each bin value. The resulting vector lengths for each bin was then averaged over the focal plane to give a measure of how much non-linear distortion remains. Note that if distortion model were able to perfectly account for all non-linear effects the vector lengths would be zero.
The mean vector length is plotted as a function of time in Figure 10. Initially, the non-linear residuals start out at approximately 35 mas, and then jumps abruptly to approximately 45 mas after MJD=55500. This jump corresponds to the time when the WISE spacecraft reaction wheel friction coefficients were updated. There are also a larger short term variations after that point. Even with the increase, the impact of these residuals are small when combined in quadrature with other error contributions. Overall the time-dependent distortion fit performed very well.


