


The calibration of NEOWISE photometry was tied to the AllWISE Source Catalog rather than the sparse network of standard calibration stars used during the WISE primary mission. NEOWISE source fluxes were measured in instrumental units (DN) and converted to calibrated magnitudes by adding a band-dependent instrumental zero point (ZP) in the same way that was done during the primary mission (see IV.4.h.iii in the WISE All-Sky Release Explanatory Supplement). The NEOWISE photometric ZPs were computed such that the average magnitudes of bright point sources would agree with those in the AllWISE Catalog, as described below.
As with the previous WISE data releases, the magnitudes reported in the NEOWISE Source Database are in the Vega system, and represent total in-band brightness. Conversion of NEOWISE magnitudes to flux-densities, AB magnitudes, and color corrections are described in section IV.4.h.i of the WISE All-Sky Release Explanatory Supplement.
The initial photometric ZPs for NEOWISE Reactivation were derived by first calibrating profile-fit photometry of high SNR sources from a selection of 130 test scans acquired during the first 15 days of the survey using an estimated, constant ZP. The average differences between NEOWISE and AllWISE Source Catalog magnitudes for all high SNR sources in each of the test scans were computed, and are shown versus scan number in Figure 1. The rapid decline in the magnitude remainders correlates with the period of rapid cooling of the focal planes at the beginning of the NEOWISE survey, as demonstrated in Figure 2a. Toward the end of test scan period, the photometric remainders stabilized to the levels indicated by the horizontal magenta lines in Figure 1. The estimated ZPs were adjusted by these levels to define the initial survey photometric ZPs.
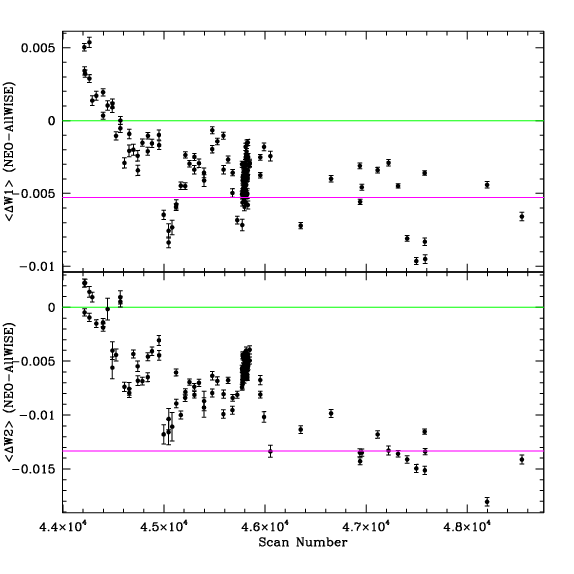 |
| Figure 1 - W1 and W2 average [NEOWISE-AllWISE] ("NEOWISE minus AllWISE") photometry differences per scan shown vs. scan number for ~130 test scans taken at the start of the NEOWISE Reactivation survey. The rapid decline in the average magnitudes correlates with the rapid cooling of the focal planes. The magenta horizontal line marks the adjustment to the photometric zero points once the temperature stabilized. |
After setting the initial ZPs, small adjustments were made a number of times during NEOWISE operations by adding a correction, dZP, that was keyed to time (or scan number):
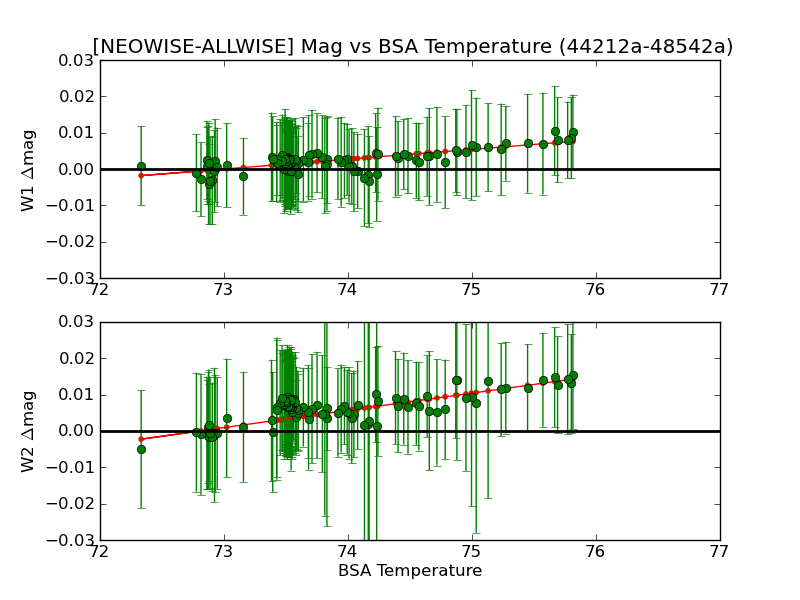
A summary of the W1 and W2 photometric ZPs used during the seven years of the NEOWISE survey is given in Table 1. The ZPs for the scans acquired during the initial rapid cooldown phase were adjusted frequently using the linear fits of the average remainders as a function of temperature shown in Figure 2a. The resulting average [NEOWISE-AllWISE] photometric remainders after the ZP adjustments are shown in Figure 2b. The later ZP adjustments listed in Table 1 were usually made in conjunction with updates in the image calibration products (IV.2.a.i.2).
 |
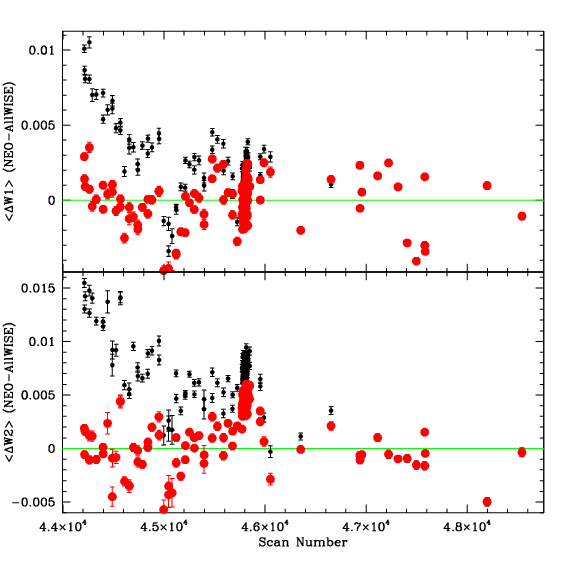 |
| Figure 2a - [NEOWISE-AllWISE] photometric remainders vs. BSA temperature for ~130 test scans. A linear fit algorithm designed to eliminate bias due to clustering was used to characterize the relationship in each band. | Figure 2b - W1 and W2 [NEOWISE-AllWISE] remainders vs. scan for ~130 test scans. Black points represent NEOWISE magnitudes without time-varying zero point adjustment. Red points represent NEOWISE magnitudes with corrected time-varying zero points. |
| Scan Range | Temperature K | W1 ZP | W2 ZP | 44212a - 44284a | 75.7 | 20.7642 | 19.6551 | 44285a - 44349a | 75.5 | 20.7647 | 19.6560 | 44349b - 44413a | 75.3 | 20.7653 | 19.6570 | 44414a - 44489b | 75.1 | 20.7658 | 19.6579 | 44490a - 44601a | 74.9 | 20.7663 | 19.6589 | 44601b - 44714a | 74.7 | 20.7669 | 19.6598 | 44716a - 44870b | 74.5 | 20.7674 | 19.6608 | 44872a - 45018a | 74.3 | 20.7680 | 19.6617 | 45020a - 45210a | 74.1 | 20.7685 | 19.6627 | 45212a - 45449b | 73.9 | 20.7691 | 19.6636 | 45450a - 45664a | 73.7 | 20.7696 | 19.6646 | 45665a - 45974a | 73.5 | 20.7701 | 19.6655 | 45976a - 46297b | 73.3 | 20.7707 | 19.6665 | 46298a - 46718a | 73.1 | 20.7715 | 19.6674 | 46720a - 47591a | 72.9 | 20.7715 | 19.6688 | 47977a - 48598a | 72.9 | 20.7715 | 19.6688 | 48600a - 49881a | 72.9 | 20.7715 | 19.6688 | 49881b - 50578a | -- | 20.7715 | 19.6635 | 50580a - 55174a | -- | 20.7597 | 19.6419 | 55174b - 57333a | -- | 20.7570 | 19.6497 | 57333b - 63733b | -- | 20.7603 | 19.6451 | 63734a - 71055b | -- | 20.7621 | 19.6412 | 71056a - 82897b | -- | 20.7621 | 19.6439 | 82898a - 99799a | -- | 20.7609 | 19.6435 | 01000r - 23446r | -- | 20.7609 | 19.6435 | 23447r - 34601r | -- | 20.7609 | 19.6435 | 34601s - 45803r | -- | 20.7609 | 19.6435 | 45804r - 57041r | -- | 20.7609 | 19.6435 | 57042r - 64272r | -- | 20.7609 | 19.6435 |
|---|
The stability of the W1 and W2 photometric calibration throughout the NEOWISE survey is illustrated in Figure 3, which shows the (10%) trimmed mean [NEOWISE-AllWISE] photometric remainders for all high SNR sources (with w[1,2]mpro between 8 and 10 mag) in each scan shown as a function of time. The sense of this diagram is that larger remainder values indicate lower sensitivity or system throughput. The vertical red lines in Figure 3 denote times at which adjustments were made to the photometric ZPs. The adjustment that was made on MJD=57000 (scan 55174b) is now known to have been slightly incorrect. As a result, the W2 remainders in the interval 57000<MJD<57071 (scans 55174b to 57333a) are offset from the regular seasonal variations.
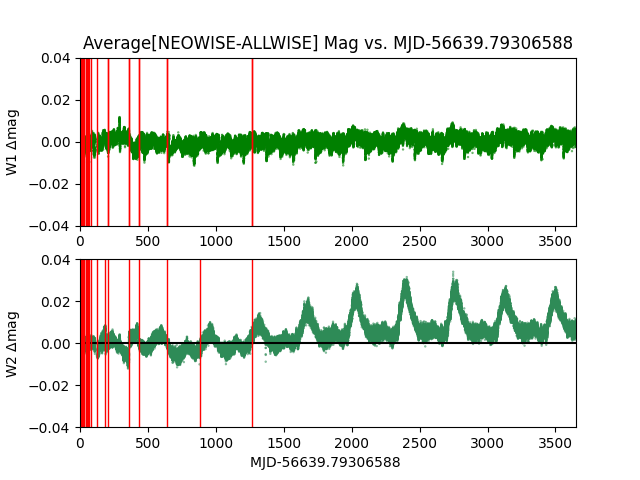 |
| Figure 3 - W1 and W2 average [NEOWISE-AllWISE] photometric remainders shown as a function of time (MJD). The red vertical lines indicate times when adjustments were made to the photometric ZPs points. The data behind this figure can be found in Table 2 (.tbl file, 14.6 MB). |
The W1 calibration was very stable over the full survey, with an overall RMS remainder of 0.0026 mags. Throughout much of the survey there was generally a small (<0.01 mag) systematic increase in the remainders (and corresponding decrease in W1 throughput) that was correlated with focal plane temperature, as can be seen in Figure 4. The periodic negative "spikes" that appear every six months in the W1 remainder trend are related to a spatially fixed bias in AllWISE W1 photometry, and not the NEOWISE photometry.
The W2 remainders shown in Figure 3 exhibit both a systemic rise of ~0.01 mag over the duration of the survey, and a significant seasonal variation that rose generally to ~0.034 mag later in the survey. The seasonal variations tracked the behavior of the focal plane (BSA) temperatures that are shown in Figure 11 of I.2.c.iii. As the temperatures rose around the summer and to lesser extent winter solstices, the [NEOWISE-AllWISE] remainders increased, indicating that the W2 throughput decreased with increasing temperature. The overall RMS of the W2 remainders were generally 0.0061 mag, but throughout much of the survey the measured flux value for a given object can vary by up to 0.025 mags, depending on precisely when the observations took place.
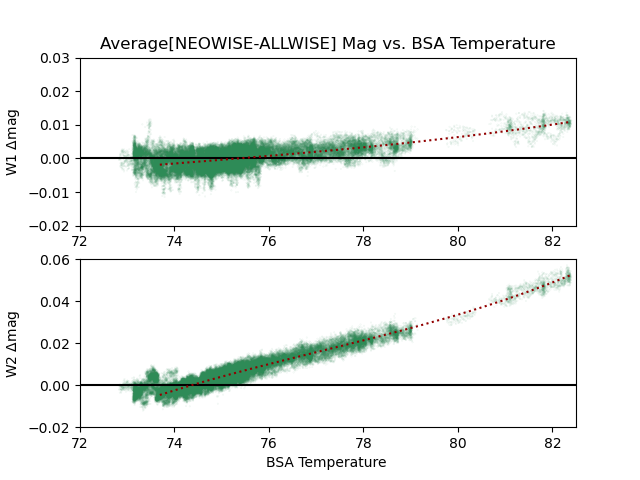
The average [NEOWISE-AllWISE] photometric remainders in each scan are shown as a function of focal plane temperature in Figure 4a. With the exception of the lowest temperatures that occurred at the very start of the survey, the average remainders increase with temperature, which is particularly apparent for W2. Hence, the NEOWISE system sensitivity decreased with increasing temperature. The slightly discrepant W2 points near 73.5 K correspond to the period, 57000<MJD<57071, when the incorrect ZP adjustment was in place. Over most of the survey, though, the sensitivity variations are likely small relative to the photometric uncertainties of the individual single-exposure measurements for the great majority of sources (c.f. II.1.c.iii).
Notably, after approximately MJD 60452 (scan 62041r, near the end of the survey) the BSA temperatures rose dramatically, resulting in maximum remainders of ~0.012 mag in W1 and ~0.056 mag in W2, before falling again just before the survey end. In fact, this was the greatest departure in W1 and more clearly demonstrated the dependence of the throughput on temperature in that band.
Users are encouraged to use the data in Table 2 (.tbl file, 14.6 MB), which provides all of the [NEOWISE-AllWISE] remainders as a function of time and scan, to correct the photometry of sources of interest to better align with the calibration based on AllWISE. Since the NEOWISE photometry became fainter, relative to the AllWISE photometry, as a result of the decrease in sensitivity, users should subtract the remainder corresponding to the scan or MJD for a given band at which the source photometry was obtained (or, if necessary, interpolate the remainder value between scans or MJD), in order to correct it to the AllWISE calibration.
Alternatively, the W1 and W2 remainders were fit as a function of temperature, over the range of 73.69 to 82.4 K, with a third-order polynomial model in each band. The fits have the following parameters:
W1: c0 = -1.7644715813507346, c1 = 0.06994326742770161, c2 = -0.0009394258083488513, c3 = 4.272789479376937e-06;
W2: c0 = -21.108408980078018, c1 = 0.810468417671699, c2 = -0.01043529965667324, c3 = 4.5098480923935096e-05.
The residuals of these fits are shown in Figure 4b. Users can instead
use these fits to obtain the photometric corrections from the BSA temperature at the time
or scan of the observations of sources of interest. The rms in these residuals are approximately
0.002 mag in either band, such that the additional uncertainties in the fluxes of sources of
interest will likely be no larger than about 0.2% in both W1 and W2.
 |
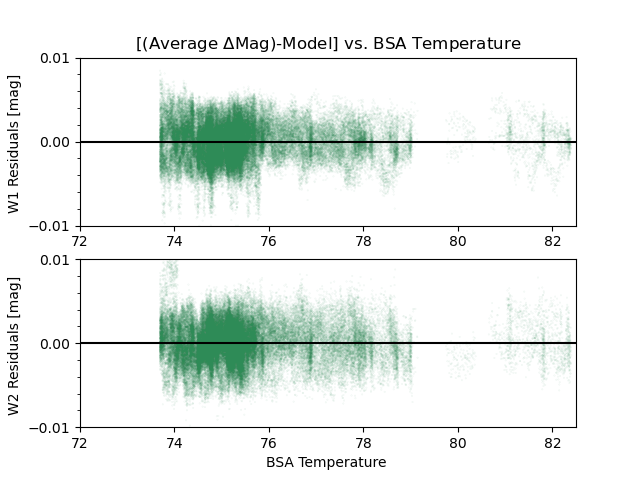 |
| Figure 4a - W1 and W2 average [NEOWISE-AllWISE] photometric remainders shown as a function of focal plane (BSA) temperature. Also shown as the red dotted curves are third-order polynomial model fits to these data over the temperature range 73.69 to 82.4 K; see text. | Figure 4b - W1 and W2 residuals resulting from the subtraction of the average [NEOWISE-AllWISE] photometric remainders by the model fits, shown as a function of the fitted range of focal plane (BSA) temperature; see text. |
| The data behind this figure below can be found in Table 2 (.tbl file, 14.6 MB). | |
Last update: 5 November 2024