


II. NEOWISE Single-exposure Source Database
II.1. General Properties
II.1.c. Photometric Information
II.1.c.i Different Photometric Measurements in the Source Database
Several different sets of photometric measurements in the two NEOWISE bands
are provided for each detection in the NEOWISE Single-exposure Source Database.
Magnitudes and magnitude uncertainties from each of these measurements
are provided, along with other information specific to the type of
photometry. All magnitudes are given in the Vega system. A brief description
of the different photometry algorithms, their associated parameters, and when
each is appropriate are listed below.
Note that for all types of photometry, if the flux measurement
has SNR<2 the magnitude quoted is derived from the 95% confidence flux
upper limit, and the magnitude uncertainty will be null.
- Profile-fit Photometry -
(w?mpro,
w?sigmpro,
w?snr,
w?flux,
w?sigflux)
These measurements are the PSF profile-fit measurements that are made by
chi-squared minimization
on the W1 and W2 Single-exposure images.
The instrumental flux measurements and uncertainties,
w?flux
and w?sigflux,
given in DN for the profile-fit measurements are always
the measured values, and w?flux is not a 95% confidence upper limit. Most detections in the NEOWISE Source Database are unresolved, so
the profile-fit measurements are generally the best to use.
They provide the highest SNR flux measurements
for faint sources, and objects that may be in close proximity
to other sources, and the profile-fitting is most robust to the presence
of masked pixels in the measurement area. Profile-fit photometry may
underestimate the brightness of extended sources, and may overestimate the brightness of saturated sources.
- "Standard" Aperture Photometry -
(w?mag,
w?sigm,
w?flg,
w?mcor)
The standard aperture magnitudes are curve-of-growth corrected
magnitudes derived from flux measurements made on the Single-exposure Images. The fluxes are measured at the position of the profile-fit extraction in 8.25" radius circular apertures. The curve-of-growth correction, given in the w?mcor parameter,
is appropriate for unresolved objects, so these are not good magnitudes for extended sources. Aperture photometry is susceptible to contamination from nearby objects and masked pixels, and greatly underestimates the brightness of saturated sources. The w?flg values indicate if the aperture measurements are contaminated in any bands.
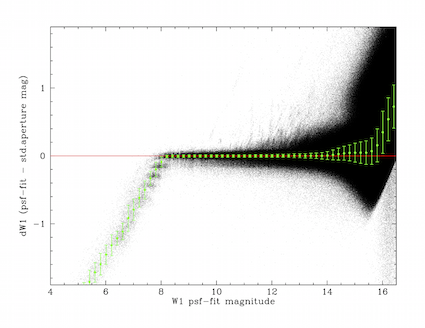
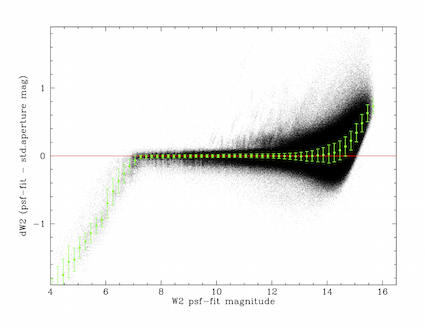
The differences between W1 and W2 profile-fit and standard aperture magnitudes are shown as a function of profile-fit magnitude in Figures 1 and 2. Residuals between profile-fit and standard aperture photometry are <1% in the ranges 8.0<W1<14.0 mag and 7.0<W2<13.7 mag. The aperture photometry dramatically underestimates fluxes brighter than the saturation limits in each band.
While the mean differences between profile-fit and standard aperture magnitudes are small, there are variations in the offset over time, as illustrated in Figure 3. There were discreet jumps in the mean differences during the first third of the mission when instrumental calibration products were updated. In the W1 band, a systematic decrease in the mean differences occurred during the first half of the survey. The offset stabilized or slowed to about 0.003 mag in later years. This trend may be related to very small variations in the W1 PSF as temperatures increased. Both bands exhibit periodic seasonal variations, but with different phases. The ~0.001 mag variations seen in W1 over six-month intervals are correlated with periods during which the survey scan path spent more time sampling higher source density regions close to the Galactic plane. During these periods, aperture photometry is susceptible to contamination by neighboring sources that overlap the measurement apertures leading to a systematic overestimation of the flux of a source. The strongest peaks in the W2 variations occur in 12-month intervals that correspond to the large peaks in the focal plane temperature variations that follow each summer solstice. The lower amplitude peaks correspond to the lesser focal plane temperature peaks that follow the winter solstice. The significant rise in the W2 profile-fit vs. aperture photometry differences during the final months of the survey correspond to the increase heat-up of the instrument during that time.
- Multi-Aperture Photometry - (w?mag_n, w?sigm_n, w?flg_n, where
n=1,2,3,4,5,6,7,8)
These magnitudes are derived from flux measurements made on the Single-exposure Images in a series of n=1,2,3,4,5,6,7,8 apertures with radii = 5.5", 8.25", 11.0", 13.75", 16.5", 19.25", 22.0" and 24.75", respectively. These magnitudes are not curve-of-growth corrected, so are useful measurements for extended sources smaller than the aperture sizes. However, aperture photometry is susceptible to contamination from nearby objects and does not compensate for saturated or masked pixels in the images. The w?flg_n values indicate if the raw aperture measurements are contaminated in any band.
 |
 |
| Figure 1 - W1 |
Figure 2 - W2 |
| Differences between NEOWISE Single-exposure Source Database profile-fit and standard aperture magnitudes as a function of profile-fit magnitude, for good-quality detections within 5° of the north Galactic pole. Black points represent measurements on individual Single-exposures. Green points and
error bars are the trimmed average and RMS of the residuals for all detections in 0.2 mag wide bins. |
 |
| Figure 3 - Average difference between profile-fit and standard aperture photometry for high SNR detections in the NEOWISE Single-Exposures plotted as a function of relative scan number during the Reactivations mission. Black points are the trimmed average differences per scan. The cyan line represents the trimmed average differences in bins of 30 scans. The vertical lines indicate the time at which instrumental calibrations were updated early in the Reactivation mission. The data behind the cyan curves in this figure are available in Table 1 (.tbl file, 214KB). |
II.1.c.ii Comparison to AllWISE
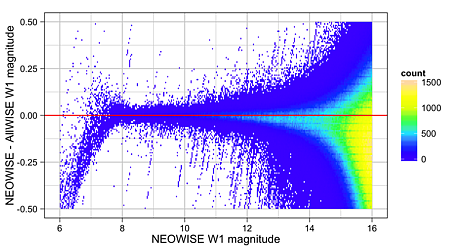
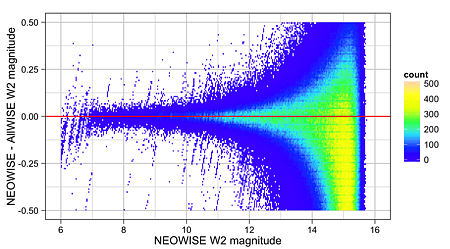
NEOWISE Single-exposure W1 and W2 profile-fit photometry is compared with that in the AllWISE Source Catalog in Figures 3 and 4. These figures show the differences between the NEOWISE Source Database and AllWISE Catalog profile-fit W1 and W2 measurements of the same sources within 5° of the north Galactic Pole, plotted as
a function of NEOWISE magnitudes. NEOWISE photometry agrees well with AllWISE for bright, non-saturated sources in the ranges 8<W1<12 mag and 7<W2<12 mag, which is as expected because NEOWISE photometry is calibrated with respect to the AllWISE Source Catalog (see IV.2.d).
NEOWISE measurements systematically overestimate fluxes of sources
that are brighter than the saturation limits of
W1<8 and W2<7 mag. Fluxes of saturated
sources were also overestimated in the photometry from the original
NEOWISE Post-Cryo survey, as described in
VIII.3.e. of the WISE All-Sky Explanatory Supplement. This
bias increases with increasing source brightness. The origin of the
overestimation is uncertain, but may be related to linearity changes
in the wings of very bright sources when payload temperatures rose
following the exhaustion of the WISE cryogens.
The NEOWISE Single-exposures measurement begins to slightly overestimate
source brightnesses with respect to AllWISE towards
fainter magnitudes. Some overestimation is expected because of
Eddington bias in the less sensitive NEOWISE Single-exposures.
NEOWISE photometry of fainter sources should also trend slightly
brighter than AllWISE photometry because the software error in the
AllWISE processing that suppressed nearby brighter source subtraction
during profile-fitting photometry in the crowded region was corrected
for WSDS v7.5.
 |
 |
| Figure 4 - W1 | Figure 5 - W2 |
| Hess diagrams showing the difference between NEOWISE Source Database and AllWISE Source Catalog W1 and W2 profile-fit photometry plotted as a function of NEOWISE magnitude, for sources within 5° of the north Galactic pole. |
II.1.c.iii. Photometric Sensitivity
The NEOWISE Single-exposure photometric measurements
of point sources in unconfused regions have SNR=10 at W1=15.0 and
W2=13.5 mag.
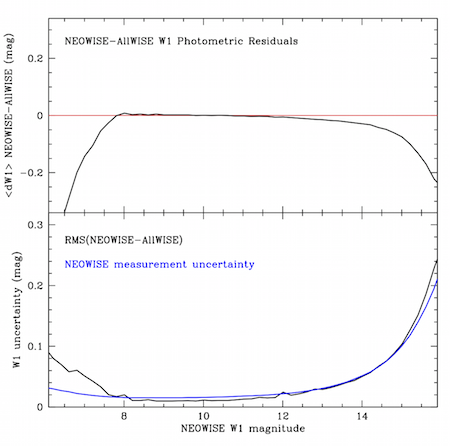
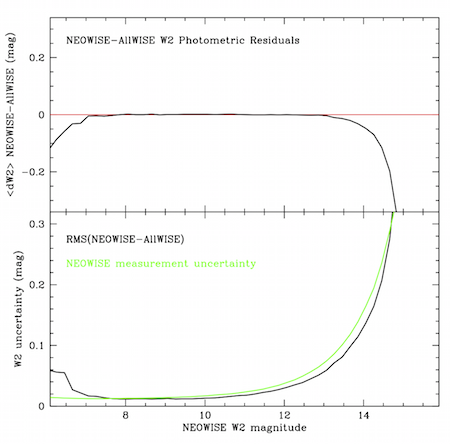
The top panels of Figures 5 and 6 show the trimmed average of the NEOWISE-AllWISE profile-fit photometry residuals shown above in Figures 3 and 4. The RMS of the mean of these residuals provides an estimate of the characteristic NEOWISE photometric sensitivity for unconfused sky. The average RMS of the residuals is shown as a function of NEOWISE magnitude in the bottom panels of Figures 5 and 6. The mean RMS reaches 0.1086 mag (SNR=10) at W1=15.0 and W2=13.5 mag.
The bottom panels of Figures 6 and
7 also show the average NEOWISE profile-fit measurement uncertainties, w?sigmpro, as a function of magnitude. The measurement uncertainties are on average in good agreement with the NEOWISE-AllWISE residual RMS values, indicating that the image and photometry noise models are accurate.
 |
 |
| Figure 6 - W1 | Figure 7 - W2 |
| (top panels) The trimmed average difference between NEOWISE Single-exposure Source Database and AllWISE Source Catalog W1 and W2 profile-fit magnitudes shown in Figures 4 and 5 as a function of NEOWISE magnitude. |
| (bottom panels) Black curves show the average RMS of the NEOWISE-AllWISE residuals as a function of magnitude for W1 and W2. Blue/green curves show the average NEOWISE Source Database measurement uncertainties that are in good agreement with the NEOWISE-AllWISE RMS values.
|
II.1.c.iv. Saturated Source Photometry
Figure 8 shows the differential counts of NEOWISE Source Database bright W1 (top) and W2 (bottom) detections as a function of profile-fit magnitude (w?mpro). The black curves represent all detections, the green curves are the detections that are not flagged as saturated (w?sat=0), and the red curves are detections that have one or more pixels that saturated during the 7.7 sec exposures (w?sat>0).
The characteristic transition from non-saturated to saturated detections occurs near W1=8.0 mag and W2=7.0 mags, the same brightnesses at which saturation occurred during the original WISE cryogenic survey. The saturation transition is not perfectly sharp because pixel responsivities vary around the focal planes (c.f. IV.2.a.viii), and where a bright source falls with respect to pixel boundaries will affect whether or not it saturates the detection. A small number of fainter detections have small, but non-zero w?sat values because the saturation accounting covers a conservatively large area, and can be influenced by nearby bright sources.
CAUTION - As described in I.2.a.ii, pixel saturation encoding was inadvertently disabled for an ~8.2 day period between
13 July and 24 July 2024 (scans 63694r-64017s). During that time, sources brighter than the
nominal saturation thresholds will not be properly denoted with the w?sat values, and their fluxes may not be properly measured.
The NEOWISE Single-exposure Source Database does not contain useful information for sources brighter than W1<2 and W2<0 mag.
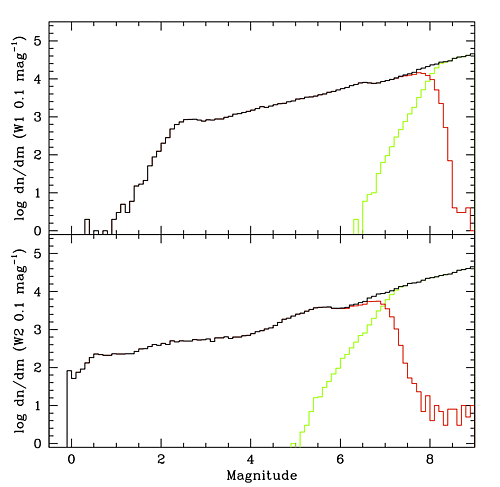 |
| Figure 8 - Differential counts of NEOWISE Source Database bright W1 (top) and W2 (bottom) detections as a function of profile-fit magnitude. The black curves indicate the total differential counts in 0.1 mag-wide bins. The red curves represent detections that are flagged as having some degree of saturation, and the green curves are non-saturated detections. |
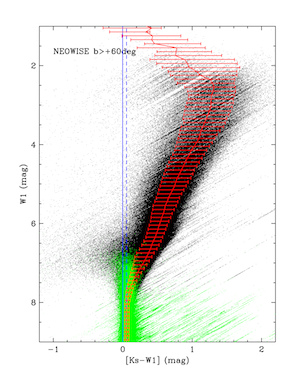
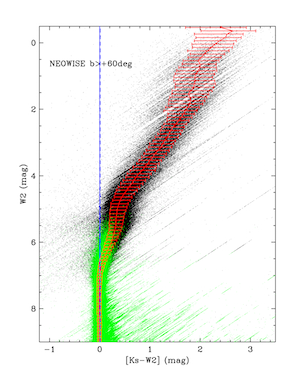
The flux of saturated sources is estimated during data processing by fitting a PSF template to the unsaturated pixels surrounding the saturated core of the source. As was the case for the original NEOWISE Post-Cryo survey, though, this process systematically overestimates the fluxes of saturated stars in the NEOWISE Source Database. This is illustrated in Figures 9 and 10, which show Ks-W1 and Ks-W2 color-magnitude diagrams for very bright sources in the NEOWISE Source Database with 2MASS Point Source Catalog associations. Most stars have Ks-W1 and Ks-W2 colors near zero. The mean colors begin to deviate to the red starting at W1<8.0 and W2<7.0 mag, the characteristic saturation levels. The bias increases significantly with increasing source flux, exceeding ~1 mag near 4th mag in both bands.
The CMDs in Figures 9 and 10 can be used to estimate empirical corrections for the NEOWISE saturated source photometry biases. These corrections are presented in the next section.
 |
 |
| Figure 9 - Ks-W1 color-magnitude diagram |
Figure 10 - Ks-W2 color-magnitude diagram |
| WISE-2MASS color-magnitude diagrams for bright detections using photometry from the NEOWISE Source Database and 2MASS PSC associations. Green points represent photometry of non-saturated sources, and black points are saturated sources. The solid blue vertical lines denote Ks-W1,2=0.0 for reference. The dashed blue vertical lines indicate the median color for the bright non-saturated sources (see II.1.c.iv.a). The red points are the median observed colors in 0.1 mag-wide bins of W1 and W2 magnitude. The horizontal error bars show the 16th and 84th percentiles (i.e., encompassing 68%) of the color distributions in each 0.1 mag wide magnitude bin. |
Last Updated: 12 November 2024


