


Photometry is performed for all detections during WISE/NEOWISE data processing by fitting two-dimensional point-spread-function (PSF) templates to the source images. The fitting is normally done over a radius of 1.25 times the FWHM of the PSF. For very bright sources that saturate the detectors, the fitting radius is enlarged to twice the radius of the saturated region, and the template fit is performed on the non-saturated pixels in the wings of the source profiles (c.f. section IV.4.c.iii of the WISE All-Sky Explanatory Supplement).
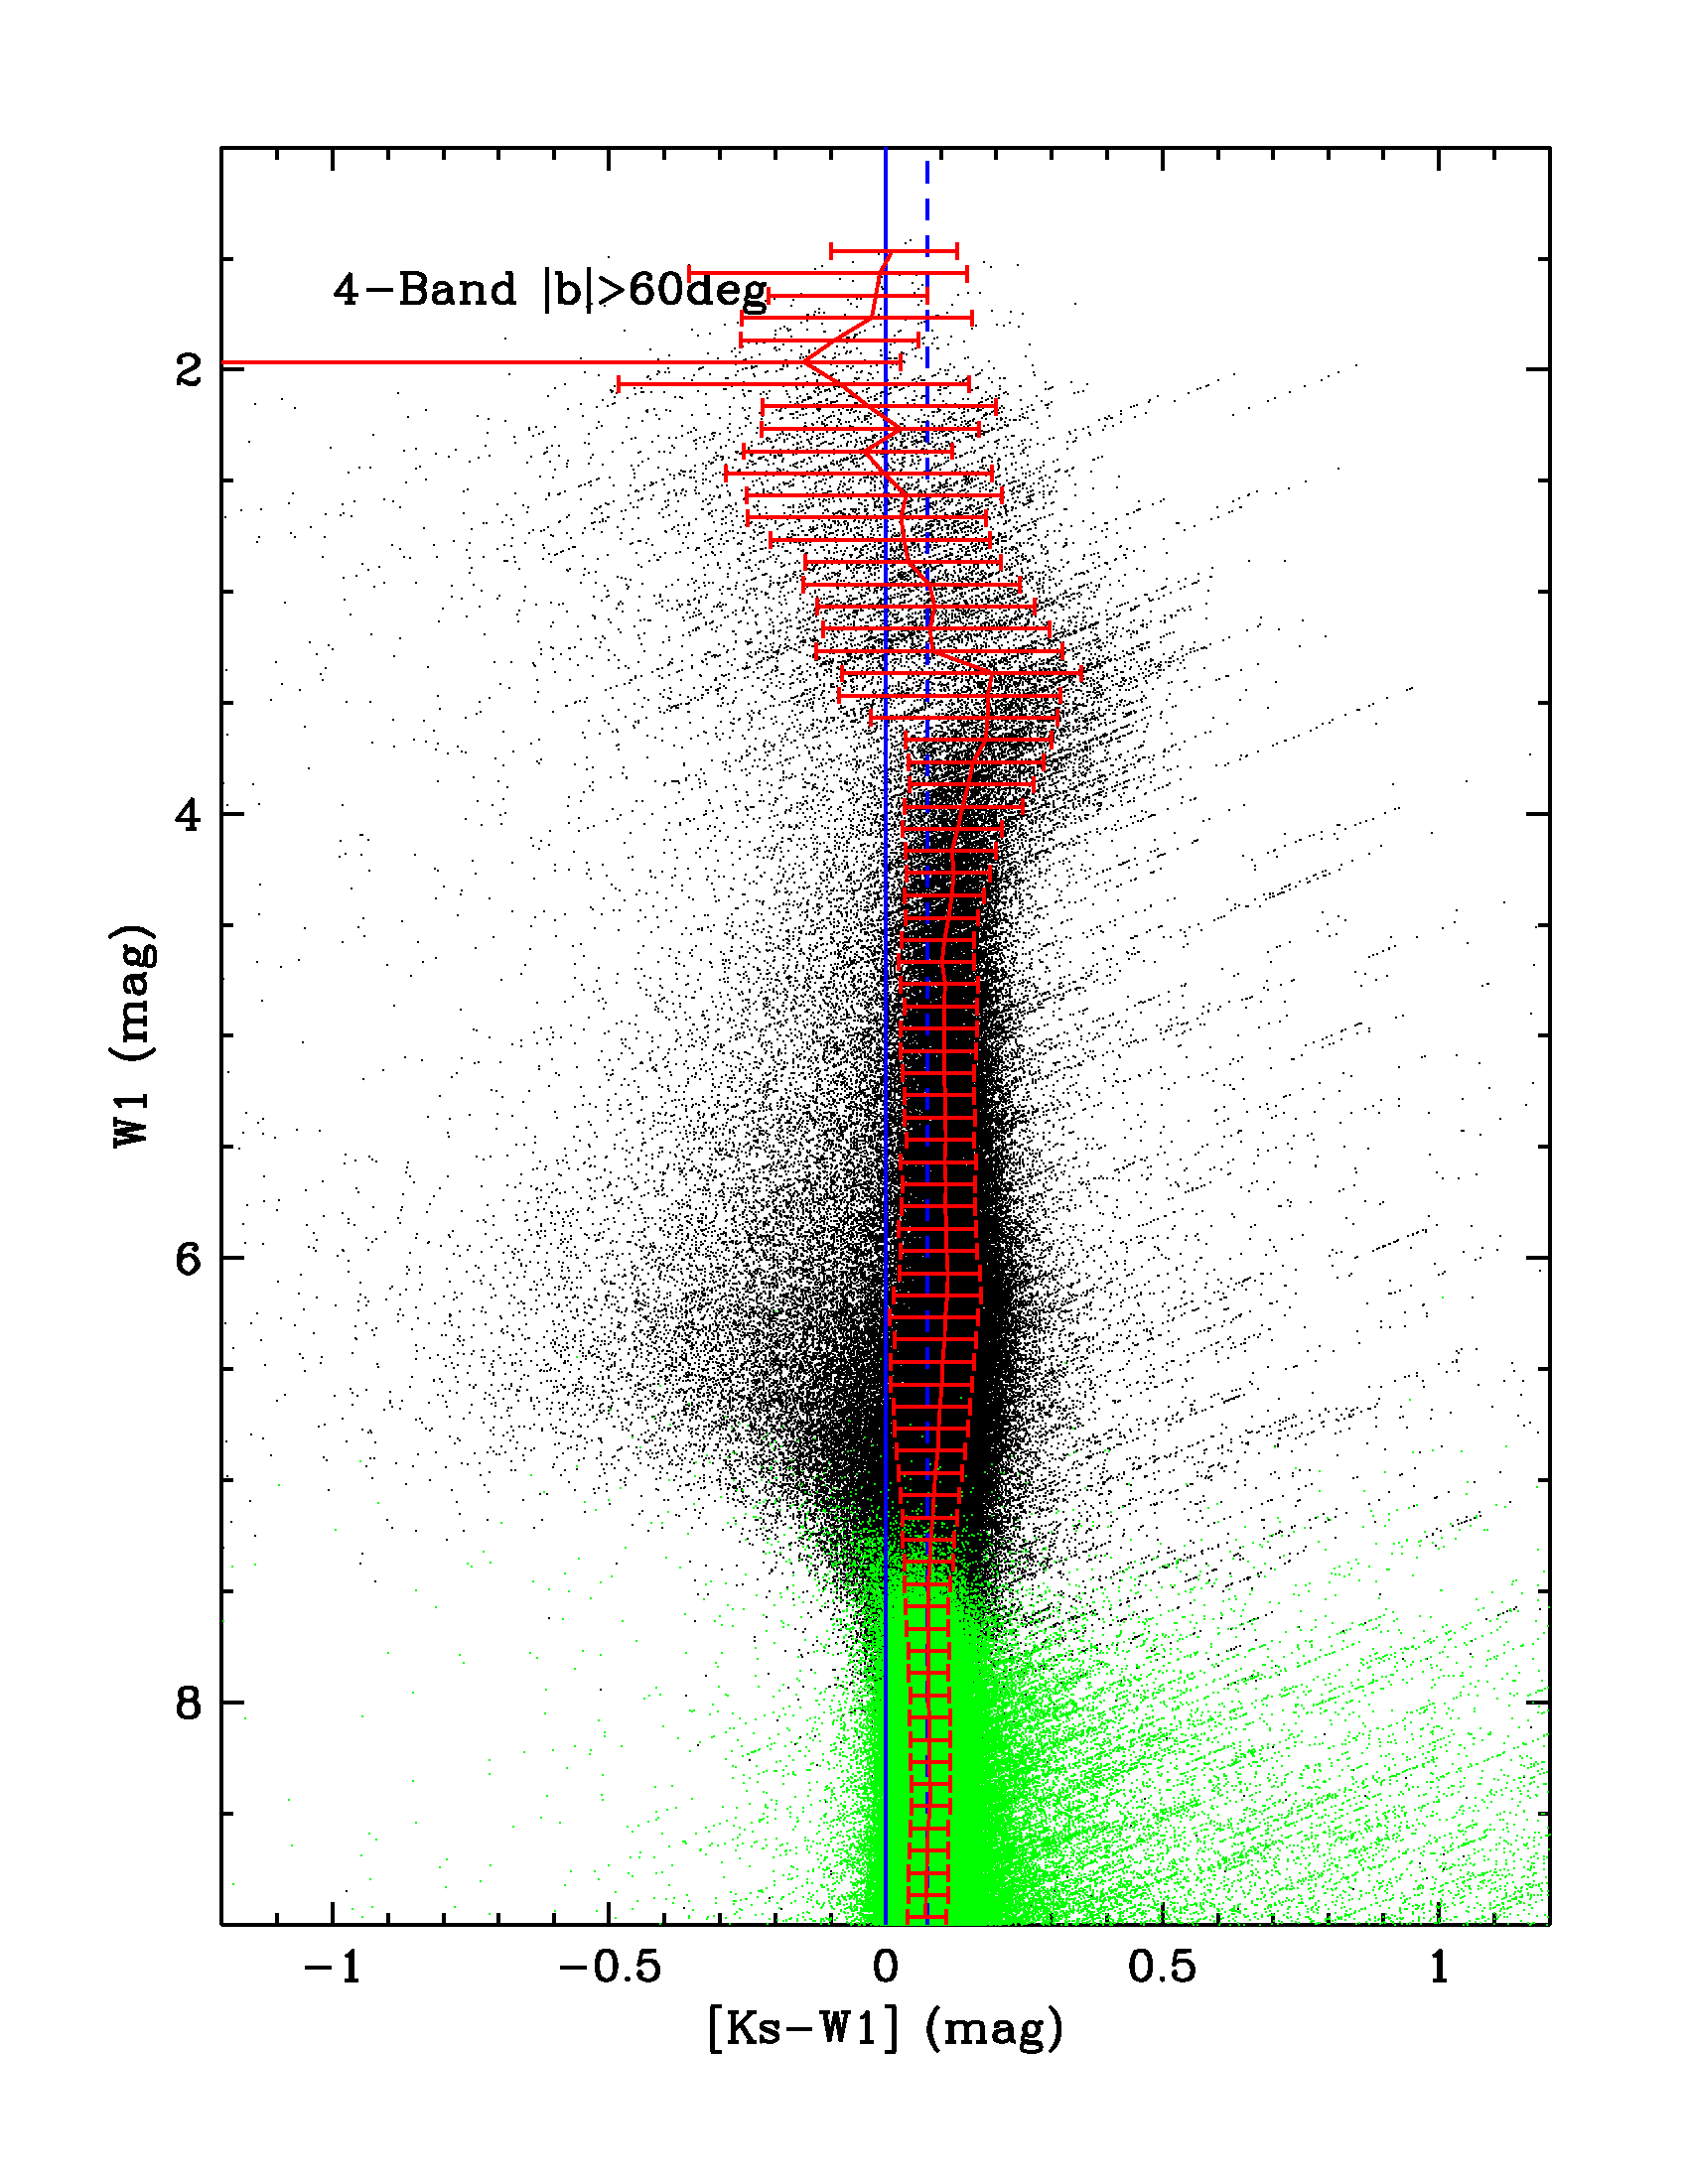
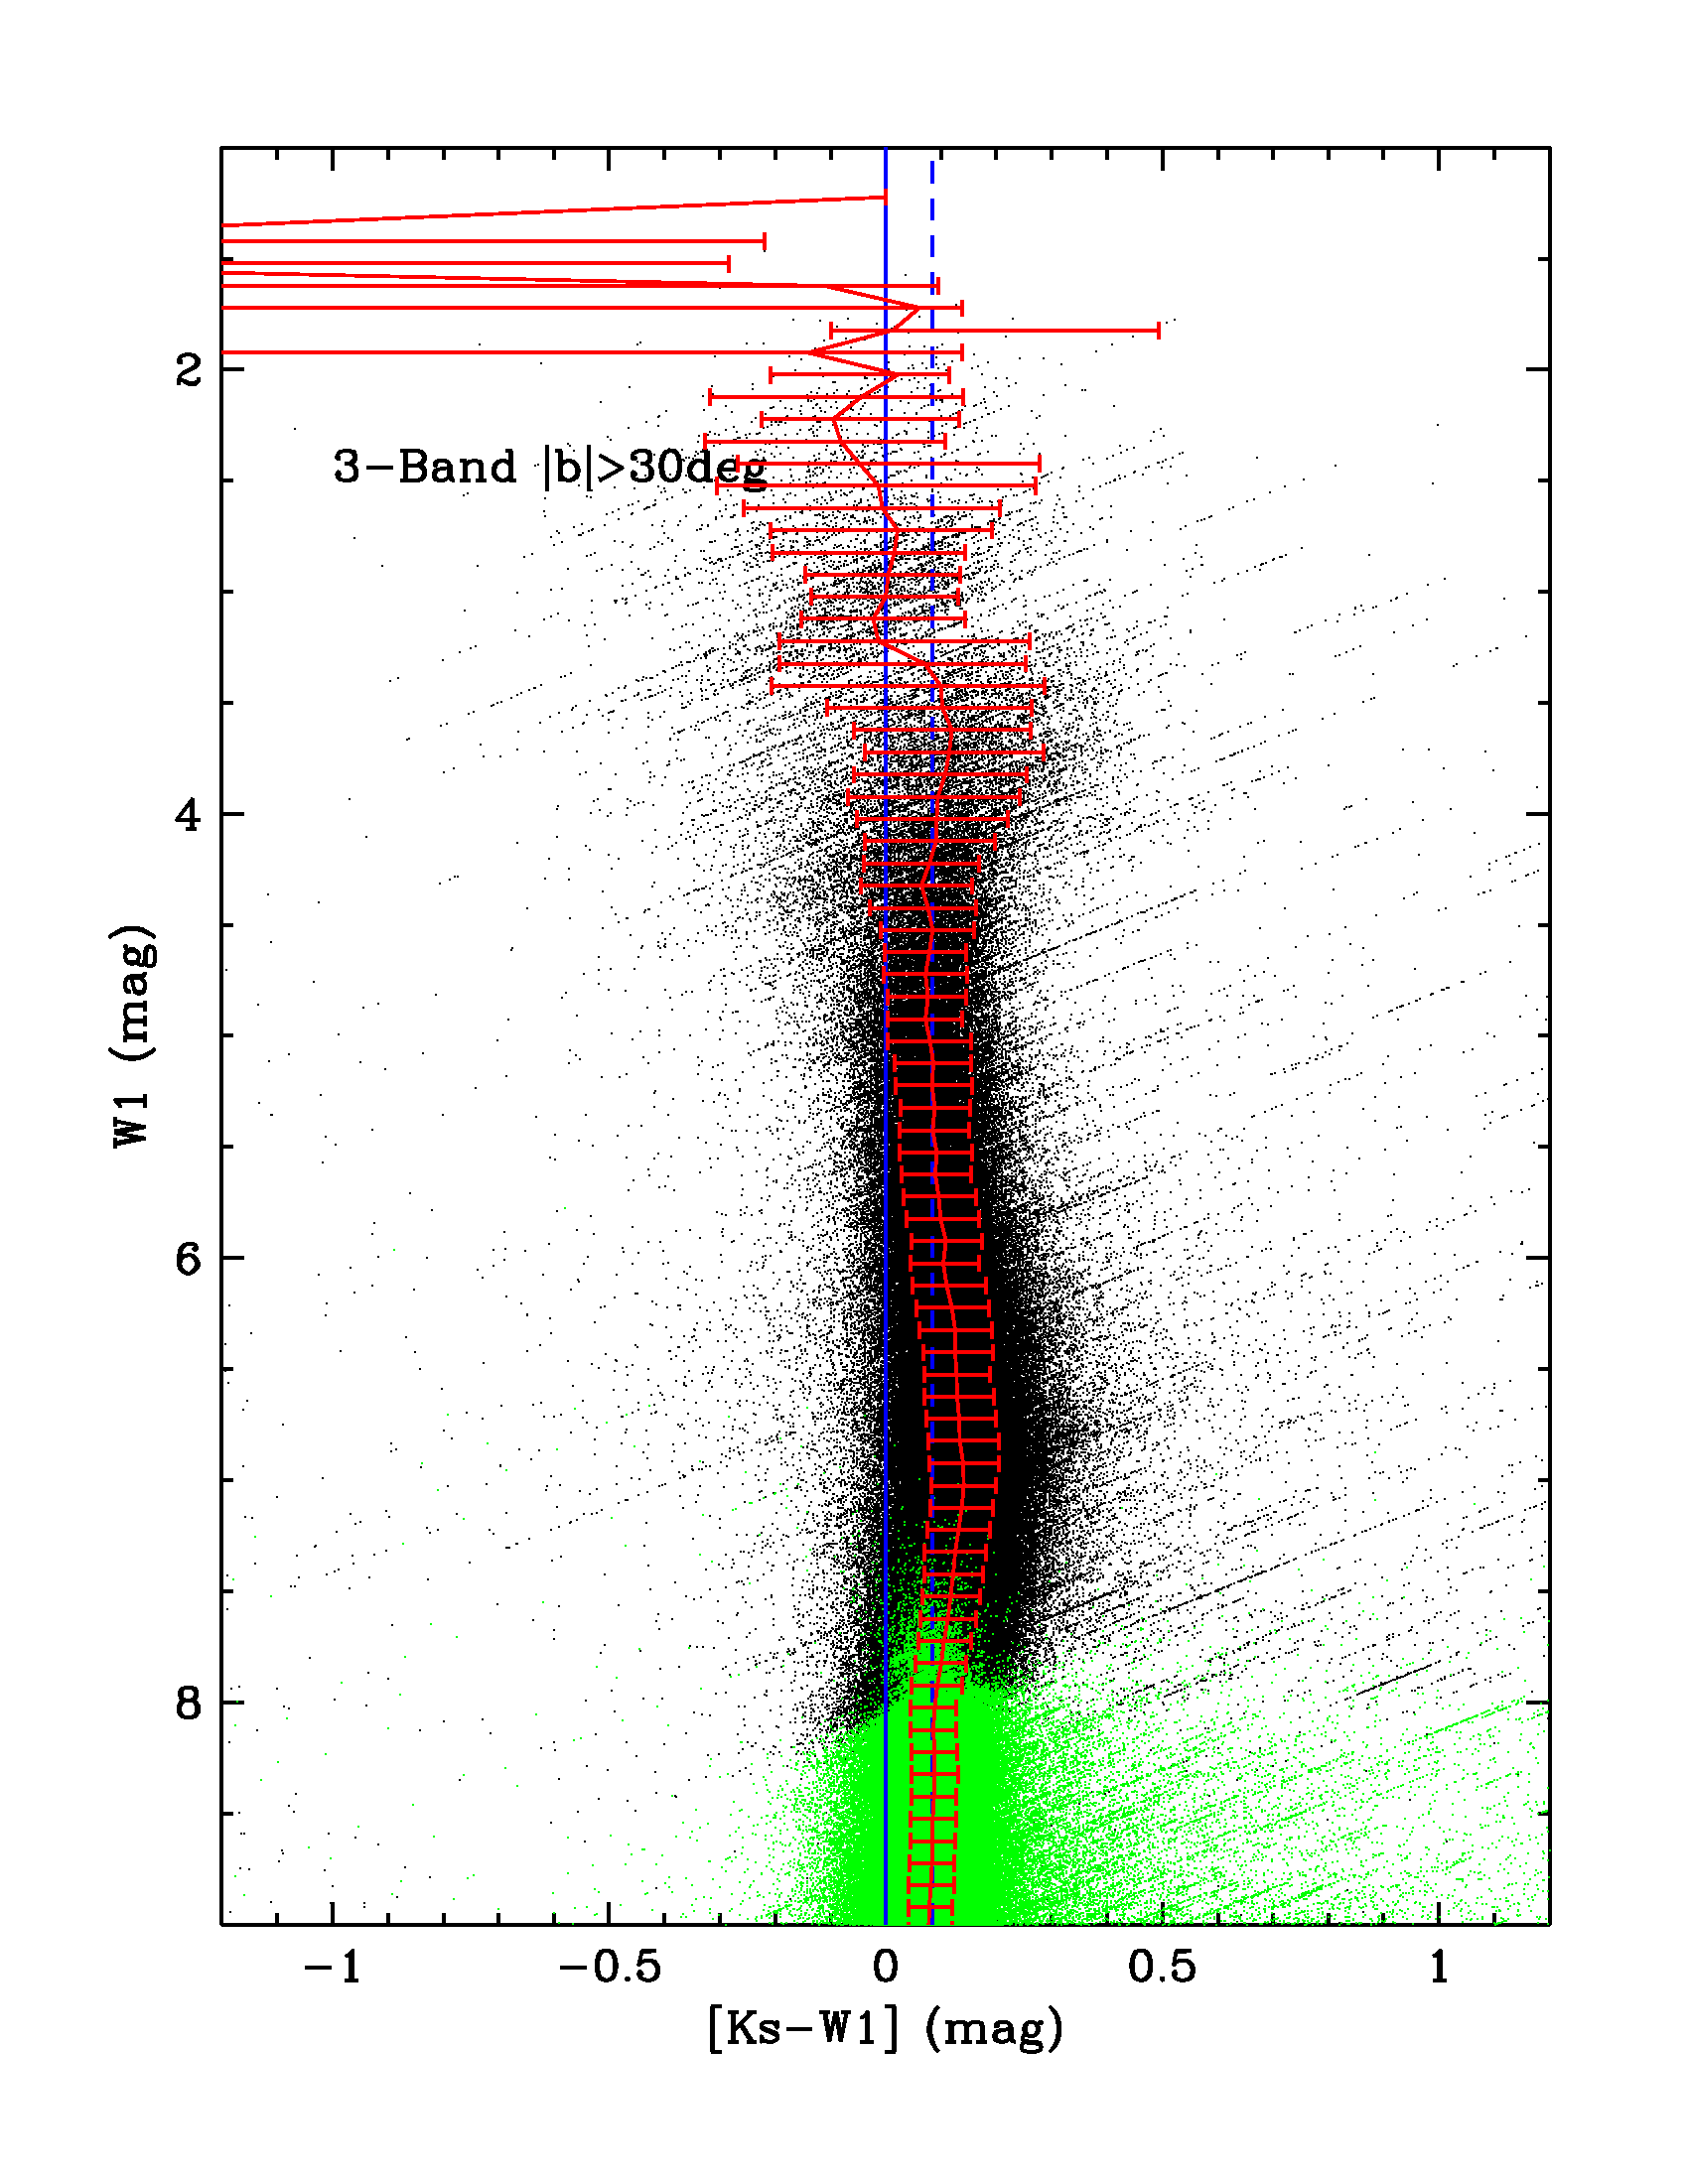
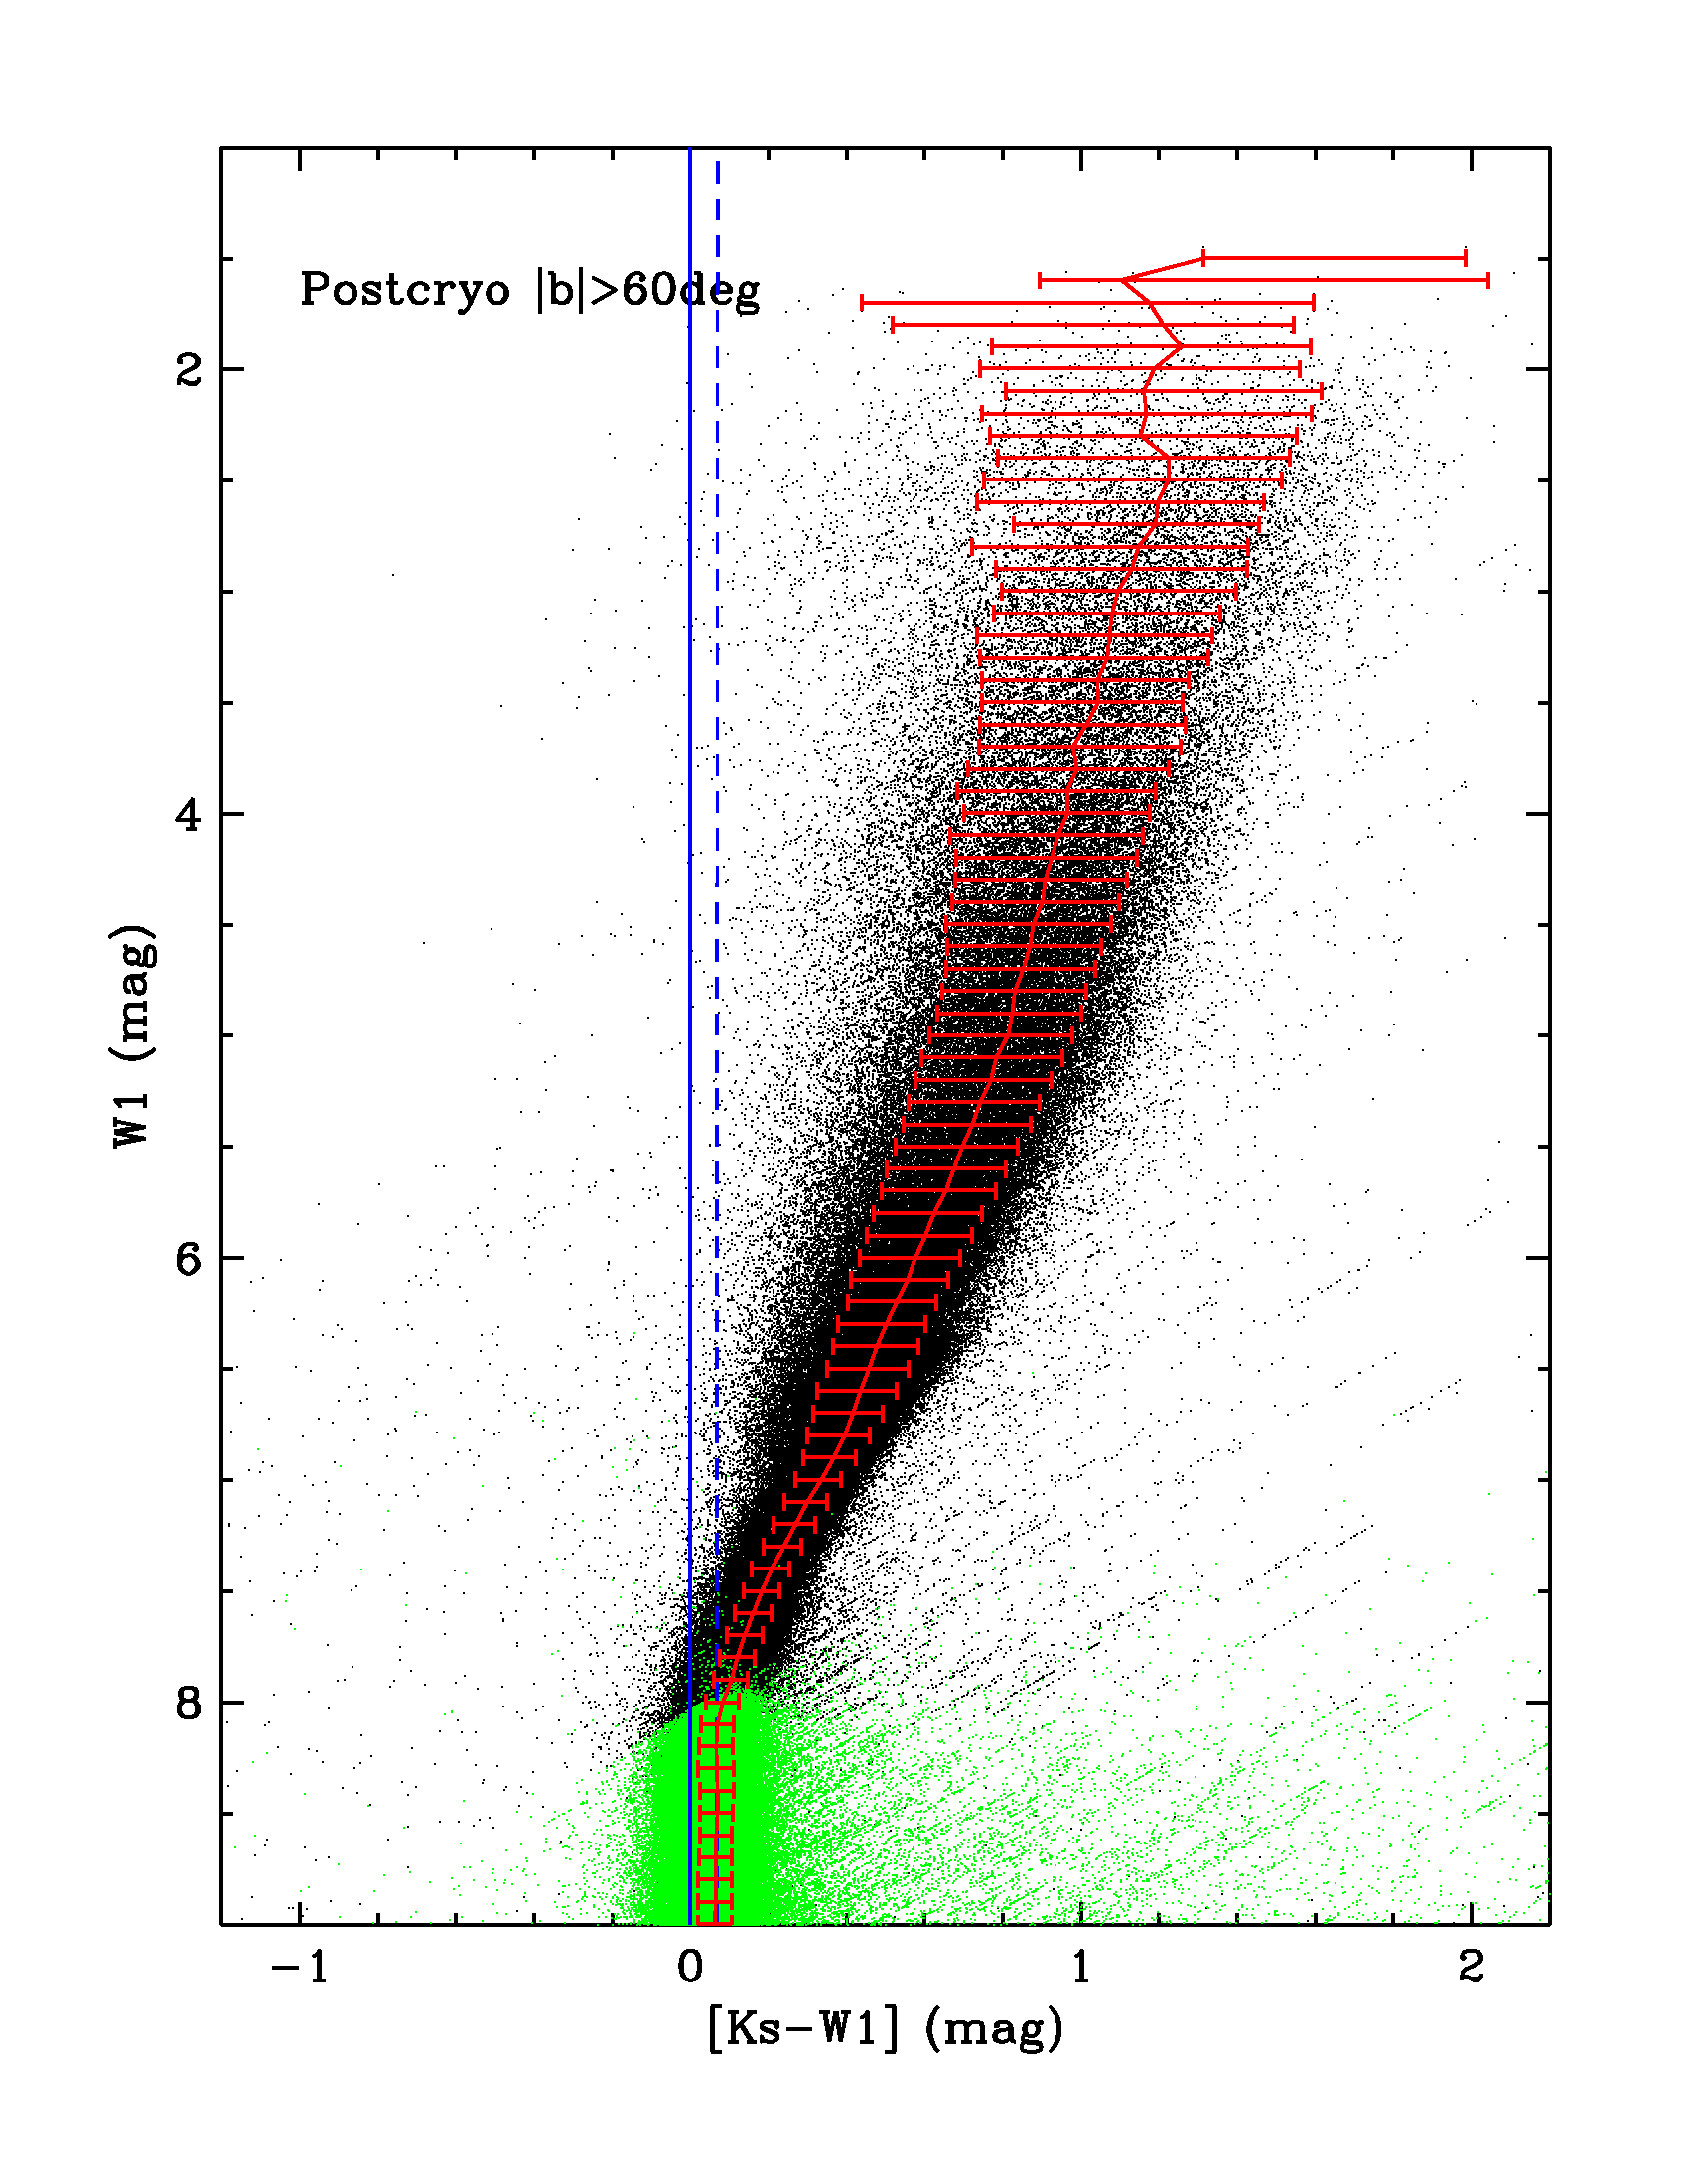
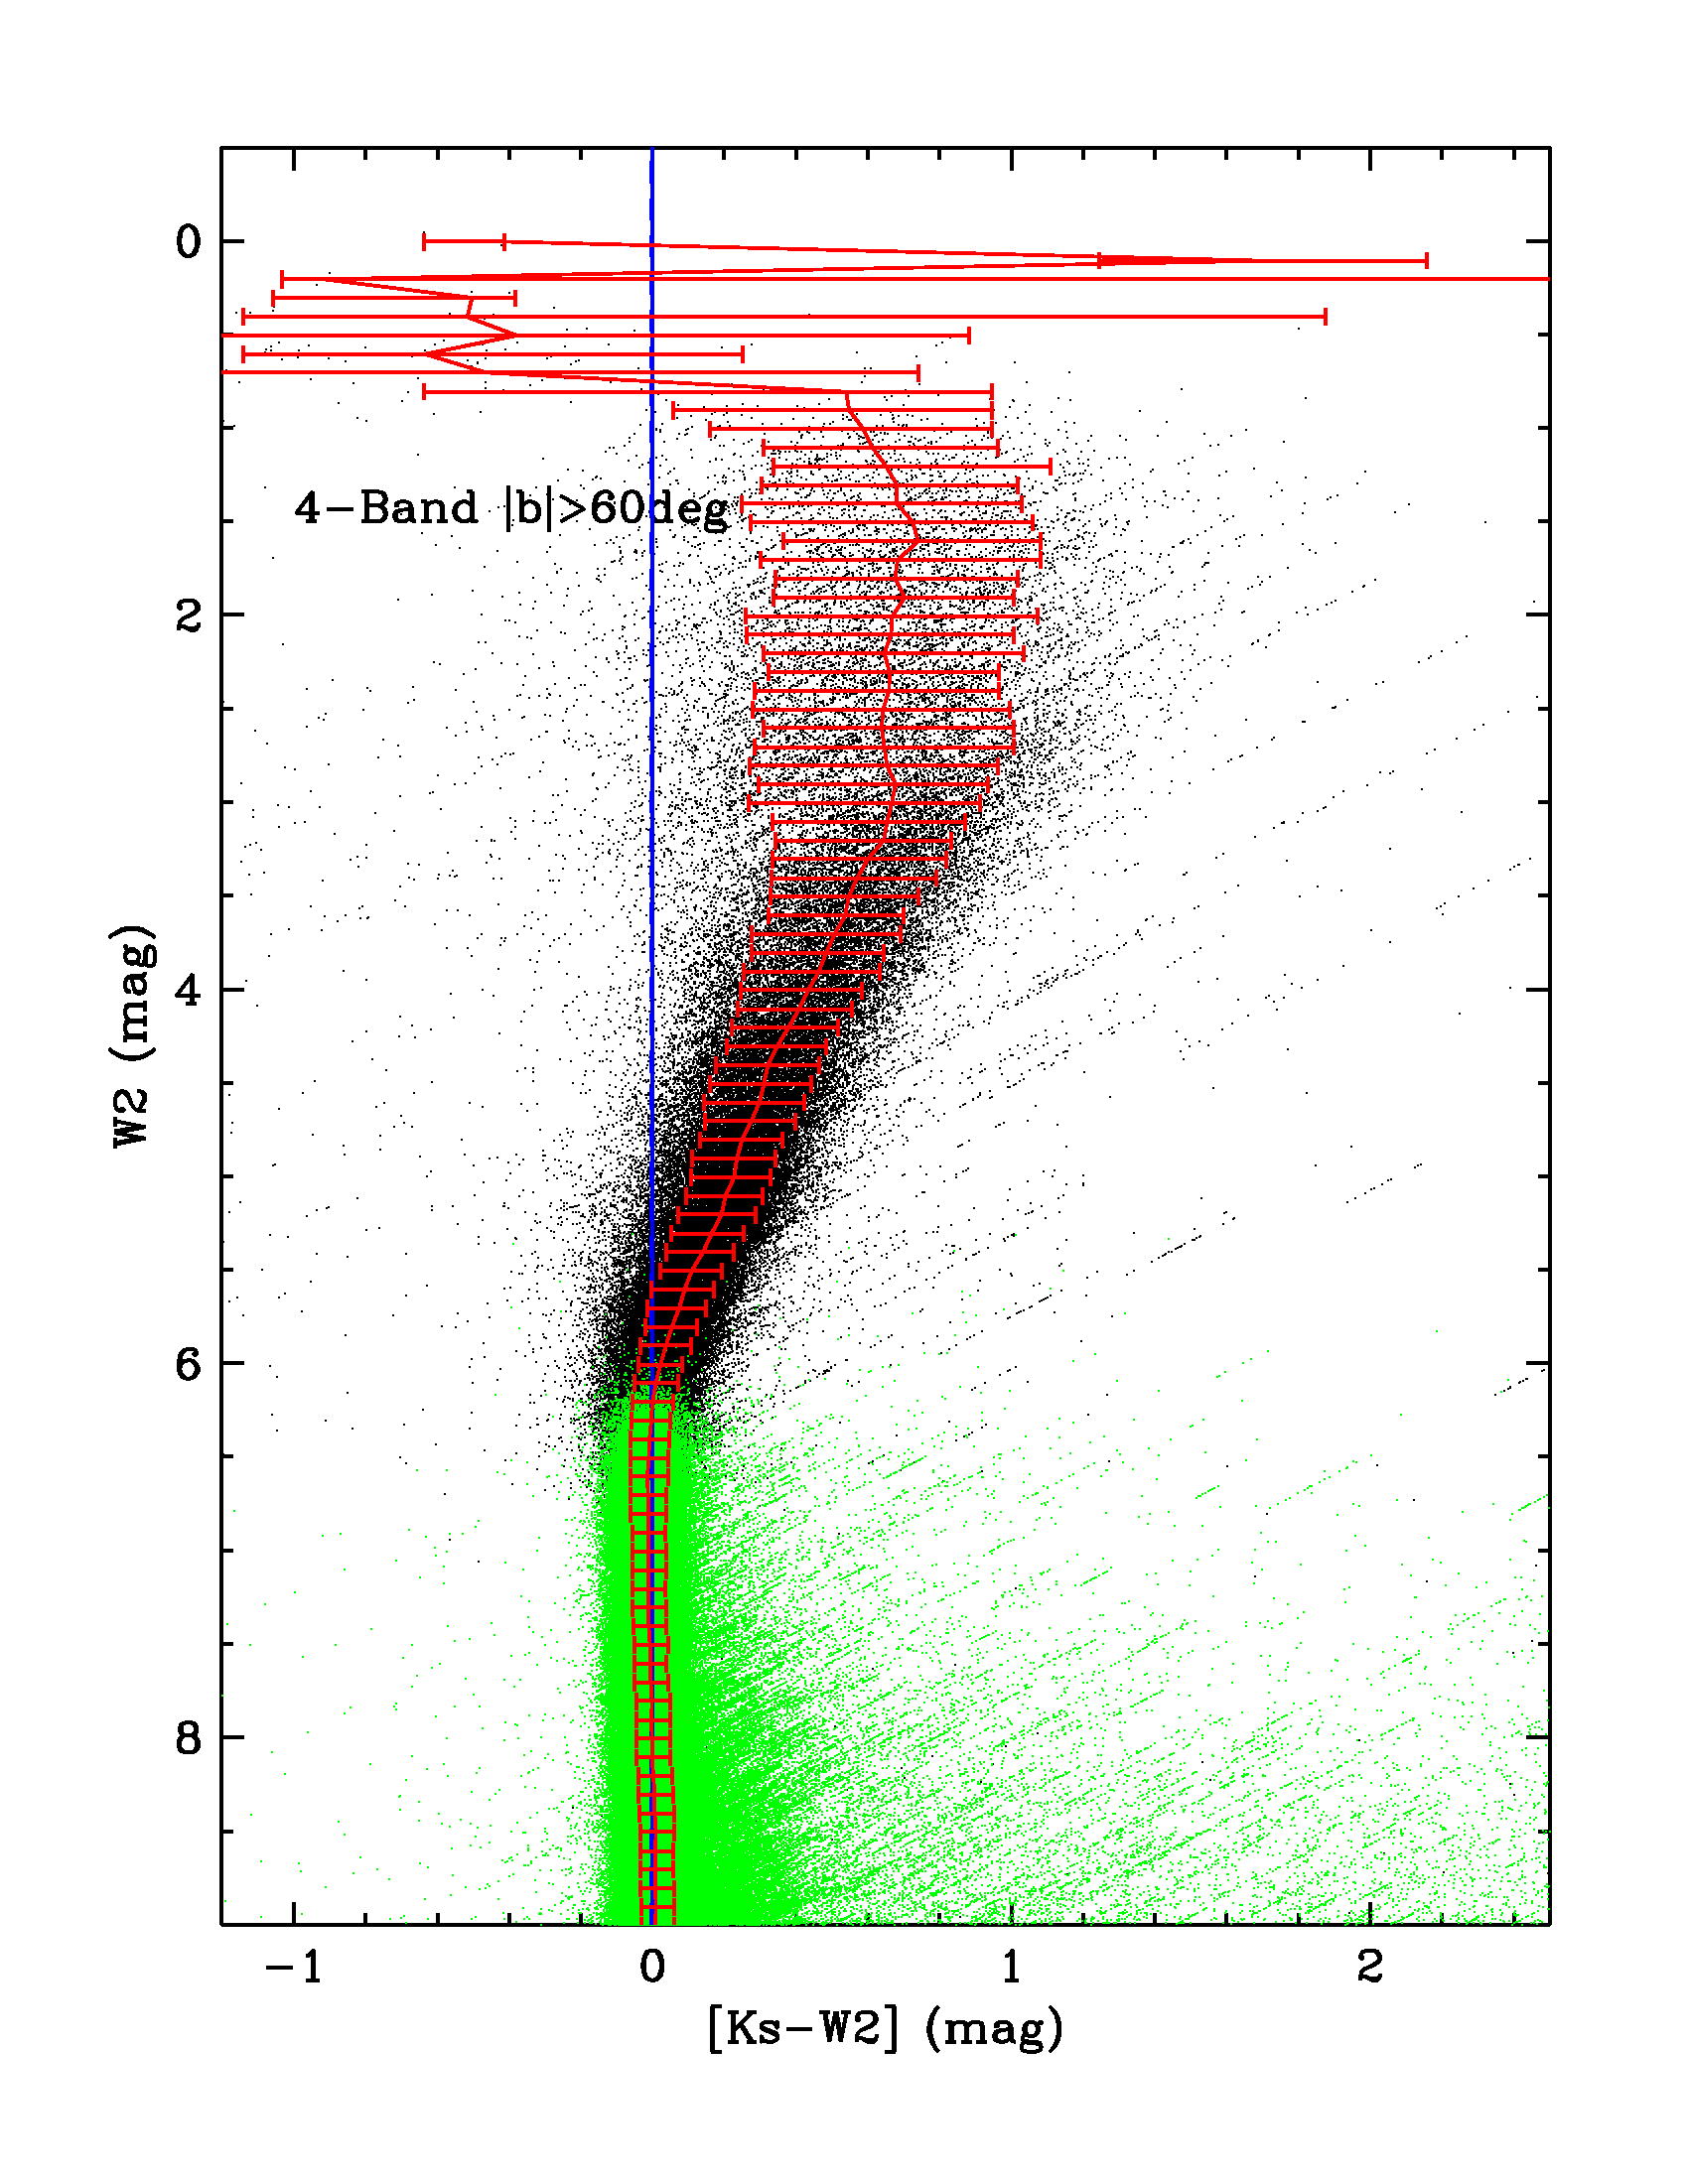
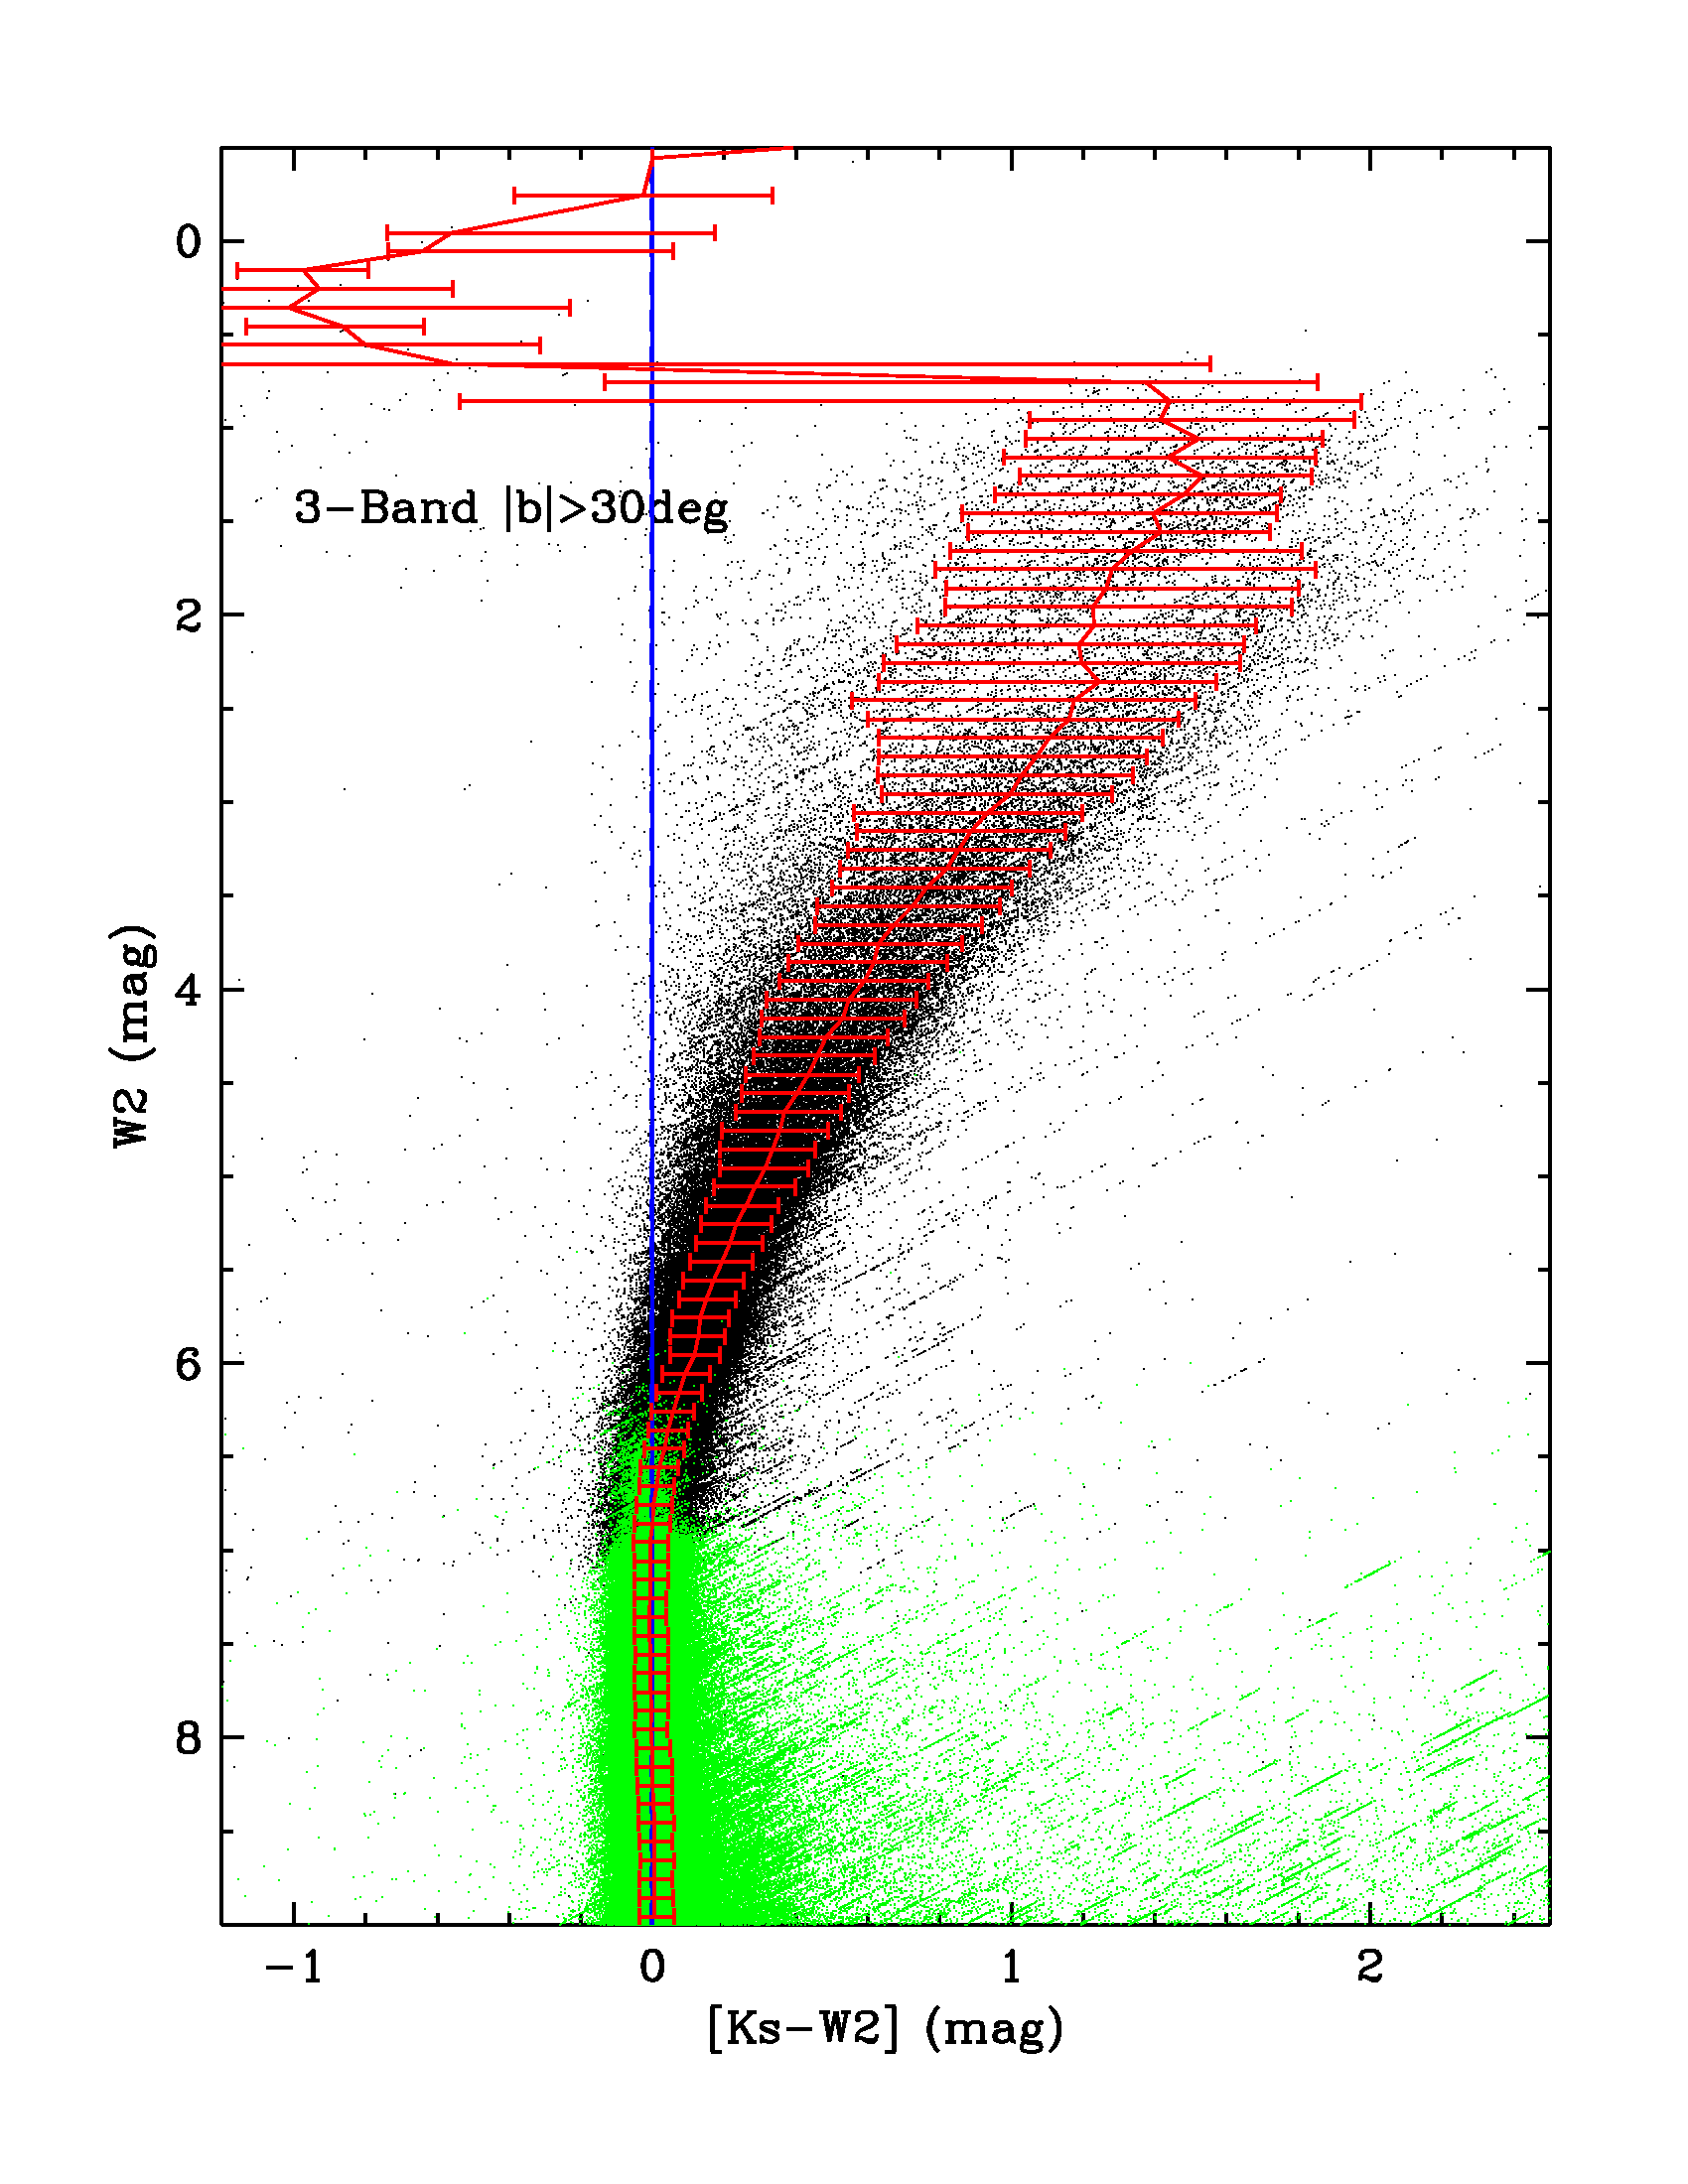
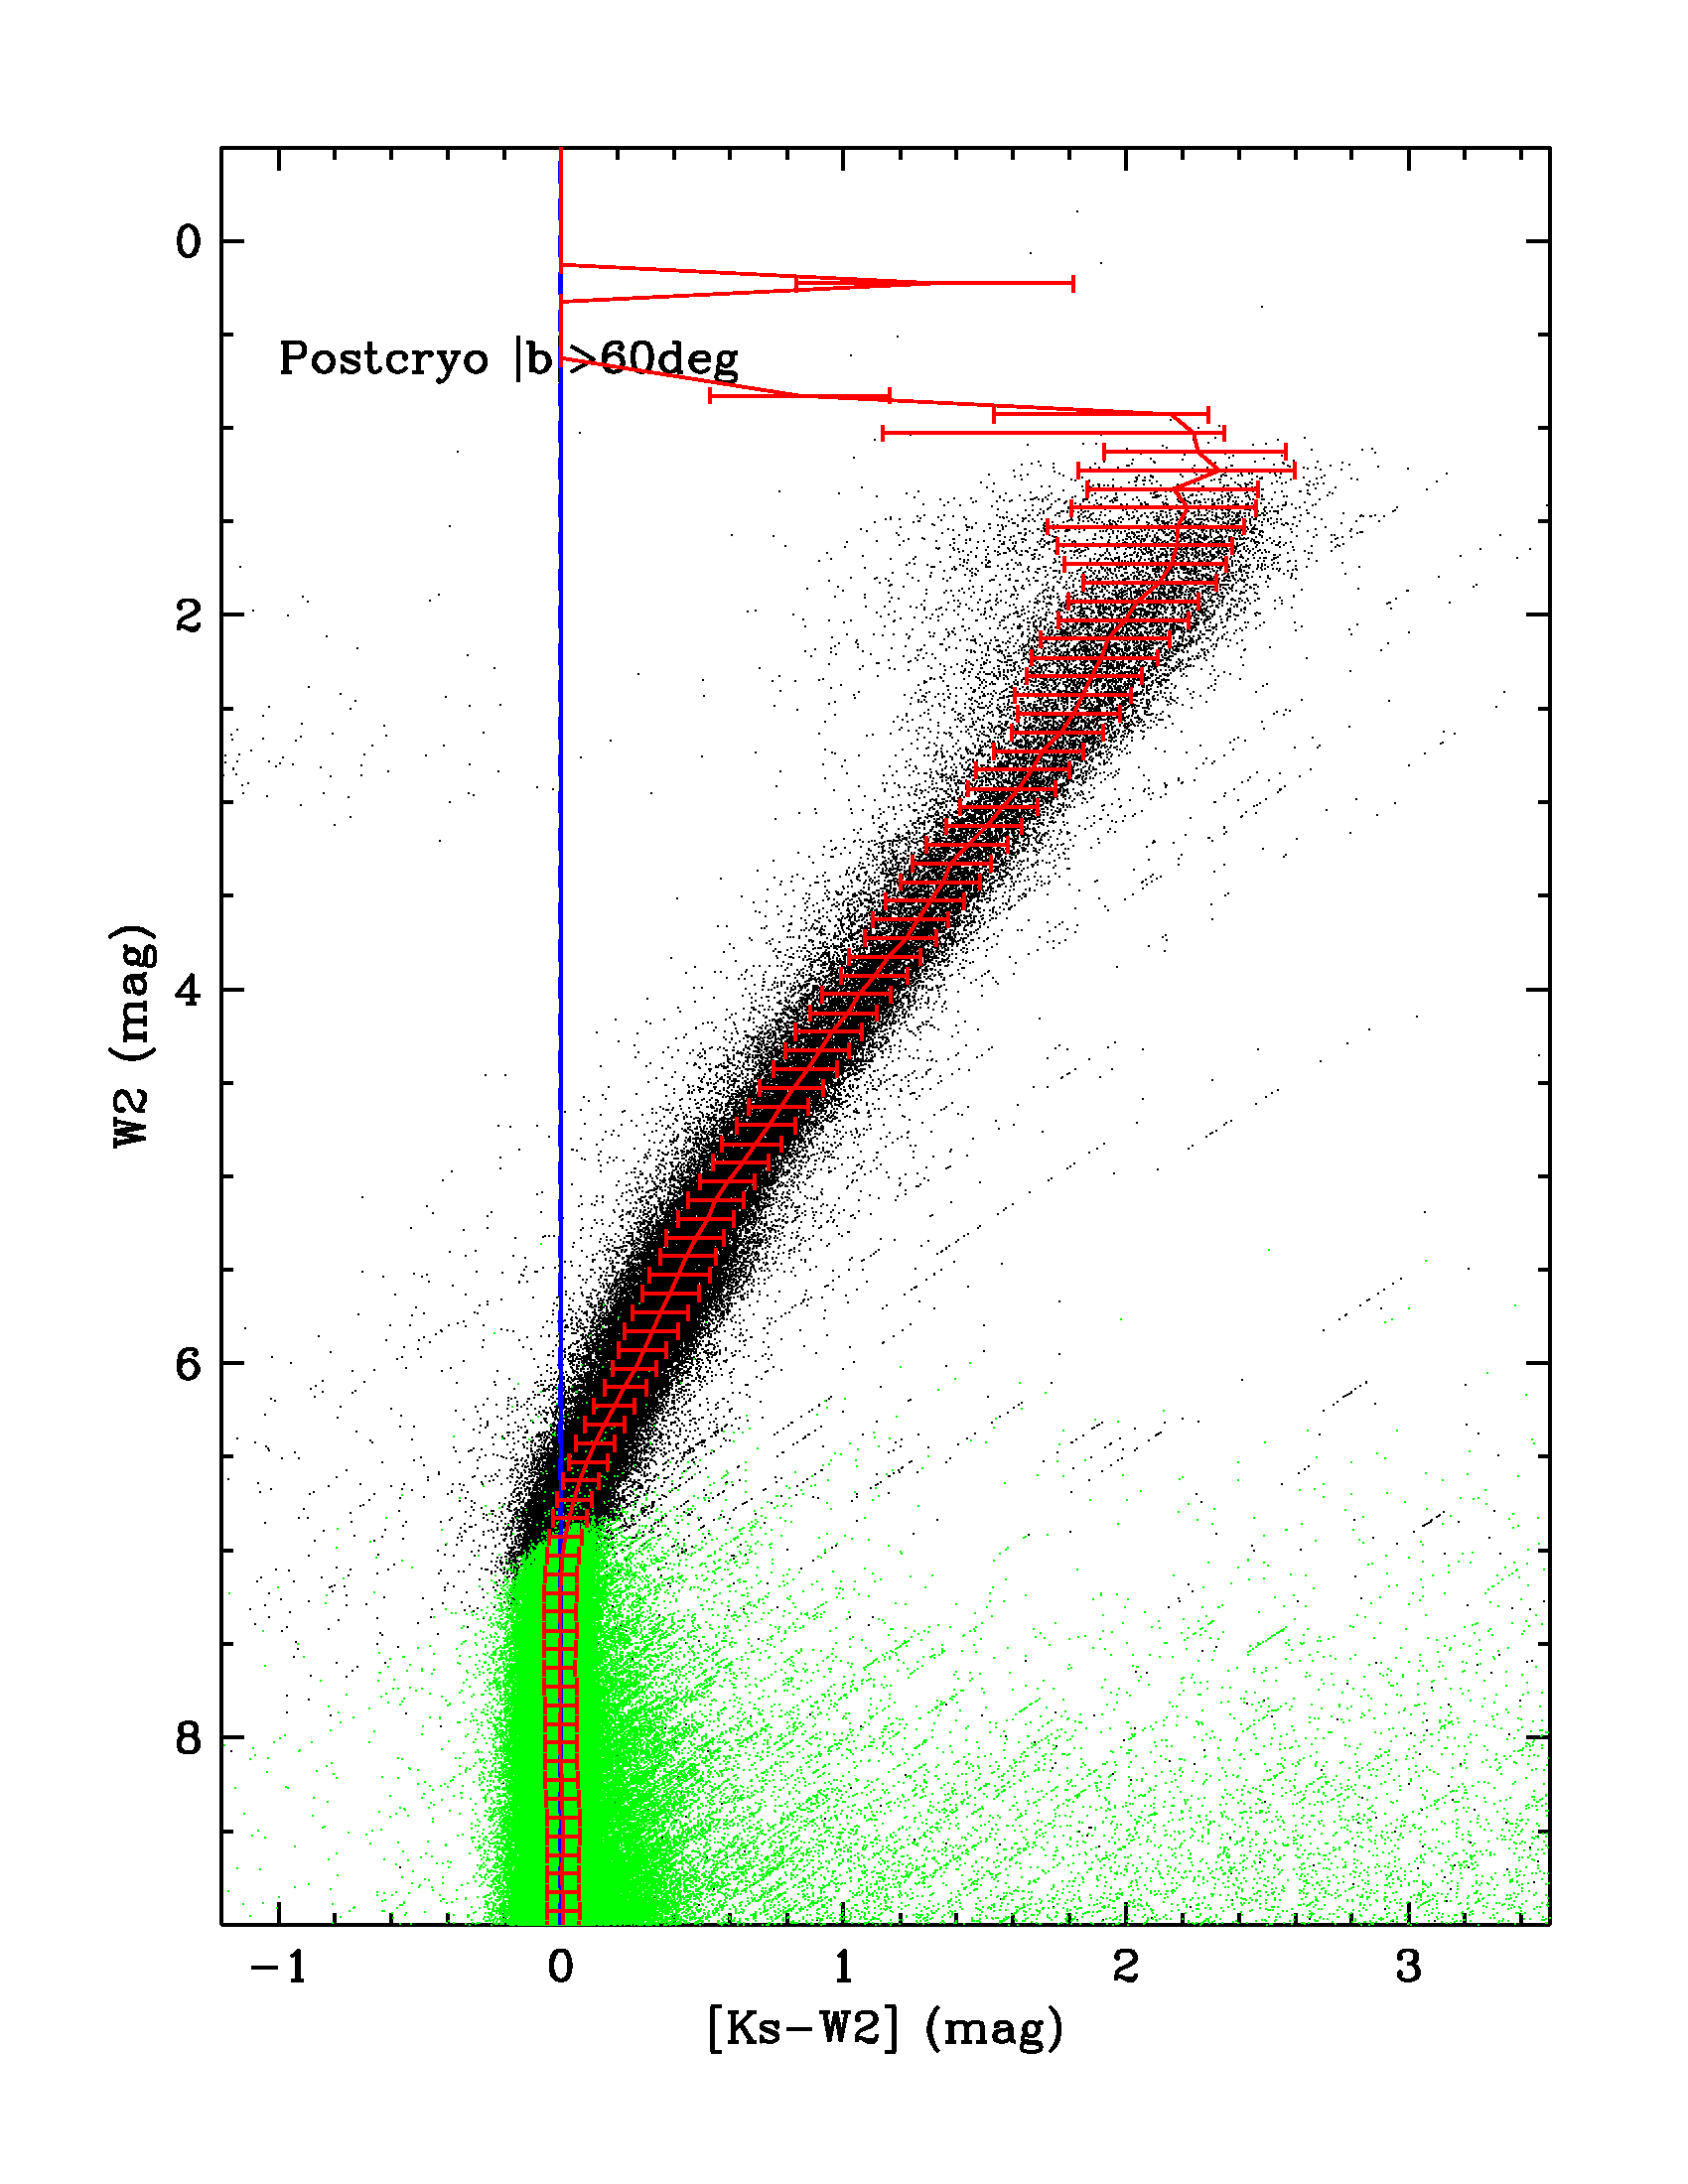
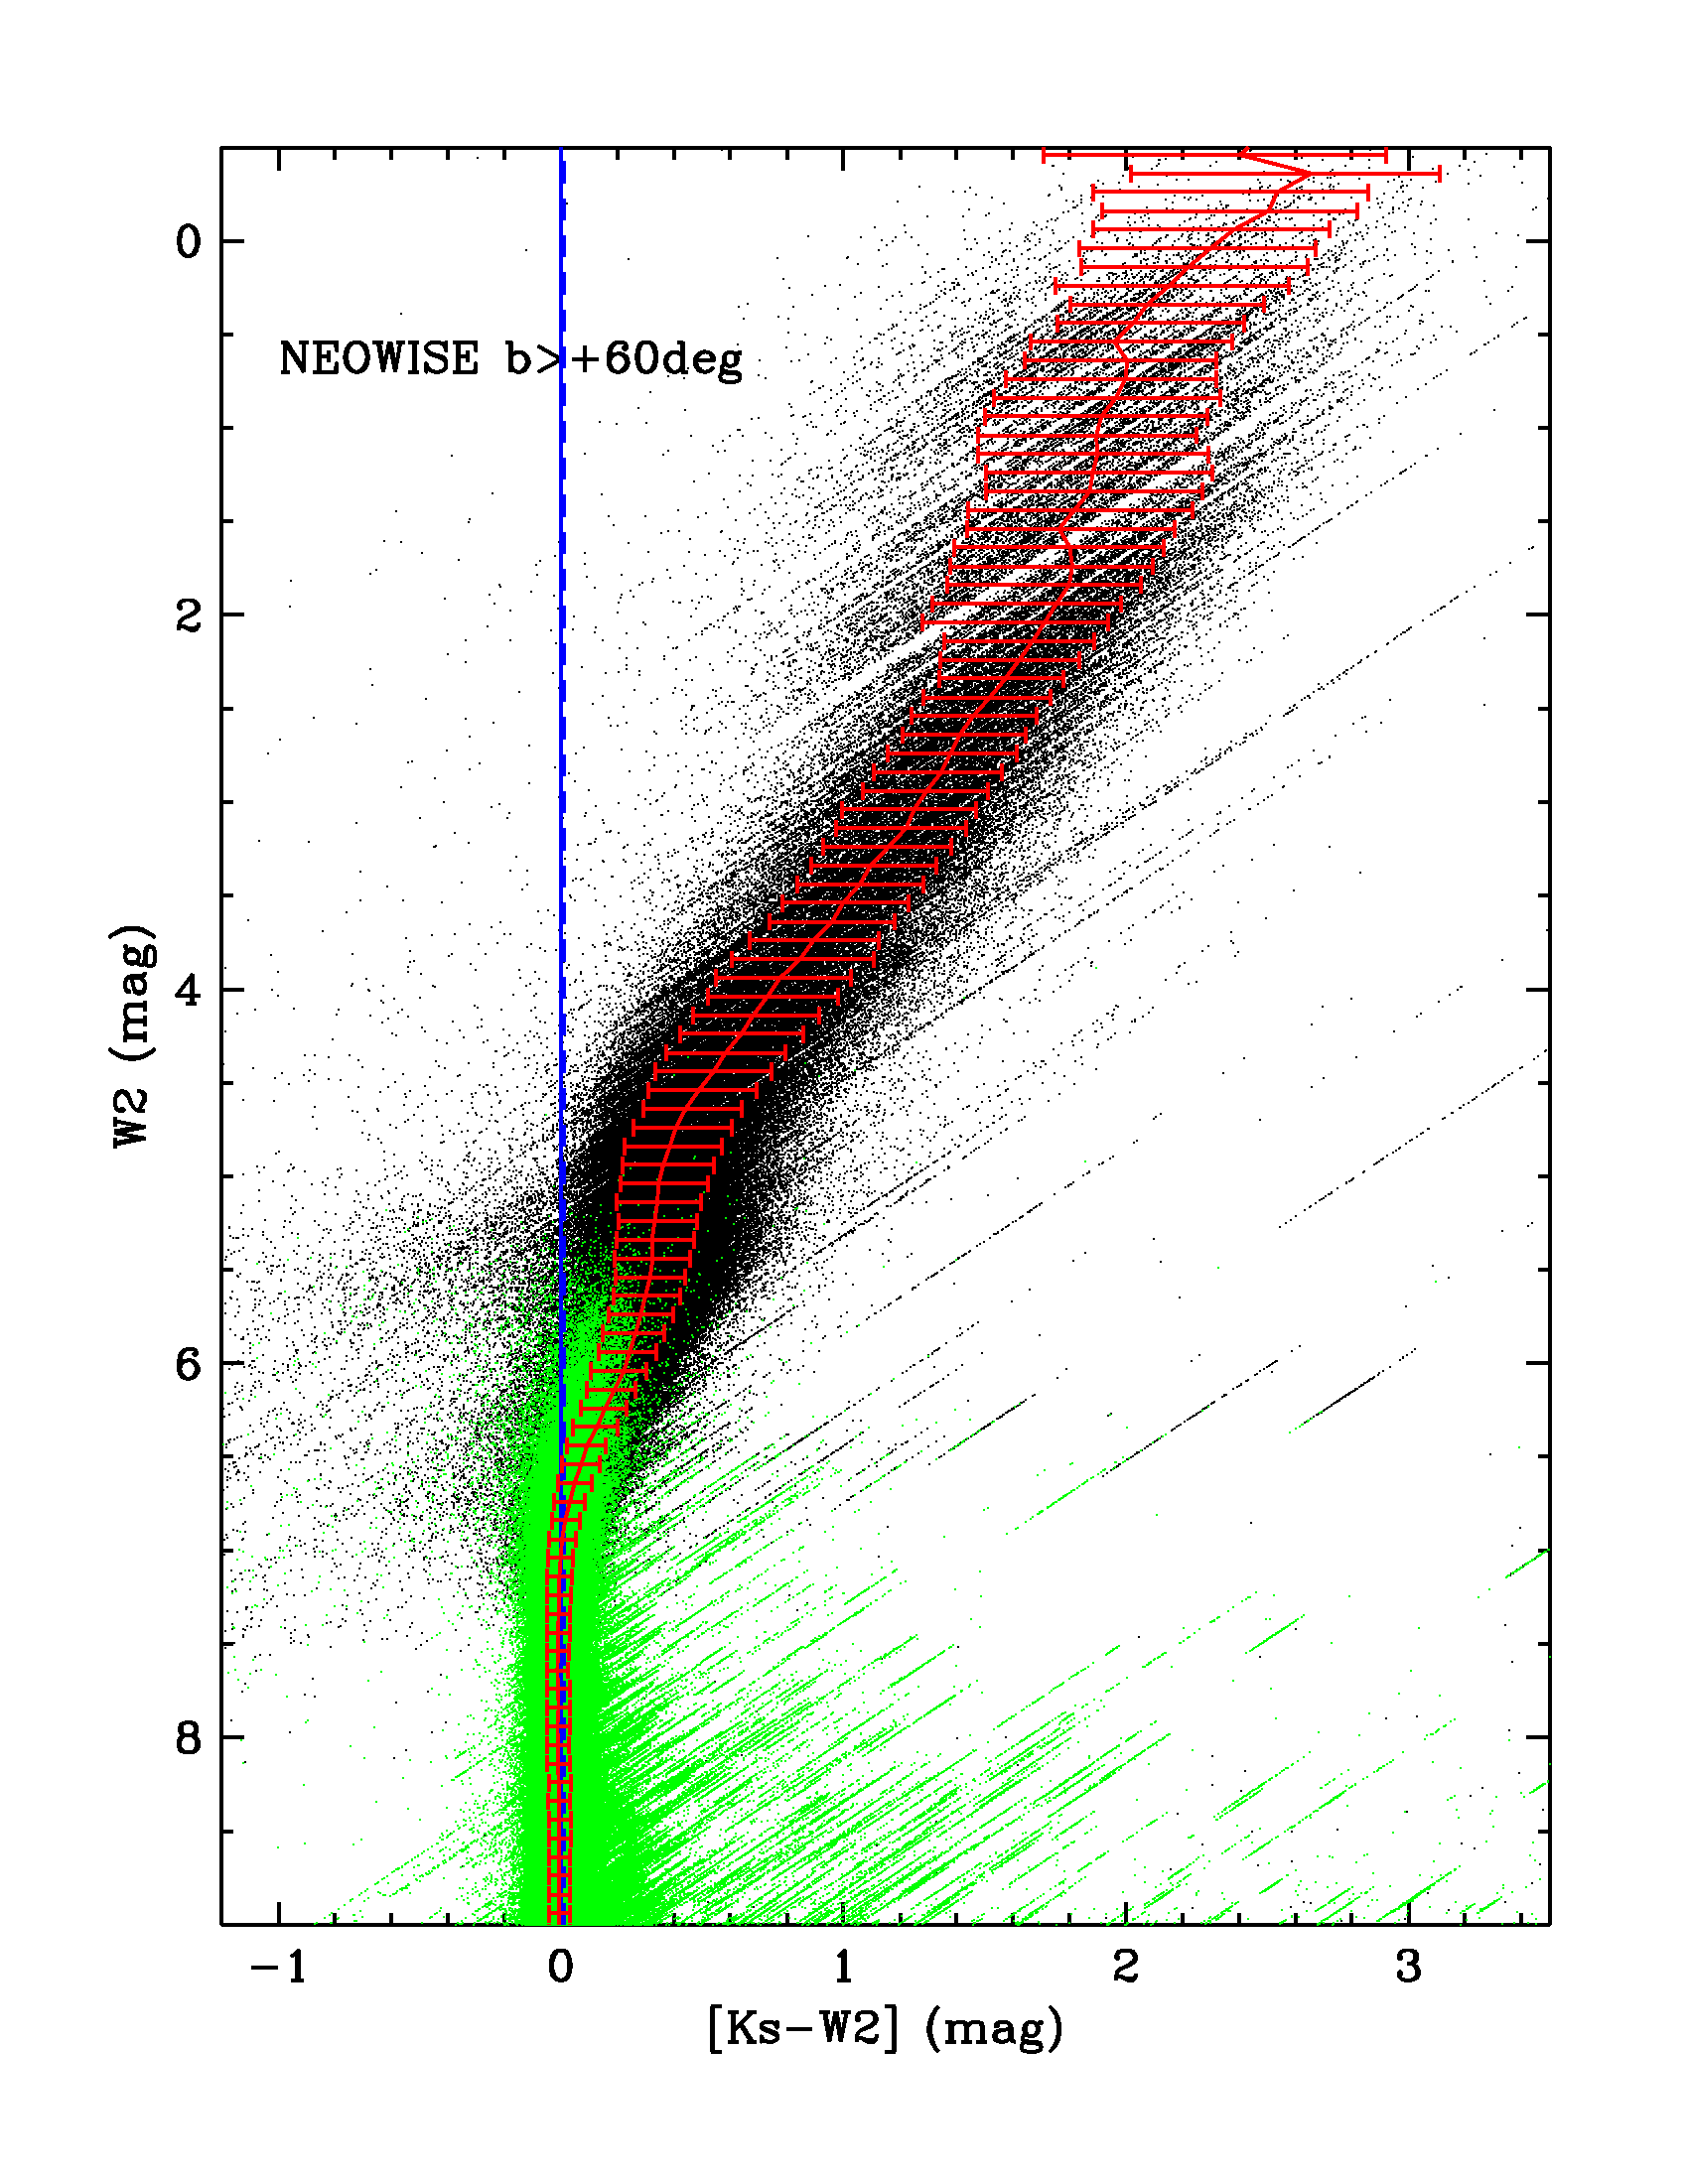
The WISE/NEOWISE saturated source W1 and W2 photometry performance during the four survey phases is illustrated in Figures 1a-d and 2a-d which contain the Ks-W1 and Ks-W2 color-magnitude diagrams (CMDs) for bright sources. 2MASS Point Source Catalog Ks photometry provides the near-infrared reference magnitudes. For the majority of stars observed away from the Galactic Plane, 2-20 μm samples the Rayleigh-Jeans part of stellar photospheric emission, and therefore the Vega Ks-to-WISE colors should be near zero. There will be some contamination from stars with emission in excess of pure photospheres, such as AGB and carbon stars, but these will be in the minority away from the Galactic Plane.
The CMDs were constructed using very large samples of bright, high galactic latitude source measurements drawn from the Single-exposure source databases for each phase. Measurements were required to satisfy the following criteria:
Different galactic latitude limits were used for each phase to ensure measurement sets large enough to yield robust statistics (see the labels in Figures 1 and 2). The selections yielded samples of 858,921, 1,014,197, 616,399 and 2,456,500 W1 measurements in 4-Band, 3-Band, Post-Cryo and Reactivation phases, respectively, and 836,681, 988,324, 603,125 and 2,606,266 W2 measurements in the four phases.
It should be pointed out that sources with Ks<3-4 mag saturated the 2MASS 51 ms Read_1 exposures. Fluxes for these saturated sources were estimated by fitting a 1-dimensional template to the non-saturated parts of the azimuthally averaged source profiles. Although it was not possible to fully characterize the quality of the saturated 2MASS source photometry during that survey, Smith et al. (2004) show that the 2MASS Ks photometry with Ks<4 mag agrees well with measurements reported in the DIRBE Point Source Catalog, with no significant biases between the two.
Figures 1a-d illustrate that during the WISE 4-Band and 3-Band cryogenic survey phases, the saturated W1 source near-to-mid-infrared colors are consistent with those for the bright non-saturated sources. However, during the Post-Cryo and NEOWISE Reactivation phases, the CMDs indicate that the W1 flux of sources begins to be overestimated at the onset of saturation, and the degree of overestimation increases with increasing source brightness. This leads to the increasing color bias for the saturated source measurements. Figure 2a-d illustrates that the W2 photometry of saturated sources is systematically overestimated in all survey phases. The degree of the W2 bias increased between the cryogenic and post-cryogenic phases.
The change in the photometric bias behavior between survey phases is most likely related to changes in the temperatures of the telescope and detectors. However, the exact mechanism that induces the bias is not understood.
 |
 |
 |
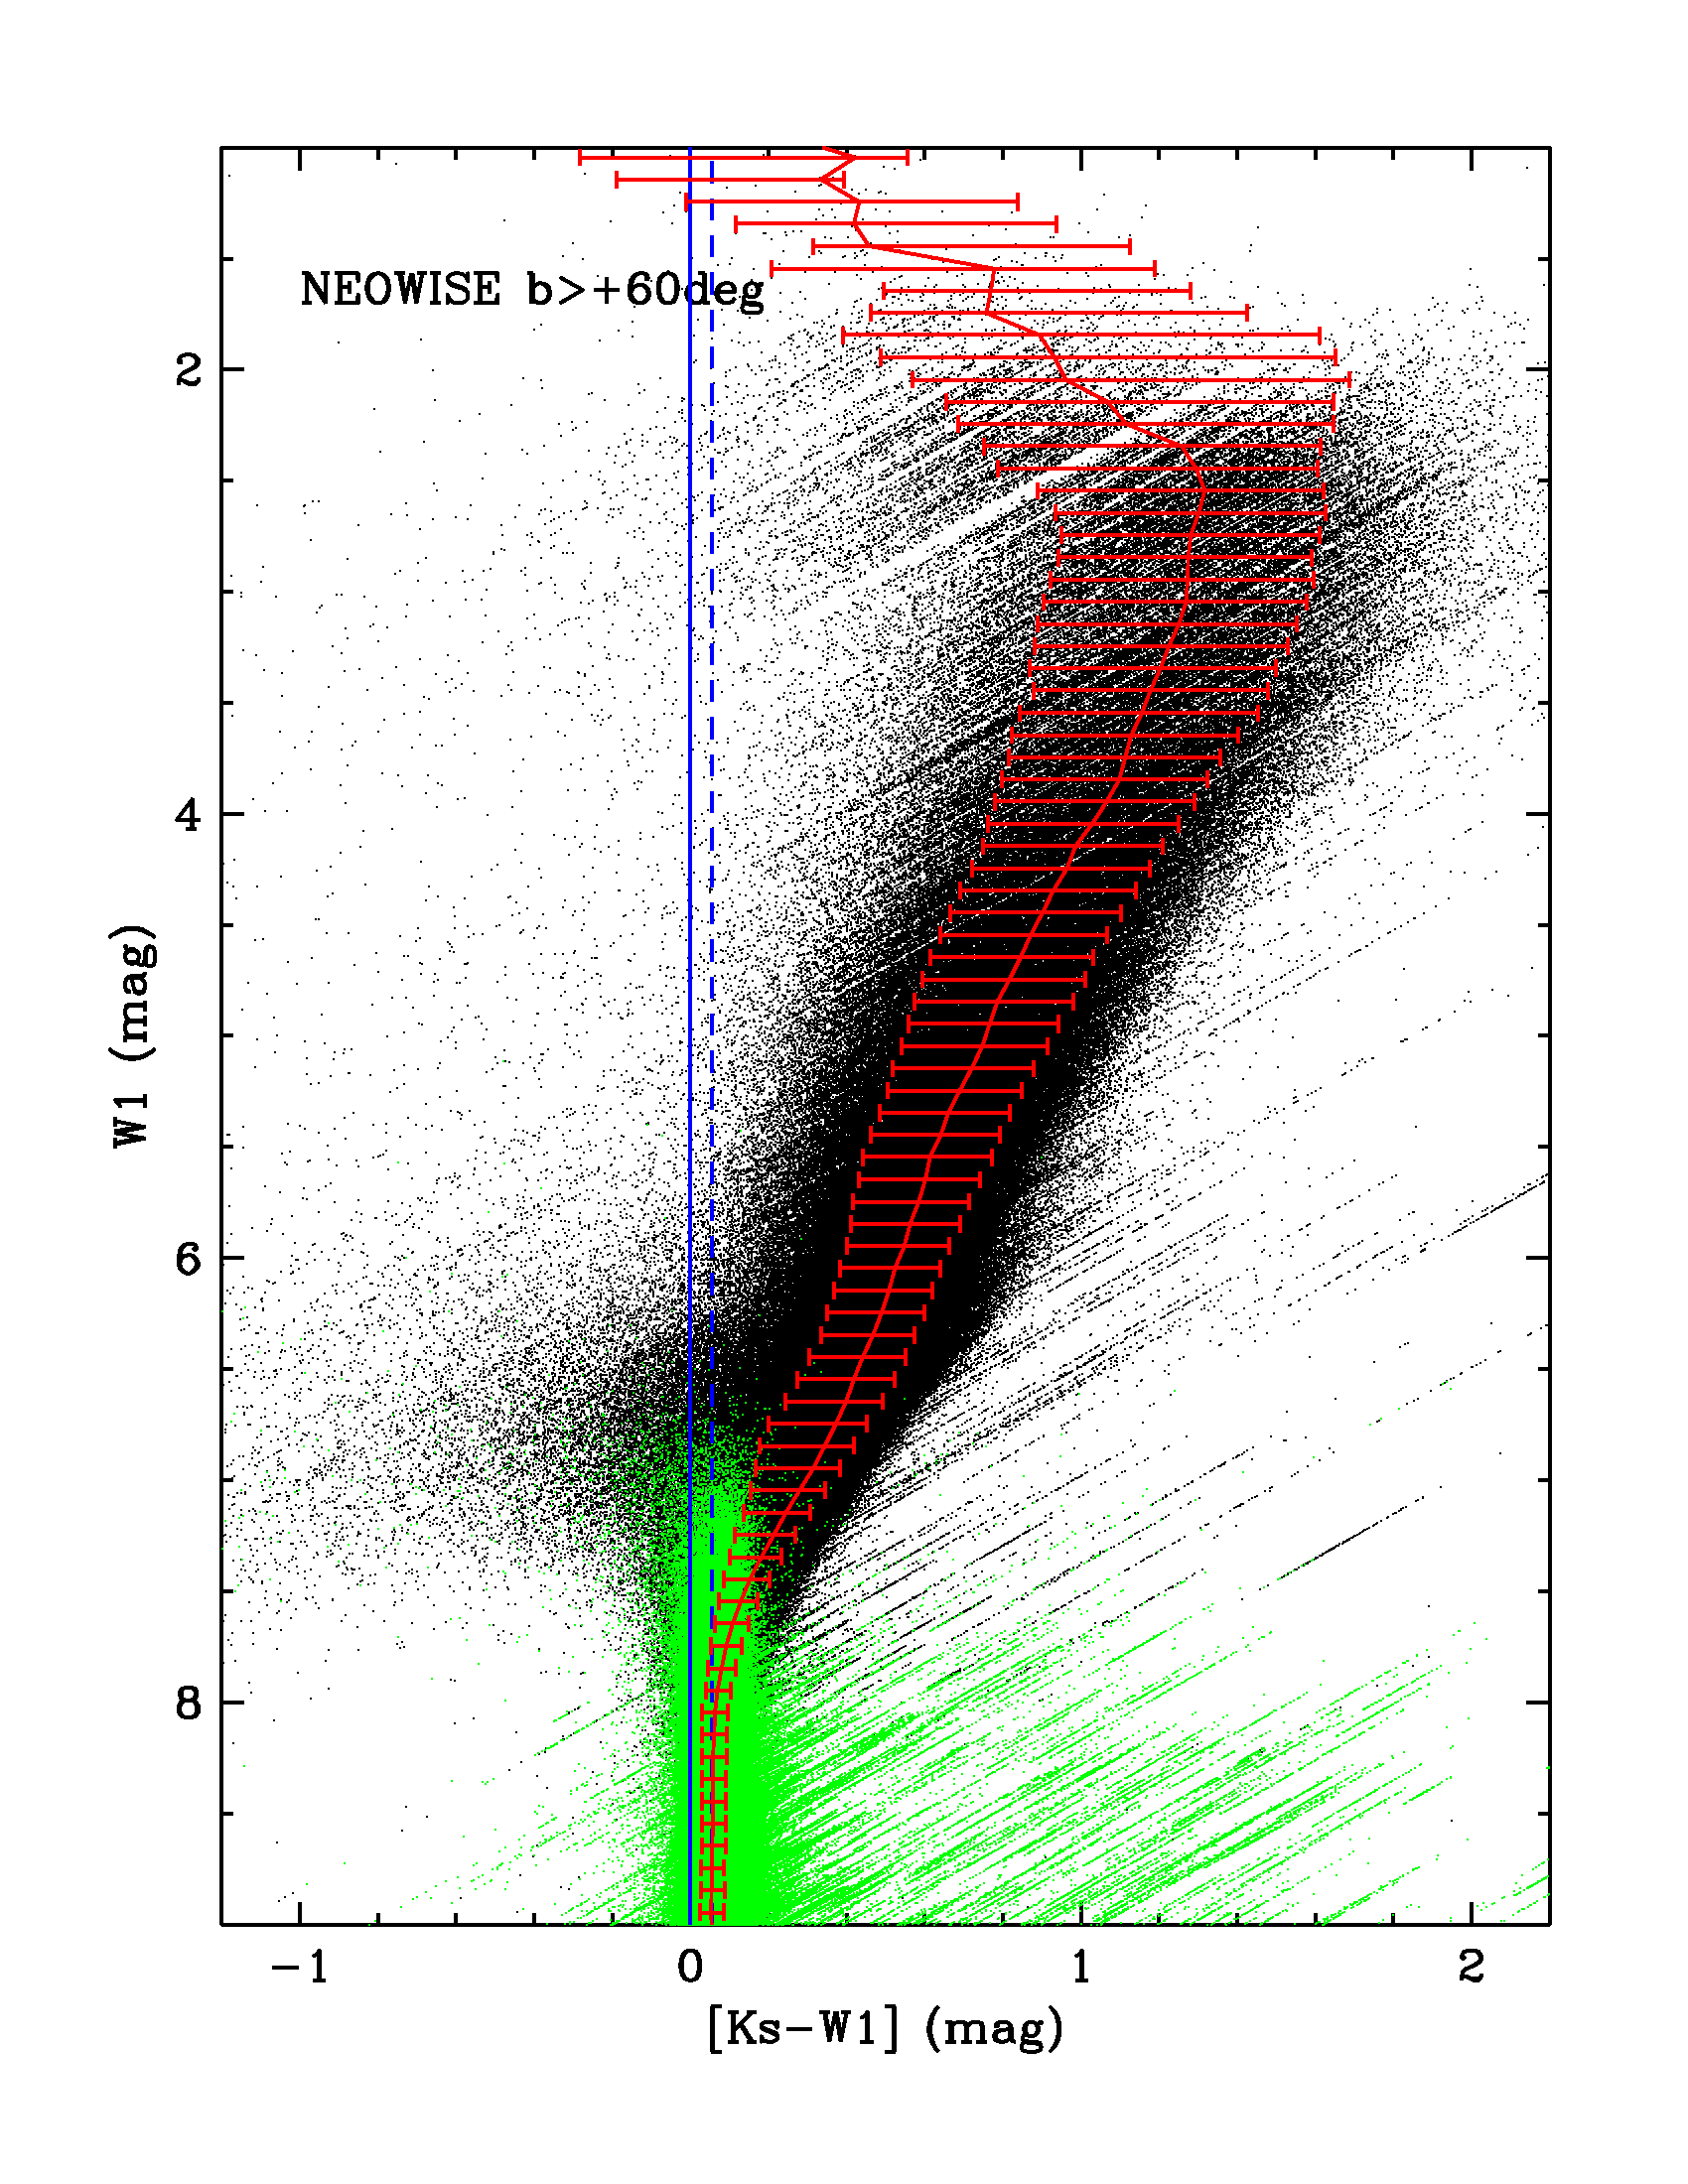 |
| Figure 1a - 4-Band Cryo - W1 | Figure 1b - 3-Band Cryo - W1 | Figure 1c - Post-Cryo - W1 | Figure 1d - NEOWISE - W1 |
| Ks-W1 color-magnitude diagrams for bright sources from the four WISE/NEOWISE survey phases. Green points represent photometry of non-saturated sources, and black points are saturated sources. The solid blue vertical lines denote Ks-W1 = 0 mag. The dashed blue vertical lines indicate the median color for the bright non-saturated sources. The red points are the median observed colors in 0.1 mag-wide bins of W1 magnitude. The horizontal error bars show the 84th and 16th percentiles (i.e., encompassing 68%) of the color distributions within each 0.1 mag-wide magnitude bin. | |||
 |
 |
 |
 |
| Figure 2a - 4-Band Cryo - W2 | Figure 2b - 3-Band Cryo - W2 | Figure 2c - Post-Cryo - W2 | Figure 2d - NEOWISE - W2 |
| Ks-W2 color-magnitude diagrams for bright sources from the four WISE/NEOWISE survey phases. Green points represent photometry of non-saturated sources, and black points are saturated sources. The solid blue vertical lines denote Ks-W2 = 0 mag. The dashed blue vertical lines indicate the median color for the bright non-saturated sources. The red points are the median observed colors in 0.1 mag-wide bins of W2 magnitude. The horizontal error bars show the 84th and 16th percentiles (i.e., encompassing 68%) of the color distributions in each 0.1 mag-wide magnitude bin. | |||
The CMDs in Figures 1 and 2 can be used to estimate empirical corrections to the WISE/NEOWISE saturated source photometry biases. To do this, we first measure the median Ks-W1 and Ks-W2 colors of the bright, but non-saturated sources in each survey phase (i.e., the green points in Figures 1 and 2). The median and RMS of the baseline colors for each survey phase are listed in Table 1. The variations in the baseline Ks-W1 colors between phases are due in part to small, uncorrected photometric zero-point calibrations used during data processing.
| Survey Phase | median(Ks-W1) (mag) | rms(Ks-W1) (mag) | median(Ks-W2) (mag) | rms(Ks-W2) (mag) |
|---|---|---|---|---|
| 4-Band Cryo | 0.077 | 0.026 | 0.001 | 0.030 |
| 3-Band Cryo | 0.084 | 0.033 | 0.001 | 0.030 |
| Post-Cryo | 0.067 | 0.029 | 0.003 | 0.035 |
| Reactivation | 0.057 | 0.022 | -0.008 | 0.027 |
The baseline colors were then subtracted from the measured colors of all sources in each of the samples to provide a measure of the residual color bias. Assuming that there is no flux-dependent bias in the 2MASS photometry, the color bias is the correction that would need to be applied to the WISE/NEOWISE photometry to return colors to the baselines. The median color bias and the 16th and 84th percentiles were then computed for all corrected measurements in 0.1 mag-wide bins in W1 and W2 to provide a measure of the bias correction and 68% confidence interval as a function of brightness. The final step was to perform spline fits to the median and 16th/84th percentile distributions as a function of magnitude to provide smoothing of the corrections.
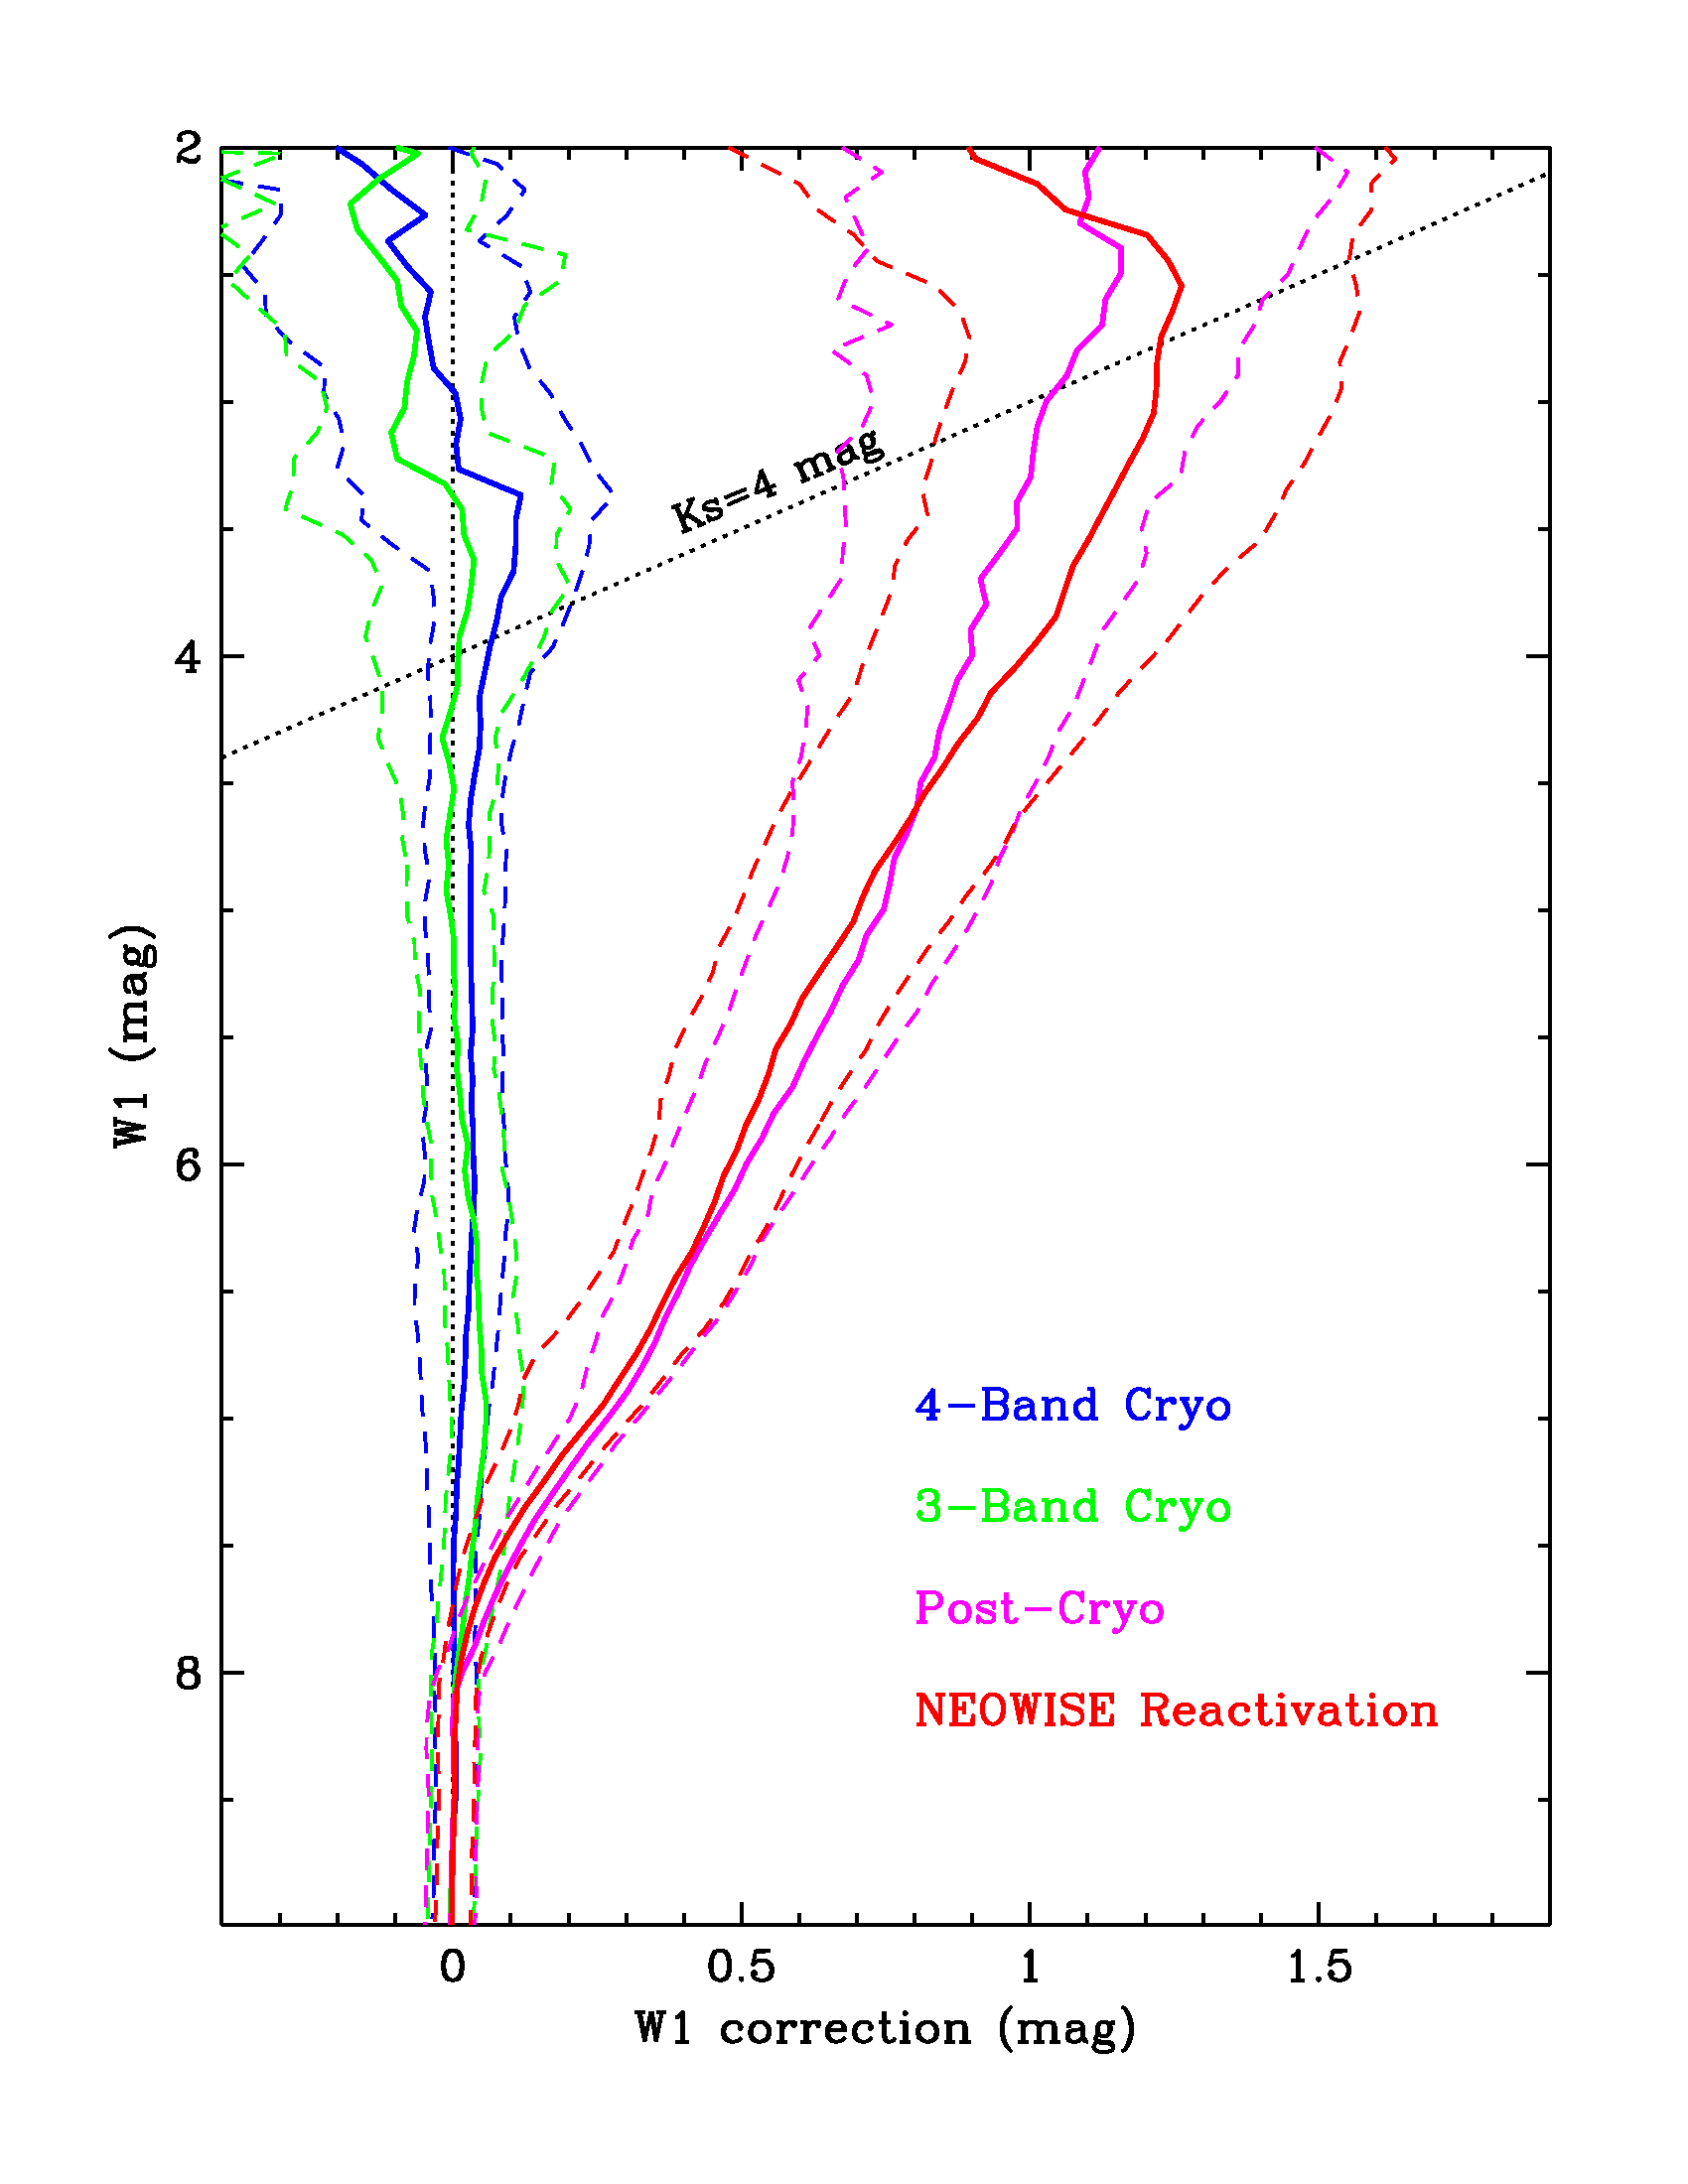
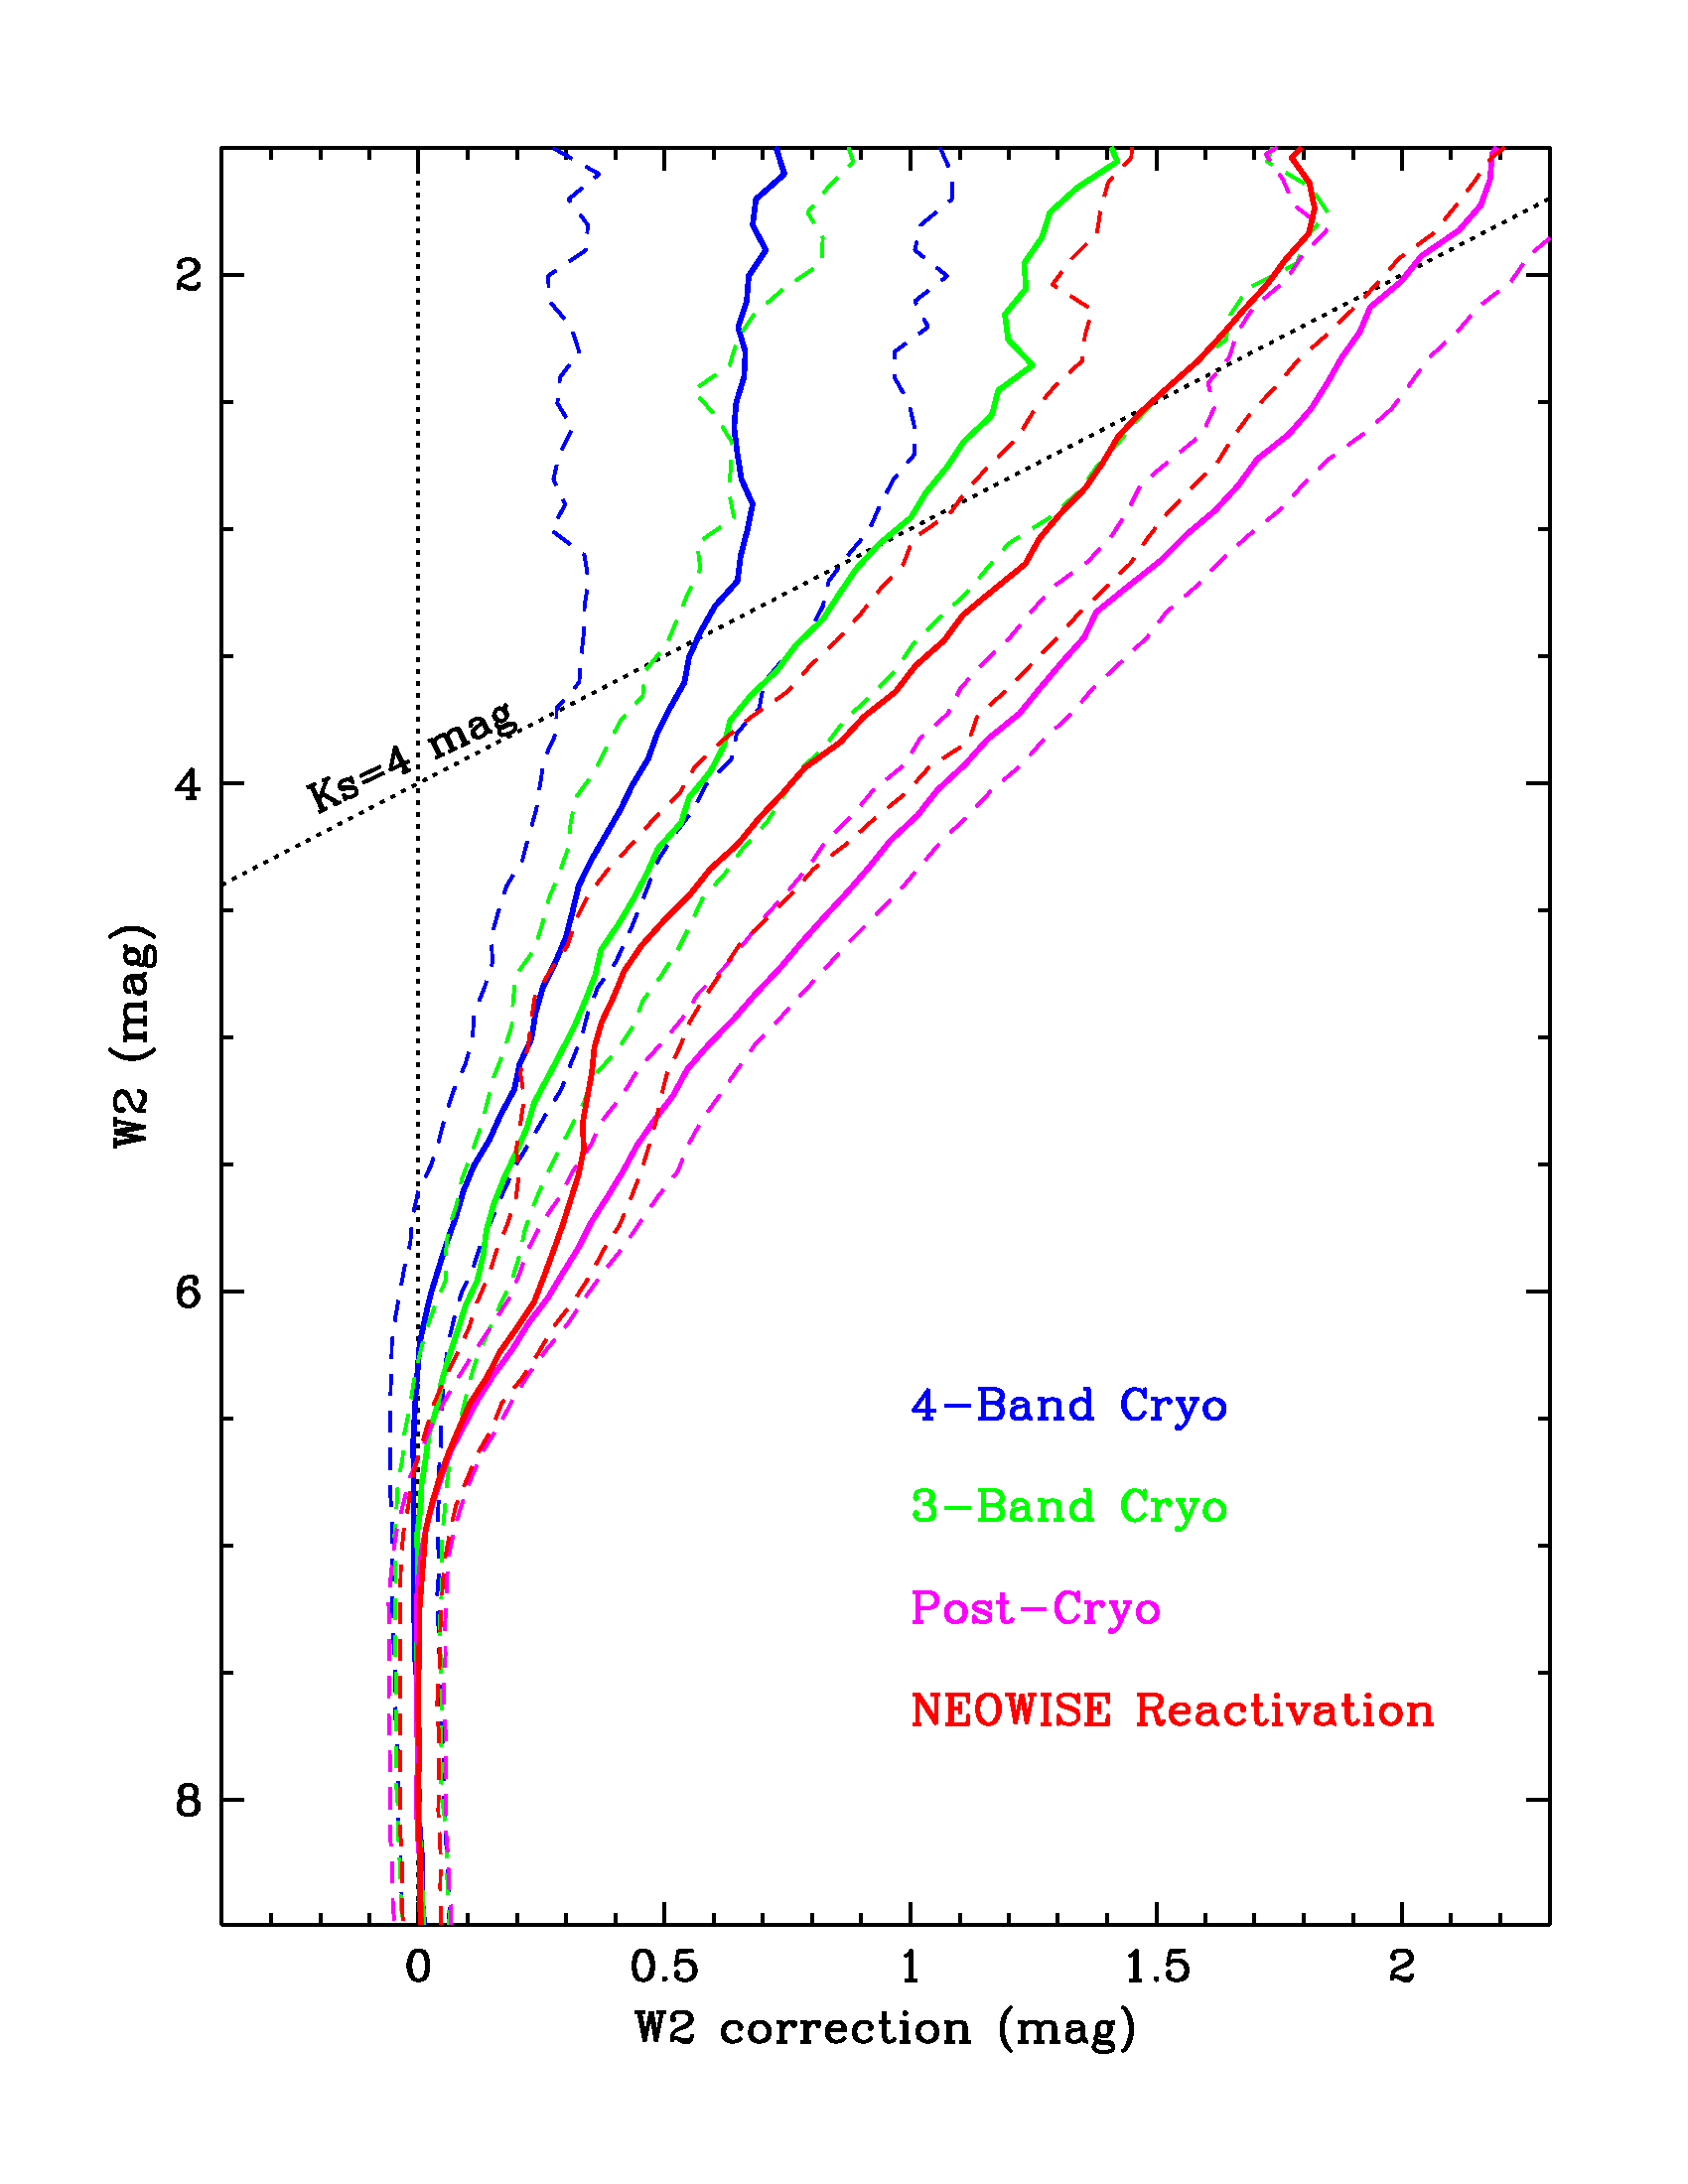
The resulting fits to the bias corrections and 68% confidence intervals for each survey phase are plotted as a function of magnitude in Figures 3 and 4. As a rule, the bias distributions in each magnitude bin are not symmetric, so the resulting confidence intervals are also asymmetric. The diagonal lines in the figures indicate where the 2MASS Ks magnitudes are equal to 4, the approximate location of 2MASS saturation. The corrections for WISE/NEOWISE sources above these lines should not be considered reliable, and we do not recommend using them.
 |
 |
| Figure 3 - W1 | Figure 4 - W2 |
| Saturation bias corrections derived from Ks-W1 and Ks-W2 color-magnitude diagrams shown in Figures 1a-d and 2a-d. The blue lines are the 4-Band Cryo survey phase, green lines are for 3-Band Cryo, magenta lines for Post-Cryo, and the red lines are for the NEOWISE Reactivation survey. In each case, the solid line is the correction value and the dashed lines correspond to the 68% confidence intervals. The dashed diagonal line indicates where the corrections are based on 2MASS Ks magnitudes brighter than 4.0 where the 2MASS measurements are saturated. | |
Table 2 contains links to downloadable text files that contain the spline fits to the W1 and W2 saturation photometric bias corrections for each survey phase. The columns in these tables include the measured WISE/NEOWISE profile-fit magnitudes w1mpro and w2mpro, the magnitude corrections w1mcorr and w2mcorr, and the lower (w1lunc and w2lunc) and upper (w1uunc and w2uunc) robust uncertainties on the corrections derived from the 68th percentiles. Corrections are included only for measured magnitude ranges where the near-to-mid infrared colors correspond to Ks>4 mag. The correction is applied in the sense that they should be added to the measured profile-fit magnitude (w1mpro or w2mpro). The correction uncertainties should be treated as systematic and combined with the profile-fit measurement uncertainties as such. The correction and uncertainties to be used are those corresponding to the closest W1 or W2 magnitudes listed under the appropriate link in Table 2.
| Survey Phase | W1 | W2 |
|---|---|---|
| 4-Band Cryo | X | X |
| 3-Band Cryo | X | X |
| Post-Cryo | X | X |
| Reactivation | X | X |
Last Updated: 12 November 2024