


NEOWISE Single-exposure Source Database equatorial positions are accurate to ~70 mas in Right Ascension and Declination relative to the ICRF for bright, non-confused detections.
J2000 equatorial positions in the NEOWISE Single-exposure Source Database are reconstructed using bright 2MASS point sources as the astrometric reference. The positions of the 2MASS reference sources have been corrected for motion in the 12 to 26 years separating 2MASS and NEOWISE observations using proper motions from the UCAC4 catalog (Zacharias, N. et al. 2013) (see IV.2.b.ii.).
The characteristic astrometric accuracy of individual detections in the NEOWISE Single-exposure Source DB is illustrated in Figure 1. The mean radial position offsets in 0.2 mag wide bins between NEOWISE Single-exposure positions and those from 1) quasars that define the ICRF3 over the entire sky; 2) Gaia DR3 sources within 5° of the north Galactic pole; and 3) AllWISE Source Catalog sources within 5° of the north Galactic pole are plotted as a function of NEOWISE W1 magnitude. No corrections have been applied for proper motion between the NEOWISE and AllWISE or Gaia observation epochs. For bright, non-saturated sources (8<W1<12 mag), the mean radial separation between NEOWISE and both the ICRF quasars and Gaia DR3 sources is ~100 mas. The mean NEOWISE-AllWISE residuals are slightly higher, approximately 140 mas, because the AllWISE positions have a larger intrinsic uncertainty than the ICRF3 and Gaia DR3 astrometry. As photon noise becomes more important in the NEOWISE source extractions, for W1>12 mag, the radial position residuals with respect to each of the comparison samples increase with decreasing source brightness.
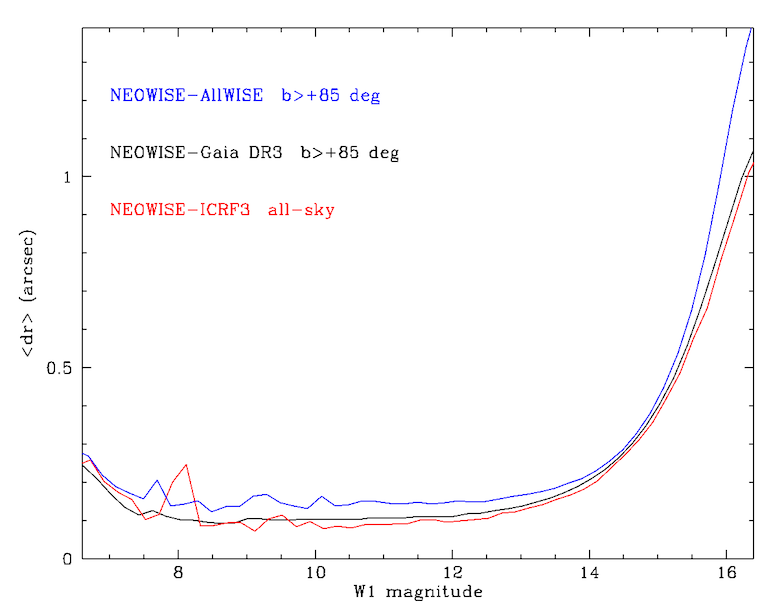 |
| Figure 1 - Mean NEOWISE Single-exposure Source DB radial position differences with respect to ICRF3 quasars over the entire sky (red curve), Gaia DR3 Catalog sources within 5° of the north Galactic pole (black curve), and AllWISE Catalog sources within 5° of the north Galactic pole (blue curve). |
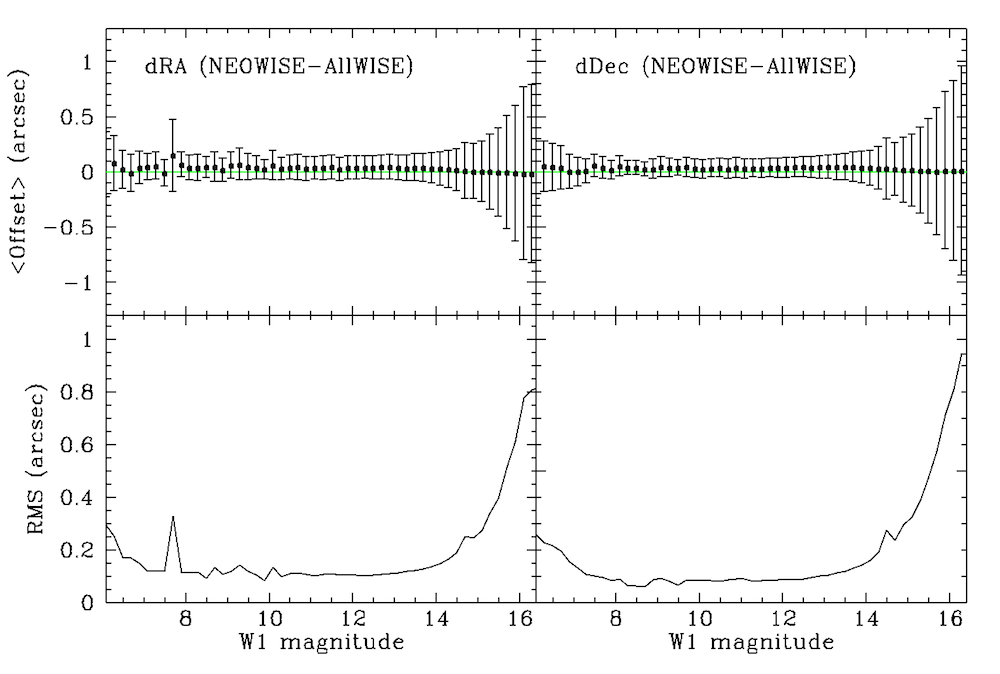
The mean and RMS of the NEOWISE-AllWISE and NEOWISE-Gaia DR3 position differences on the RA and Declination axes are shown in Figures 2 and 3, respectively. The mean bias between NEOWISE and AllWISE positions, and NEOWISE and Gaia positions is <20 mas on each axis. For high SNR, non-saturated sources (8<W1<12 mag), the RMS of the NEOWISE-AllWISE and NEOWISE-Gaia DR3 position residuals is <70 mas on each axis. The RMS of the RA and Dec position residuals increase with decreasing source brightness fainter than W1>12 mag, and also for increasingly saturated sources brighter than W1<8 mag.
 |
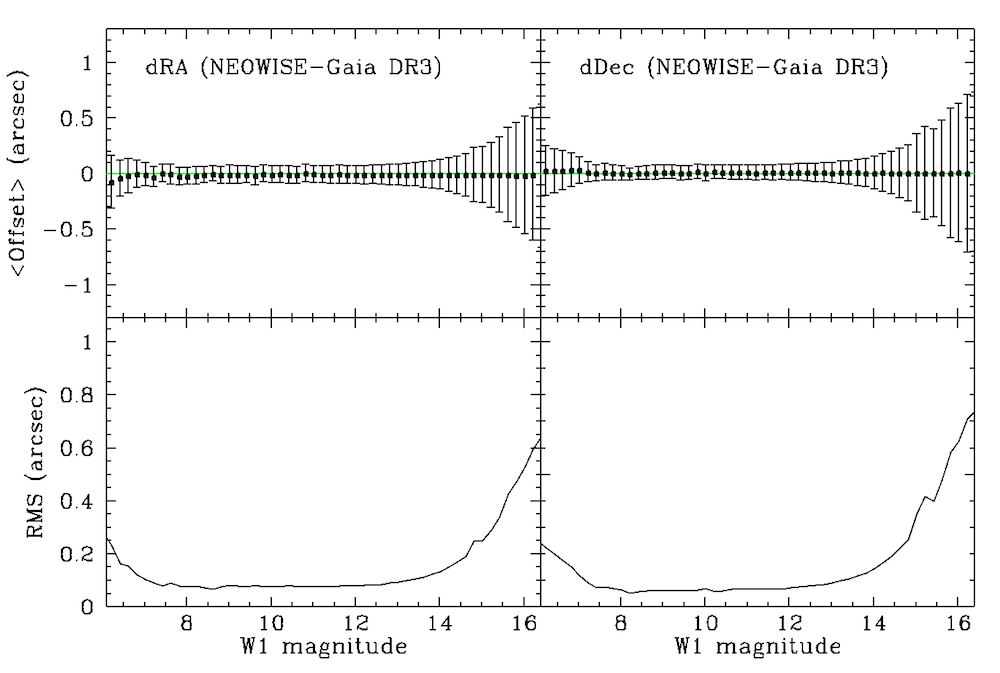 |
Figure 2 - (top panels) Average NEOWISE-AllWISE RA (left) and Dec (right) position differences for sources in 0.2 mag wide bins as a function of NEOWISE W1 magnitude, for Single-exposure Source DB entries within 5° of the north Galactic pole. (bottom panels) RMS of the NEOWISE-AllWISE position residuals in the top panel as a function of NEOWISE W1 magnitude. | Figure 3 - (top panels) Average NEOWISE-Gaia DR3 RA (left) and Dec (right) position differences for sources in 0.2 mag wide bins as a function of NEOWISE W1 magnitude, for Single-exposure Source DB entries within 5° of the north Galactic pole. (bottom panels) RMS of the NEOWISE-Gaia position residuals in the top panel as a function of NEOWISE W1 magnitude. |
Astrometric bias in the NEOWISE source positions with respect to the ICRF is typically <20 mas, with relatively little structure around the sky. In Figure 4 are histograms of the RA and Declination offsets between NEOWISE and Gaia DR3 positions for a sample of bright sources having 10.5≤Ggaia<10.6 and 8<W1<12 mag over the full sky. The distributions each contain approximately 8.8 million NEOWISE measurements of ~76,000 Gaia stars. The mean and RMS of the RA and Dec position offset distributions are -0.005±0.163 arcsec and +0.005±0.162 arcsec, respectively.
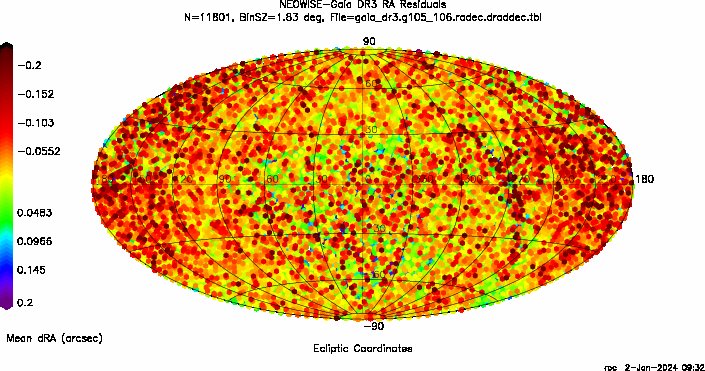
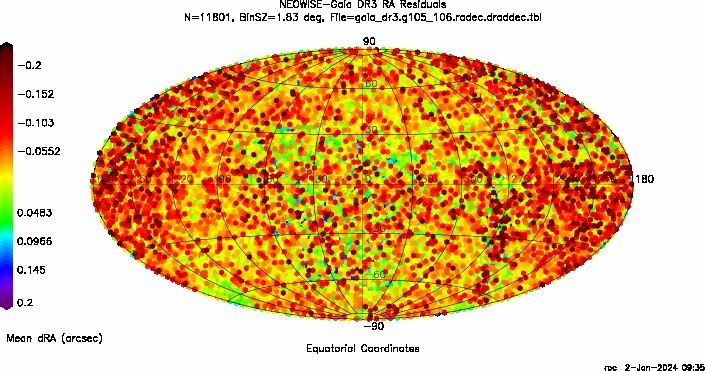
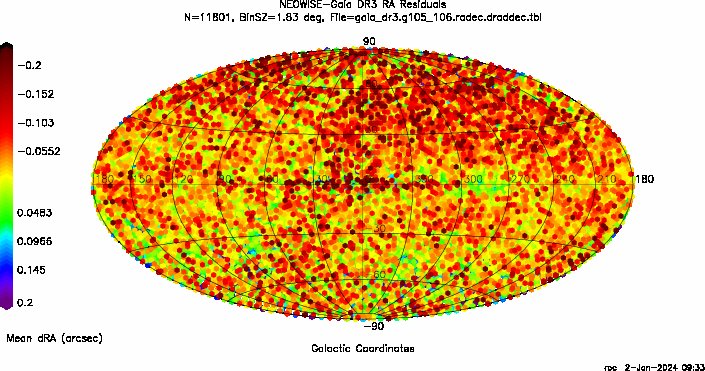
Figures 5a-f show the average NEOWISE-Gaia RA and Dec position offsets in 1.8° spatial bins around the sky in ecliptic, equatorial and galactic coordinate projections. The average position offset in each bin is encoded according to the color keys which are the same in all of the maps. The full range represented in the maps is ±0.2 arcsec, the same as in the histograms in Figure 4. The average RA offsets tend to be small and net negative, while those in Declination are small and net positive, consistent with the distributions shown in Figure 4. The most prominent structures visible in the spatial bias distributions are correlated with the Galactic plane where source confusion degrades NEOWISE source measurements. There is a small, systematic offset in the RA residuals along declination ~+15°. The origin of this feature is unknown.
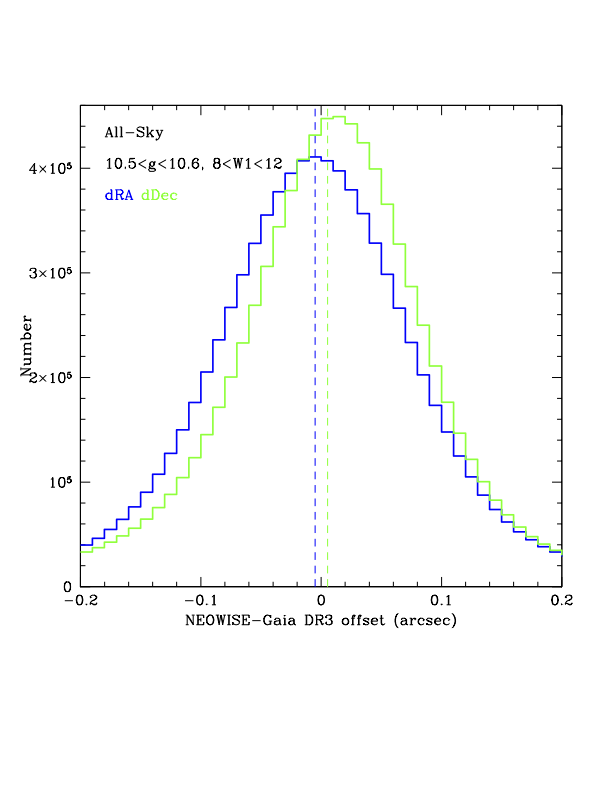 |
| Figure 4 - Histograms of the NEOWISE Single-exposure Source DB RA (blue curve) and Dec (green curve) position differences with respect to bright Gaia DR3 Catalog source positions over the entire sky. The vertical dashed lines indicate the mean values of the respective distributions. |
 |
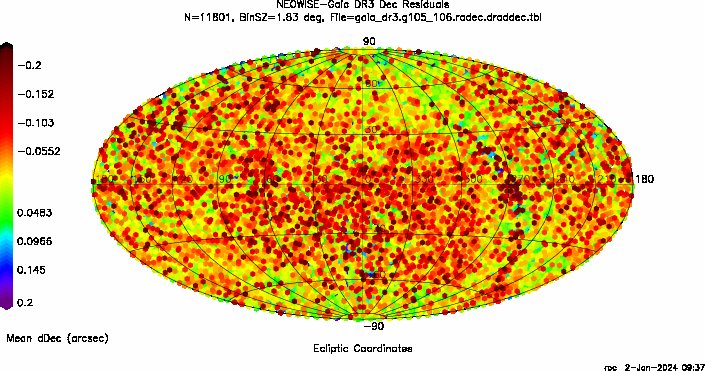 |
| Figure 5a - RA residuals, ecliptic projection | Figure 5b - Dec residuals, ecliptic projection |
 |
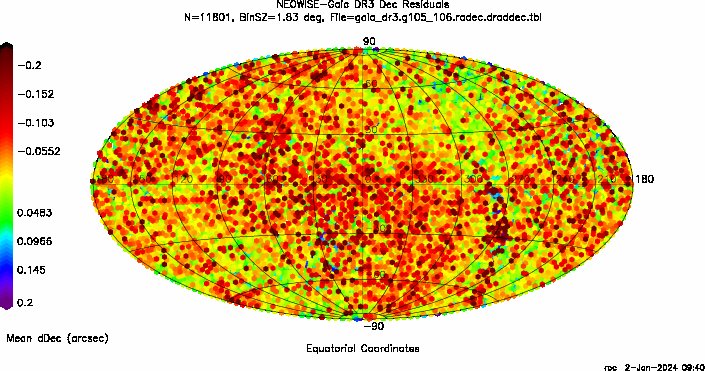 |
| Figure 5c - RA residuals, equatorial projection | Figure 5d - Dec residuals, equatorial projection |
 |
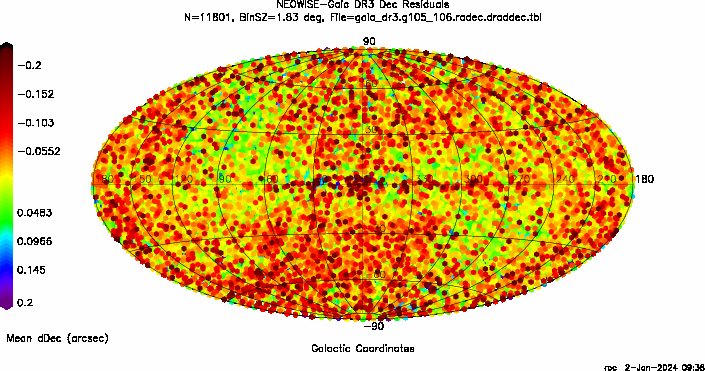 |
| Figure 5e - RA residuals, galactic projection | Figure 5f - Dec residuals, galactic projection |
| Figures 5a-f - Spatial distribution of the average RA (left column) and Declination (right column) residuals between NEOWISE and Gaia DR3 positions for bright stars having 10.5≤Ggaia<10.6 and 8<W1<12 mag. The average position residuals are computed in 1.8° spatial bins, and their values are encoded according to the color keys in the maps; the full range is ±0.2 arcsec in all of the maps. | |
Last Updated: 12 November 2024