- Number of entries from Year 1 observations: 18,468,575,586
- Number of entries from Year 2 observations: 19,691,230,571
- Number of entries from Year 3 observations: 19,631,135,692
- Number of entries from Year 4 observations: 19,098,199,664
- Number of entries from Year 5 observations: 18,795,708,783
- Number of entries from Year 6 observations: 18,717,323,537
- Number of entries from Year 7 observations: 18,784,693,939
- Number of entries from Year 8 observations: 18,670,169,668
- Number of entries from Year 9 observations: 18,651,557,958
- Number of entries from Year 10 observations: 18,371,369,954
- Number of entries from Year 11 observations: 10,882,455,791
The numbers of entries in the NEOWISE Single-exposure Source Database with >2σ profile-fit flux measurements in each of the NEOWISE bands are listed in Table 1. The band-detection combinations in the Database are given in Table 2. The flux measurements of 3.7% of the Database entries are <2σ in both W1 and W2. These are cases where the multiband detection step finds a candidate source, but the profile-fitting extraction process returns very low SNR measurements.
The majority of entries in the Database have detections in the W1 band because that band has the best flux sensitivity and because the spectral energy distributions of most objects on the sky favor detection in that band. However, most inner solar system objects will be significantly brighter in W2 than W1. Typical main-belt asteroids have W1-W2 = 2.5 to 3.0 mag, so they are frequently detected only in W2.
| Band | Number of Entries | Percentage of Total |
|---|---|---|
| W1 | 178,129,196,180 | 89.2 |
| W2 | 110,356,057,043 | 55.2 |
| - (a) | 7,518,073,291 | 3.8 |
| Band-Combination | det_bit | Number | Percentage of Total |
|---|---|---|---|
| W1+W2 | 3 | 96,240,905,371 | 48.2 |
| W2 | 2 | 14,115,151,672 | 7.1 |
| W1 | 1 | 81.888,290,809 | 41.0 |
| - (a) | 0 | 7,518,073,291 | 3.8 |
The NEOWISE Single-exposure Source Database contains all detections made on the successfully processed Single-exposure images that have a combined W1 and W2 signal-to-noise ratio SNR>3. This includes multiple, independent measurements of real astronomical objects, as well as spurious detections of faint noise excursions, artifacts caused by bright sources on and off the Single-exposure image fields, and transient events such as charged particle strikes, satellite trails and intermittent noisy pixels. A small fraction of the Database entries have SNR<2 flux measurements in both W1 and W2 individually, despite having a combined detection SNR>3. Tips for identifying Database entries that have the best chance of being reliable, clean source detections are provided in II.3.
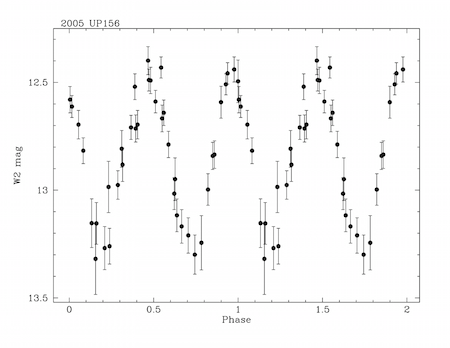
The NEOWISE Source Database is primarily intended to be a resource for obtaining the thermal infrared measurements of solar system objects. Because the Database contains multiple, independent measurements of both solar system and inertial background sources, it is also a powerful resource for time-domain studies such as flux variability and source motion. An example of this is the phase-folded W2 light curve of NEO 2005 UP156 shown in Figure 1 constructed from 40 NEOWISE detections made during the first year of the survey. The NEOWISE phase-folded W1 light curve of W UMa star WISEA J104603.43-534240.7 that was first found in the AllWISE Catalog is shown in Figure 2. This light curve is constructed from 407 NEOWISE detections made during the NEOWISE Reactivation survey.
 |
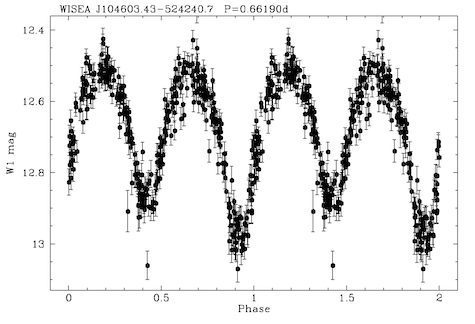 |
| Figure 1 - Phase-folded W2 light curve of NEO 2005 UP156 made using photometry in the NEOWISE Single-exposure Source Database and a period of 40.623 hours. This is slightly longer than the period reported by Warner (2015 Minor Planet Bul. 42, 41). | Figure 2 - Phase-folded W1 light curve of WUMa contact binary star WISEA J104603.43-524240.7 (Cutri et al. 2013) made using photometry in the NEOWISE Single-exposure Source Database and a period of 0.66190 days. |
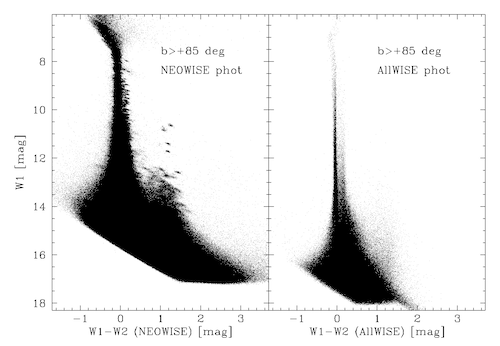
The NEOWISE Single-exposure Source Database contains over 1.5 million confirmed detections of solar system small bodies (see I.3.c). However, the overwhelming majority of the reliable source detections in the NEOWISE Source Database are background stars, galaxies and AGN. Background sources will frequently have counterparts in the AllWISE Source Catalog (see II.1.f.1) which is a much deeper Catalog of stationary (or only very slowly moving) infrared sources generated using the combination of all Single-exposure images from the original 2010-2011 WISE mission. The W1-W2 color-magnitude diagram (CMD) for NEOWISE Source Database entries within 5° of the north Galactic pole that have counterparts in the AllWISE Source Catalog are shown in Figure 3. Milky Way main sequence stars have W1-W2 colors near zero mag, and most galaxies and AGN have colors of 0<W1-W2<2 mag. Main-belt and Near-Earth asteroids generally have W1-W2=2.5 to 3.0 mag. There are 4.39e7 NEOWISE Source Database entries detected in both W1 and W2 in that region that have associated AllWISE Catalog Sources. On the other hand, there are only ~5000 possible solar system object detections in the Source Database in the same region.
As discussed in I.2.b.i, NEOWISE surveyed the inertial sky nearly sixteen complete times during the first ten years of operations. Figures 9 and 10 in I.2.b.i illustrate how the Single-exposure depth-of-coverage increases gradually towards the ecliptic poles because of the converging NEOWISE scan paths. Therefore, objects brighter than the Single-exposure detection completeness level will generally have multiple, independent measurements in the Single-exposure Source Database grouped into separate observation epochs separated by six months.
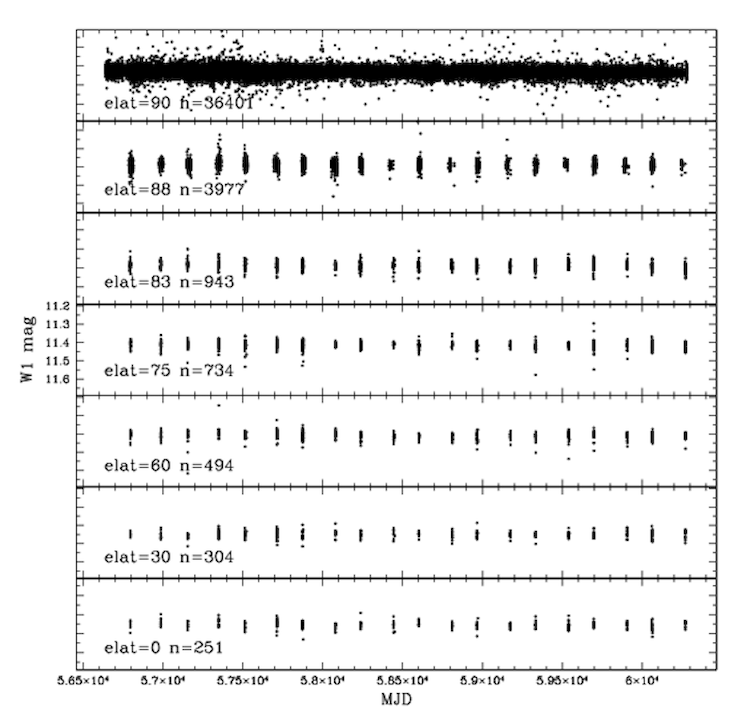
W1 light curves for seven sources, all with 11.1<W1<11.4 mag, at ecliptic latitudes ranging from 0° to 90° are shown in Figure 4. The latitude and number of Source Database entries available for each star are labeled in each panel of the Figure. Objects near the ecliptic plane have sixteen separate epochs of 11 to 13 observations. The number of samples in each epoch increases with increasing latitude, then increases dramatically within a degree of the ecliptic poles. Within approximately 20 arcmin of the poles, the coverage is continuous except for the 19-day survey interruption in April 2014, and during the other shorter gaps that are described in I.2.c.
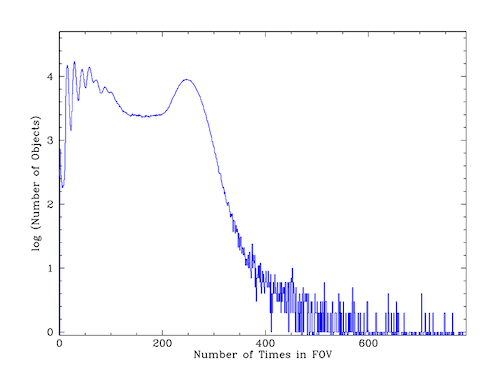
Solar system objects are also usually observed multiple times by NEOWISE, but the exact number of detections depends on the object's orbital motion relative to the NEOWISE scanning, the relative heliocentric and topocentric distances during different observation epochs, as well as the ecliptic latitude. The frequency distribution of the number of times known solar system objects were observed (but not necessarily detected) during the first ten years of the NEOWISE survey is shown in Figure 5. There are peaks in the distribution corresponding to multiples of the number of observations during individual sky coverage epochs. The most prominent peak is near 260 observations because most MBAs dominate the number of solar system object observations, and they are observed during virtually every coverage epoch.
Many solar system objects were observed slightly more than the number of times a stationary point on the ecliptic was observed because most main-belt objects move in phase with the NEOWISE scan advancement. Objects that are moving in phase with the NEOWISE scan advancement, such as NEOs, or that are at high ecliptic latitude and have slow angular motions may have been observed many more times. For example, the position of comet C/1997 J2 (Meunier-Dupouy) was observed 5328 times during the Reactivation mission, but was never detected because it was always greater than 33 AU from the Earth. The position of NEO 2014 BG60 (a NEOWISE discovery) was observed 729 times and the asteroid was detected 314 times during the Reactivation mission and NEO 2005 GH has been observed 302 times and detected 252 times. NEO 1943 Anteros was detected 373 times during NEOWISE Reactivation, the most times of any asteroid.


