


All magnitudes listed in the WISE Post-Cryo Single-Exposure Source Database have been photometrically calibrated in the same manner as the All-Sky Release as described in section IV.4.h.ii. Calibration involves adding to the instrumental magnitude a photometric zero point offset that is derived from measurements of a network of calibration stars. Because of the great stability of the WISE payload during the 4-Band Cryogenic survey phase, constant photometric zero points in each band were used to calibrate the instrumental measurements. However, the system throughput changed with time during the Post-Cryo survey phase because of the increasing temperatures. Consequently, the major calibration development for second_pass processing of the Post-Cryo data was the application of time-dependent photometric instrumental zero points that vary in response to the changing detector performance during that phase of the WISE mission. Time-dependent instrumental zero points were also used for calibration of the 3-Band Cryo photometry.
Note that photometric calibration in first-pass processing of the Post-Cryo used constant W1 and W2 instrumental zero point magnitudes. Consequently, the Post-Cryo Preliminary Release calibrations exhibit small, time-dependent biases with respect to the photometry in the All-Sky, 3-Band Cryo and 2013 NEOWISE Post-Cryo releases. See VIII.3.e.iv for details.
The time-dependent Post-Cryo instrumental photometric zero points were derived by comparing the Single-exposure photometry that was calibrated constant instrumental zero points with photometry of the same sources from the WISE All-Sky Catalog. This comparison was made using all non-saturated, high signal-to-noise ratio sources within each frame, and not just the standard stars since all objects are measured during both survey phases. This analysis was performed on a subset of all Post-Cryo scans during the development and testing of WSDS v5. Figures 1 and 2 show the trimmed average W1 and W2 magnitude differences for all sources within the selected scans plotted as a function of time through the Post-Cryo survey phase. The mean offsets between the All-Sky Catalog and Post-Cryo photometry as a function of time were computed by fitting the tests scans points and smoothly interpolating between the gaps. The offsets spanning the full Post-Cryo period are represented by the green lines in Figures 1 and 2.
 |
 |
| Differences between the photometry of the same sources measured in the WISE All-Sky Catalog and the Post-Cryo single-exposures calibrated using constant instrumental zero points, plotted as a function of MJD during the Post-Cryo survey phase. Black crosses are the average photometric residuals for all non-saturated, high signal-to-noise ratio sources within individual scans, red points are the trimmed moving averages over several scans, and the green line is the fit to the photometric offsets. | |
W1 and W2 photometric instrumental zero point values for each individual Post-Cryo survey scan were then computed by applying the offsets shown in Figures 1 and 2 to the constant zero point level used in the calibration testing. The resulting points used for second pass Post-Cryo photometric calibration are plotted as a function of time in Figure 3. The blue horizontal marker shows the constant W1 and W2 instrumental zero points used for the full cryogenic (4-Band) survey phase, and the green lines are the zero point levels at the end of the 3-Band Cryo phase.
 |
| Figure 3 - W1 (top) and W2 (bottom) photometric instrumental zero points plotted as a function of time during the Post-Cryo survey phase. These zero points were used to calibrate Post-Cryo Single-exposure photometry during second-pass processing. The blue and green horizontal markers show the instrumental zero points used for photometric calibration for all full cryogenic (4-Band) data and data at the end of the 3-Band Cryo survey phases, respectively. |
The accuracy of the calibration for the second-pass Post-Cryo processing can be tracked by comparing the calibrated photometry of the W1 and W2 standard stars produced by the pipeline with their "true" expected values. In Figure 4 are shown the differences between the W1 and W2 standard star "truth" magnitudes and the calibrated magnitudes in the Post-Cryo Single-exposure source database for all three survey phases. The running median residual lines shown in Figure 4 illustrate that the time-dependent calibration in the second-pass produces yields <<1% residual systematic offsets, on average.
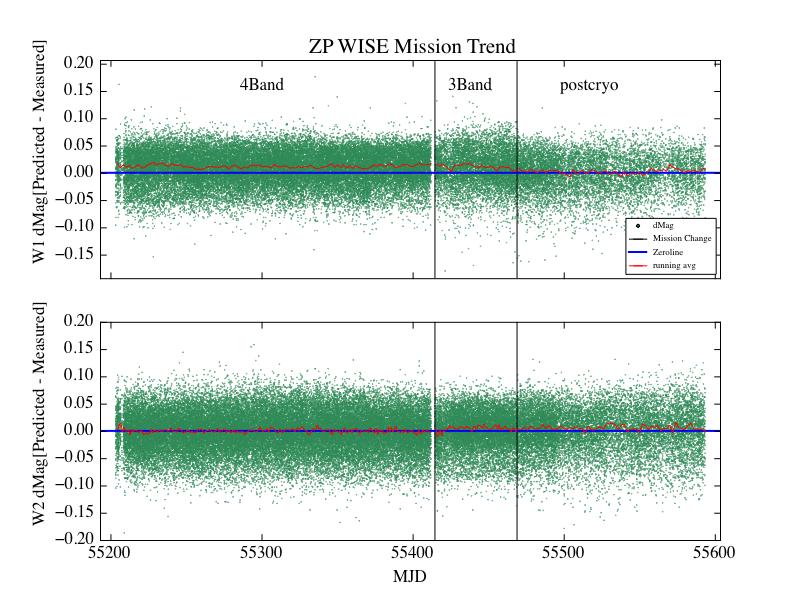 |
| Figure 4 - Differences between the expected (i.e. "true") W1 (top) and W2 (bottom) standard star magnitudes and the calibrated single-exposure measurements during the three WISE survey phases. Small green points represent individual standard star measurements. The solid red line is a running average of the residuals. The vertical lines indicate the boundaries between the survey phases. |
The mean differences between W1 and W2 profile-fit measurements of the same sources within five degrees of the north Galactic pole in the All-Sky Catalog and the 2013 Post-Cryo Release Single-exposure Source Working Database are plotted as a function of Post-Cryo Single-exposure magnitude in Figure 5. The absence of any significant bias in the ranges 8<W1<15 mag and 7<W2<14 mag further demonstrate the accuracy of the photometric calibration during second-pass Post-Cryo processing.
Figure 5 shows that flux measurements of saturated sources in the Post-Cryo Release are systematically brighter than the All-Sky Catalog measurements from the cryogen mission phase. This bias appears at the onset of saturation (W1~8 mag and W2~7 mag), and increases with increasing source brightness, reaching slightly larger than ~1 mag near the practical measurement limit in those two bands. The bias in Post-Cryo measurements is likely caused by changes in the wings of bright sources during the Post-Cryo period. Fluxes for saturated sources are estimated by fitting PSF templates to the non-saturated pixels in the wings of the source profiles. Because the PSFs from the cryogenic survey phase were used for profile-fit photometry of the Post-Cryo data, changes in the actual source profiles can produce significant biases in the resulting flux measurements.
The slight upturn in the W1 and W2 photometric residuals at the faint end in Figure 5 are produced by statistical flux overestimation (i.e. Eddington bias) because the All-Sky Catalog measurements are much more sensitive than the Single-exposure Post-Cryo measurements.
 |
| Figure 5 - The trimmed average differences in 0.25 mag bins between W1 (top panel) and W2 (bottom panel) profile-fit magnitudes of sources within five degrees of the north Galactic pole from the All-Sky Release Catalog and the Post-Cryo Single-exposure Source DB plotted as a function of Single-exposure magnitude. The error bars are the RMS of the trimmed distributions in each magnitude bin. The red horizontal line denotes the zero level. The upturn near W1~8 and W2~7 mag where Post-Cryo measurements become systematically brighter than All-Sky Catalog measurements occurs at the onset of saturation. |
Photometric calibration during first-pass Post-Cryo data processing was performed using constant W1 and W2 instrumental zero points. These zero points are given in Table 1, along with the constant zero points used for calibration in the second-pass processing of the full cryogenic (4-Band) processing that produced the All-Sky Release Catalog.
| Post-Cryo Preliminary Release | W1 | W2 |
| 20.730 | 19.567 | |
| All-Sky Release | W1 | W2 |
| 20.752 | 19.596 |
Because the actual system throughput changed with time during the Post-Cryo period, using constant instrumental zero points in first-pass processing results in time-dependent systematic biases between the photometry in the Post-Cryo Preliminary Release and that in the All-Sky and 3-Band Cryo Releases. These biases, illustrated in the top panels of Figures 6 and 7, show the trimmed average differences between All-Sky Release Catalog and Post-Cryo Preliminary Single-exposure Source Database measurements for all non-saturated, high signal-to-noise ratio sources in each Post-Cryo scan, plotted as a function of time during the Post-Cryo survey phase. The Post-Cryo Preliminary Release W1 photometry is approximately 2.5% brighter than All-Sky Release Catalog W1 photometry at the beginning of the Post-Cryo period, and approximately equal to the All-Sky Catalog by the end of the Post-Cryo survey. The biases in W2 are large, with Post-Cryo Preliminary Release photometry approximately 11% brighter than All-Sky Catalog photometry, decreasing to approximately 6% at the end of the Post-Cryo period.
These biases have been corrected by the use of time-dependent instrumental zero points during second-pass processing of the Post-Cryo data.
The bottom panels in Figures 6 and 7 illustrate the RMS of the residuals in each Post-Cryo scan plotted as a function of time. The abrupt drop in the RMS values occurred because the instrumental calibrations were updated approximately 5 weeks into the Post-Cryo survey during first-pass processing. These updates improved the general photometric measurement accuracy, but did not affect the net zero point offsets which are governed by the instrumental zero points that were not changed.
 |
 |
| (top panels) Trimmed average photometric differences between the same sources from the WISE All-Sky Source Catalog and the NEOWISE Post-Cryo Preliminary Release Single-Exposure Source Database, plotted as a function of time during the Post-Cryo survey phase. (bottom panels) RMS of the photometric differences shown in the top panels. The vertical green line shows the point at which the instrumental calibrations were updated during first-pass Post-Cryo data processing. | |
Last update: 2013 May 17