II. User's Guide to the WISE Preliminary Data Release
2. Source Catalog
The WISE Preliminary Release Source Catalog contains positions and
four-band photometry for 257,310,278 objects detected on the
Atlas Intensity Images. Positions, magnitudes,
astrometric and photometric uncertainties, flags indicating the reliability
and quality of the source characterizations, and associations with the
2MASS Point and
Extended Source Catalog sources are presented for each source.
A summary of the properties of the Source Catalog and a detailed
Catalog format description
are presented below. More detailed descriptions of photometric
and astrometric characteristics of the Catalog are presented in
VI. Descriptions of processing algorithms
used to generate the the Source Catalog can be found in
IV.4.
Users are strongly encouraged to read the
Cautionary Notes before using the Catalog.
b. Source Selection Criteria
The WISE Preliminary Release Source Catalog contains positions and
four-band photometry for 257,310,278 objects extracted from
10,464 Tiles covering approximately 57% of
the sky.
Sources in the Catalog were drawn from a Working Database (WDB) of
all detections made on the coadded Atlas Images that was generated during
Multiframe pipeline processing.
The WDB contains 352,839,115 entries, significantly more than the
Source Catalog. Many WDB entries are spurious detections of noise
and image artifacts. The reliability of the WISE Source Catalog was
achieved by selecting entries in the WDB that satisfy the criteria
that are described in V.3 and summarized in Table 1.
Table 1 - Source Selection Criteria for the Preliminary Release Source Catalog
| Category | Parameter | Criteria | Purpose |
|---|
Detection Reliability:
Extractions must have
a "reliable" detection in at least one band. A reliable band-detection
must satisfy all these criteria in that band. | Signal-to-Noise Ratio (SNR) | Source must be detected with a SNR>7 | Rejection of
spurious detections of low SNR noise excursions. |
| Frame coverage | The source must be measurable
on four or more single-exposure frames. | Rejection of single-exposure
transient events that can persist into the coadded images because
of low coverage. |
| Frame detection fraction | For
sources brighter than
the nominal single-exposure SNR=5 detection limit (W1<15.3, W2<14.4,
W3<10.1 and W4<6.7 mag), it must have been detected at SNR>3
in >40% of the frames available for measurement. | Rejection of
spurious detections of bright single-exposure transients. |
| Artifacts | Extraction must not
be identified as a spurious
detection of an image artifact from a bright source.
Sources believed to be real, but whose measurements are affected by
artifacts, are included in the Catalog, and are flagged using
the cc_flags parameter. |
Rejection of spurious detection of image artifacts. |
| Tile Boundaries | | Extraction lies >50" from
the
edge of the Atlas Tile | To avoid truncation of the largest
measurement aperture used for the source aperture photometry. |
| Duplicate Source Entries | | For multiply-detected
sources in Atlas Tile overlap regions, the apparition farthest from
its respective Tile edge is selected. Sources in the overlap regions
not multiply-detected are always included in the Source Catalog if
they satisfy all other selection criteria. | To eliminate
duplicate extractions of the same source |
c. General Properties
- Total Number of Objects in the Catalog: 257,310,278
- Number of Objects With >2σ Detections in Each Band:
Table 2
| Band | Number of Objects | Percentage of Total |
|---|
| W1 | 257,194,955 | >99.9 |
| W2 | 244,285,878 | 94.9 |
| W3 | 73,187,473 | 28.4 |
| W4 | 18,854,790 | 7.3 |
- Band-Detection Combinations (>2σ per Band)
Table 3
| Band-Combination | det_bit | Number | Percentage of Total |
|---|
| W1-W2-W3-W4 | 15 | 13,357,219 | 5.2 |
| W2-W3-W4 | 14 | 16,205 |
<0.1 |
| W1-W3-W4 | 13 | 95,715 | <0.1 |
| W3-W4 | 12 | 65,143 | <0.1 |
| W1-W2-W4 | 11 | 5,020,804 | 2.0 |
| W2-W4 | 10 | 835 | <0.1 |
| W1-W4 | 9 | 296,798 | 0.1 |
| W4 | 8 | 2,071 | <0.1 |
| W1-W2-W3 | 7 | 58,555,788 | 22.8 |
| W2-W3 | 6 | 5,538 | <0.1 |
| W1-W3 | 5 | 1,071,550 | 0.4 |
| W3 | 4 | 20,315 | <0.1 |
| W1-W2 | 3 | 167,324,273 | 65.0 |
| W2 | 2 | 5,216 | <0.1 |
| W1 | 1 | 11,472,808 | 4.5 |
- Sky Coverage
The approximate sky coverage of the Source Catalog is
23,460 deg2, after taking into account coverage loss
due to poor frame data quality, and frame and pixel outlier rejection
(VI.2).
The Catalog has an additional loss of effective coverage
because Sources were required to fall >50" from Tile edge
during Catalog source selection (V.3).
At the outer boundaries of the Release area where
there are no overlapping Tiles, Catalog sources will not extend
all the way to the unbounded Tile edges.
- Distribution of Catalog Sources with Galactic Latitude
The cumulative number of Preliminary Release Source Catalog entries
and the approximate coverage area as a function of galactic
latitude are listed in Table 5. However, the distribution of sources with
latitude is a complex function of brightness in each band.
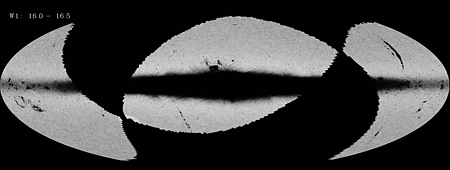
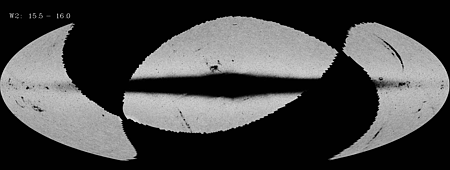
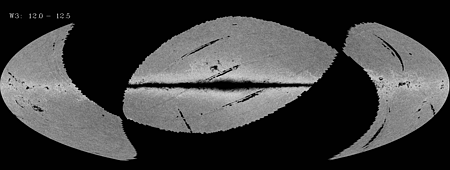
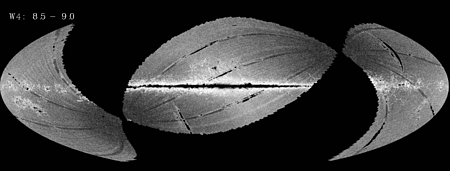
Figures 1-4 are animated GIF images that show the
surface density of sources in 0.5 magnitude bins in progressively fainter
magnitude slices. Completeness in the Galactic Plane begins to fall off
quickly in the short wavelength bands because of confusion in high source
density regions. The distribution of sources at higher Galactic latitudes
remains relative uniform until W1<16.5, W2>16.0, W3>12.5 and
W4>9.0 mag. For fainter magnitudes, the non-uniform depth-of-coverage
in the Survey Strategy begins to dominate the source density distributions.
Table 5 - Cumulative Source Counts
|b| <
(deg) | Number | Percentage of Total | Approx. Area
(deg2) |
| 2° | 14,473,367 | 5.6 | 1053.3 |
5° | 36,315,936 | 14.1 | 2660.8 |
10° | 72,766,813 | 28.3 | 5356.8 |
15° | 108,158,687 | 42.0 | 7969.9 |
20° | 139,438,621 | 54.2 | 10530.0 |
30° | 190,530,346 | 74.0 | 15398.4 |
40° | 226,439,071 | 88.0 | 19403.8 |
50° | 246,197,694 | 95.7 | 21873.0 |
60° | 254,652,111 | 99.0 | 23048.9 |
70° | 257,302,403 | >99.9 | 23457.2 |
80° | 257,310,278 | 100.0 | 23457.2 |
90° | 257,310,278 | 100.0 | 23457.2 |
 |
 |
| Figure 1 - W1: Range = 0-200 |
Figure 2 - W2: Range = 0-190 |
 |
 |
| Figure 3 - W3: Range = 0-130 |
Figure 4 - W4: Range = 0-300 |
| Click on the thumbnails to view animated GIF images
that show Source Catalog surface density maps for each band in 0.5 mag
intervals at progressively fainter levels.
The maps are Hammer projections in galactic coordinates with spatial bin
sizes of 0.2°x0.2° (0.5°x0.5° in W4). The center of the
maps corresponds to galactic coordinates 0°,0°. Galactic north is
towards the top of the maps and galactic longitude increases to the right.
|
- Differential Source Counts
The WISE Source Catalog is >95% complete down to W1=16.6.
W2=16.0, W3=10.8 and W4=6.7 mag in unconfused regions of the
sky with ≥12 frame depth-of-coverage. Completeness
decreases for fainter sources, in lower coverage regions,
and in regions of high source density and/or complex backgrounds.
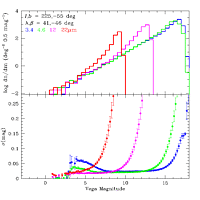
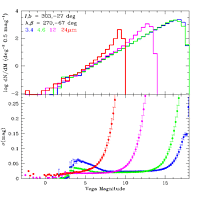
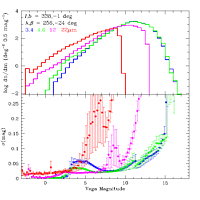
The top panels of Figures 5, 6 and 7 show examples of source count
log histograms in the WISE bands for three representative regions in
the Preliminary Release
Source Catalog. Figures 5 and 6 show mid-galactic latitude fields
with 16 and 24 average frame depth-of-coverage. Figure 7
shows the counts for a field in the Galactic plane with very high
source density. The spatial distribution and variation of
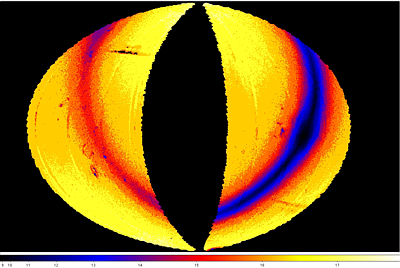
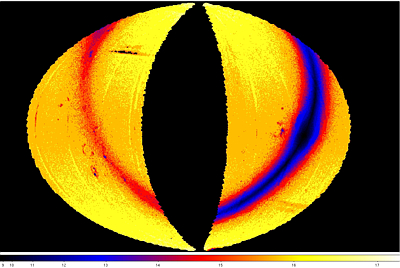
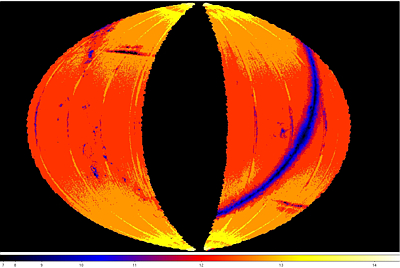
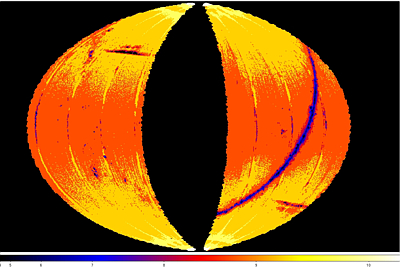
the magnitude at which the peaks of the Catalog source count histograms
occur are shown in Figures 8-11. The impact on the effective depth of
the Catalog by survey depth-of-coverage is easily seen in all bands
by the gradient in depth that increases from the ecliptic plane to
the poles. The loss of depth due to confusion in the Galactic Plane
is most prominent in W1 and W2.
 |
 |
 |
| Figure 5 - (top) Differential WISE Source Catalog counts in a
116 deg2 near l,b=225°,-55° with
average frame depth-of-coverage of ~16. (bottom) Average
photometric uncertainty as a function of source brightness. |
Figure 6 - (top) Differential WISE Source Catalog counts in a
125 deg2 near l,b=303°,-27° with
average frame depth-of-coverage of ~24. (bottom) Average
photometric uncertainty as a function of source brightness. |
Figure 7 - (top) Differential WISE Source Catalog counts in a
116 deg2 near l,b=338°,-1° with
average frame depth-of-coverage of ~16. (bottom) Average
photometric uncertainty as a function of source brightness. |
 |
 |
| Figure 8 - W1 |
Figure 9 - W2 |
 |
 |
| Figure 10 - W3 |
Figure 11 - W4 |
| False-color maps showing the spatial distribution and
variation of the peak of the differential source count histograms computed in
0.2x0.2 deg spatial bins. The color scale in the images gives
the peak magnitude color encoding for each band. The
Maps are Hammer projections in ecliptic coordinates.
The centers correspond to ecliptic coordinate 180°,0°.
Ecliptic north is towards the top, and ecliptic longitude increases
towards the right. |
- Saturation and Bright Source Detection Limits
Listed in Table 6 are the approximate magnitudes for which
point sources began to saturate the WISE detectors.
Photometry is performed for sources brighter than the saturation limits
by PSF fitting to the non-saturated
wings of the source profiles. The quality of the photometry for
saturated sources is progressively degraded. Brighter than the extraction
limit levels given in Table 6, saturation sources could no longer
be reliably extracted and may be missing from the Catalog.
Table 6 - Point Source Saturation and Bright Source Extraction Limits
| Band | Saturation Limit1
(mag) | Extraction Limit2
(mag) |
|---|
| W1 | 8.0 | 1.0 |
|---|
| W2 | 6.7 | 0.0 |
|---|
| W3 | 3.8 | -2.0 |
|---|
| W4 | -0.4 | -6.0 |
|---|
Notes:
1 Approximate values. Onset of saturation can vary by ~1mag depending on BG and sub-pixel location (see VI.4.d)
2 Approximate values. Accuracy of photometry for heavily saturated sources may be poor (see VI.4.c.i)
|
d. Photometric Properties
- Photometric Accuracy and Sensitivity
Photometry of bright, non-saturated sources in the Preliminary Release
Source Catalog has an accuracy of ~2% in W1, W2 and W3, and ~3% in W4
(VI.4.b).
The photometric SNR >5 for sources with W1<17.0, W2< 15.6,
W3<11.5 and W4<7.9 mag in the unconfused regions of the sky
with at least 8 independent coverages. The characteristic sensitivity
of the Source Catalog varies significantly around the sky because
of the variable depth-of-coverage, background emission levels and
source confusion.
The bottom panels of Figures 5, 6 and 7 show the average quoted
W1, W2, W3 and W4 profile-fitting photometric uncertainties in 0.2 magnitude
bins for three representative regions in the Catalog. The vertical
bars show the RMS dispersion in the mean uncertainties in each brightness.
Photometric uncertainties increase at the bright end due to the onset of
saturation. Uncertainties also increase towards fainter flux
levels as photon noise increasingly dominates the measurements.
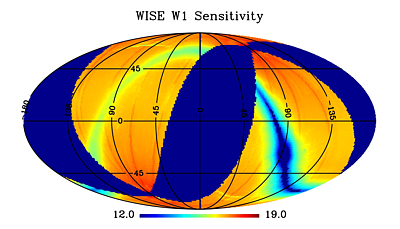
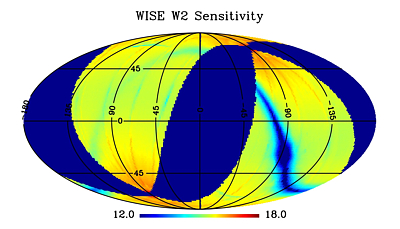
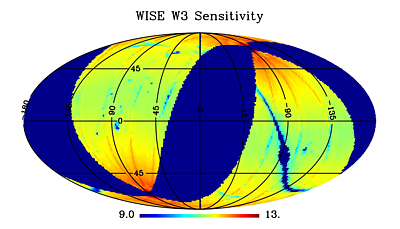
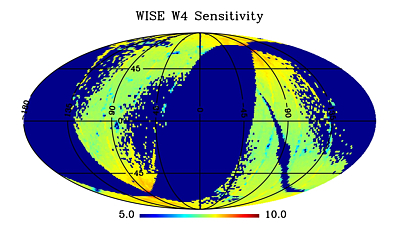
Figures 12-15 show the spatial distribution of the average
magnitudes within each Atlas Tile for which the mean measurement uncertainty
is 0.155 mag, corresponding to 7σ
(see VI.4.a).
 |
 |
| Figure 12 - W1 | Figure 13 - W2 |
 |
 |
| Figure 14 - W3 | Figure 15 - W4 |
| Equatorial projection sky maps showing the spatial
variation of average magnitude at which the average source SNR=7
in the Preliminary Release Source Catalog (see VI.4.a) |
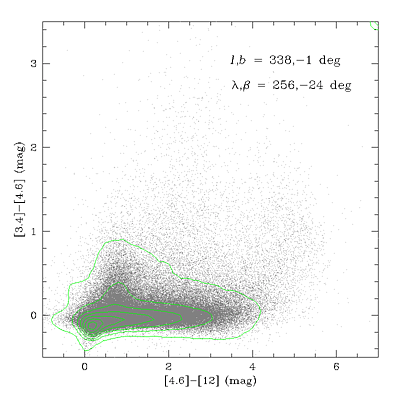
- Band-Band Photometric Performance
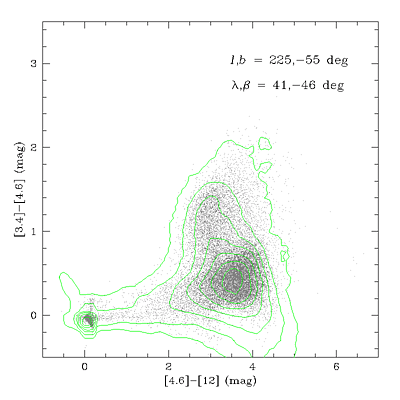
W1-W2-W3 (3.4-4.6-12 μm) color-color diagrams drawn from high and low
galactic latitude regions in the Preliminary Data Release Source Catalog
are shown in Figures 16 and 17, respectively.
The locations in color-space for various classes of astrophysical
objects are shown in the annotated
version of Figure 16.
 |
 |
| Figure 16 - WISE 3.4-4.6-12 μm color-color diagram for a
116 deg2 region at l,b=225°,-55°. Green
contours trace the density of sources in color bins. Click
here for an
annotated version of the color-color diagram showing the location
of different classes of objects.
|
Figure 17 - WISE 3.4-4.6-12 μm color-color diagram for a
116 deg2 region at l,b=338°,-1°. Green
contours trace the density of sources in color bins. |
e. Astrometric Properties
WISE Source Catalog positions are reconstructed with respect to the
2MASS
Point Source Catalog reference frame. The accuracy of the
astrometric solution for the sources brighter than W1~13.0 mag
is better than is 0.2 arcsec (see Figure 1 in VI.5).
Approximately 25% of the source fainter
than W1~14.5 mag have declinations coordinates that can be systematically
offset from their true positions by 0.2" to 1."
This bias can be seen in a decreasing fraction of sources as bright as
13.0 mag, and the sign of the offset alternates with scan direction
and equatorial.
The bias was caused by an identified source extraction software error
that failed to apply a 0.5 Atlas Image pixel declination offset to
some sources when performing simultaneous
PSF-fitting with other
detections in close proximity (i.e. passive deblending).
The error does not affect right ascension measurements. See
VI.5 for illustrations and further descriptions
of the impact of this error.
There was insufficient time to correct this bias prior to
the Preliminary Data Release. Therefore, the quoted declination
uncertainties in the Source Catalog,
sigdec, have been inflated
to reflect the presence of the bias. The uncertainties were
adjusted by adding 0.5" in quadrature to the statistical
declination measurement uncertainty
(see VI.5.b). This yields a maximum
absolute deviation for the distribution of uncertainties equal to the
what would be produced if the declination error distribution was Gaussian.
Last Updated: 2011 December 28
Previous page Next page
Return to Explanatory Supplement TOC


