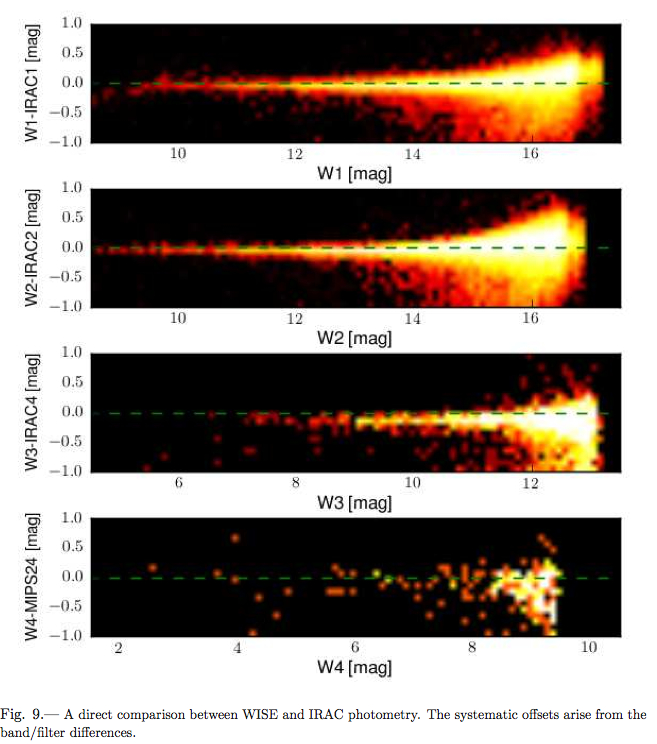
Figure 2 shows a direct comparison between WISE profile-fit photometry and Spitzer profile-fit photometry for the ecliptic poles (Jarrett et al. 2011). Both data sets have a similar photometric depth and sensitivity. For the short-wavelength bands of WISE, which closely match those of IRAC, the agreement is very good, within 2 to 3%, while for the longer wavelength bands where the filter response is significantly different (e.g., 12 µm versus 8 µm), there is a 15% offset in the sense that W3 and W4 are brighter than IRAC-4 and MIPS-24, respectively. These differences are consistent with the respective relative system response curves (RSRs) and the mid-IR Rayleigh-Jeans spectral characteristics for most field stars along the line of sight. However, at the faint end, W1 and W2 > 15 mag, departures arise due to flux biases associated with low S/N detection thresholding and source blending/confusion. That is, the WISE photometry is systematically brighter than the corresponding IRAC and MIPS-24 photometry due to the larger beam of WISE (6 vs 2 arcsec) making it more susceptible to source crowding and confusion noise.
|
|
| Figure 1 - WISE photometry of sources in the CDF-S. The Y-axis for each panel corresponds to the difference between the WPRO and WAPPco measurements. | Figure 2 - A direct comparison between WISE and IRAC photometry for the Ecliptic Poles. The systematic offsets arise from the band/filter differences. (Jarrett et al. 2011) |
Figure 3 illustrates the adverse effects of source confusion on the photometric integrity. At a galactic longitude of ~300 deg, the source confusion and extinction is appreciable near the Galactic Plane. The figure shows the W1-Ks color as a function of galactic latitude; for comparison, the expected reddening due to Galactic extinction is overplotted (red circles). The W1-Ks color shows a clear trend with reddening, but with significant departures that are likely due to problems with the WISE photometry. Discontinuities are seen between -5 and -2 degrees in latitude, the color is too red -- likely due to flux-overestimation in the W1 photometry arising from source crowding and confusion noise that strikes WISE before 2MASS (6 versus 2.5 arcsec beam).
 |
| Figure 3 - WISE W1 compared to 2MASS K-band for sources near the Galactic Plane. The expected Galactic reddening (red circles) is derived from the Galactic extinction inferred from dust emission in the far-IR (e.g., Schlegel et al 1998). |
In the case of bright, saturated stars, the profile-fitting photometry algorithm is designed to produce a flux estimate using the unsaturated pixels around the periphery. Photometric biases are nevertheless apparent, especially in W2 and to a lesser extent, W1. Figure 4 illustrates this behavior using plots of Ks-WISE as a function of magnitude for all four WISE bands, from the results of Scan/Frame Pipeline processing.
 |
 |
 |
 |
| Figure 4 - Photometric bias in saturated regime, illustrated by 2MASS-WISE colors | |||
In W1, there is relatively little bias for about 4 magnitudes beyond saturation, after which the flux becomes systematically underestimated. For W2, however, a pronounced flux-over estimation bias starts immediately upon saturation (6.5 mag) and continues to about 3.5 mag at which point it reverses sign and behaves similarly to W1. We have investigated these biases and have ruled out such effects as nonlinearity and errors in sky background estimation. We have, however, found that the PSF shape is flux-dependent in the saturated regime, and attribute the bright star flux biases to that effect. The reason for the flux-dependence of PSF shape and, in particular, why it should be so much more pronounced for W2, are not known.
The WISE system photometric response was stable to <<1% over the life of the cryogenic survey (IV.3.g). Therefore, standard star calibrators provided the necessary information to anchor the zero point calibration. For first-pass processing, these zero points were defined using the first two months of on-orbit data.
Residuals biases with respect to the mean brightness of the standard stars is <0.01 magnitudes in W1, W2 and W4 in the Source Catalog. For W3, however, there is a mean offset bias of approximately 0.022 magnitudes in the sense that the Catalog W3 magnitudes may be on average 0.022 mags fainter than their quoted values. Additional information regarding uncertainties in the calibration measurements is discussed in IV.3.g.vii.
Discussed in Wright et al. (2010), there is a clear discrepancy between red (typically sources with fν ~ ν-2) and blue (stars with fν ~ ν2) calibrators in W3 and W4, the 12 and 22µm bands. This amounts to about -17% and 9% in the fluxes for W3 and W4, with the red sources appearing too bright in W4 and too faint in W3.
Wright et al. (2010) goes on to say: "The flux differences could be resolved by adjusting the effective wavelength of W3 and W4 3%-5% blueward and 2%-3% redward, respectively. This would change the zero magnitude by about -8% in W3 and +4% in W4. But the zeropoints and isophotal wavelengths reported here are based on the relative spectral responses derived from ground calibration without any such adjustment. The instrumental zeropoints that define the conversion from counts to magnitudes have been based on standard stars, which are the blue calibrators. Given the discrepancy between red and blue calibrators we estimate that the conversion from magnitudes to Janskys are currently uncertain by ±10% in W3 and W4."
 |
| Figure 5 - W4 calibration diagram showing the measured versus predicted values for stars (shown with black points and errorbars), Sy-2 galaxy (NGC 6552) and ultra-luminous infrared galaxies (ULIRGs, shown in red). There is a clear offset, ~10%, between the stars (which are relatively blue in color) and the galaxies (red). |
Last update: 2011 April 26