 |
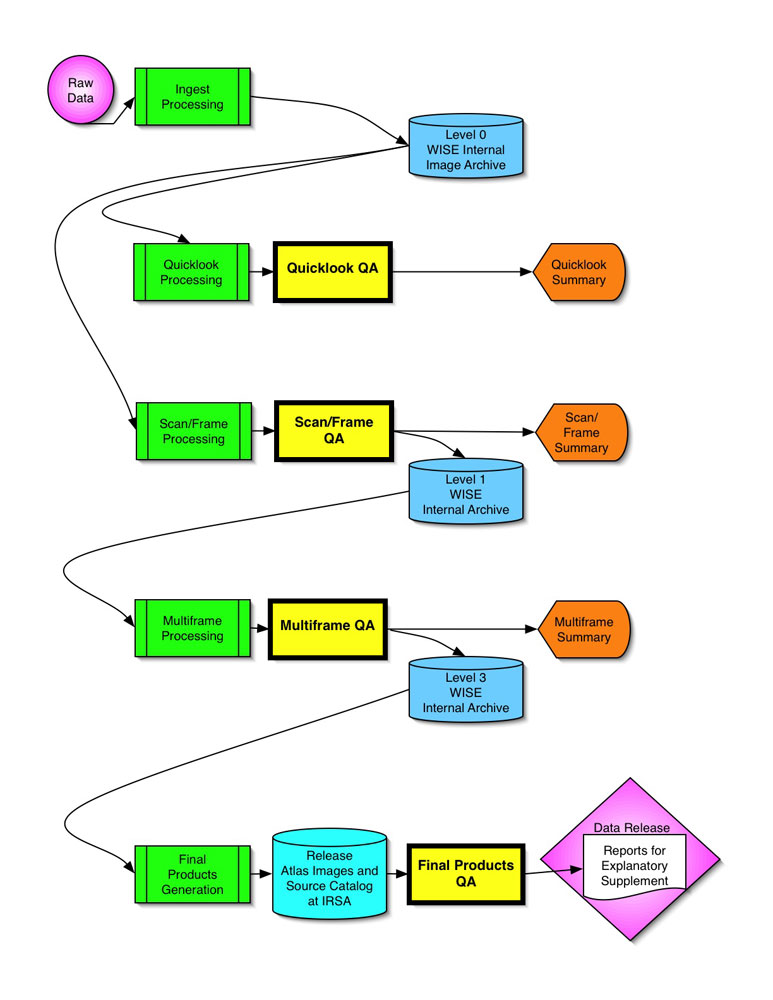
| Figure 1 - Data flow diagram with each QA subsystem (Quicklook QA, ScanFrame QA, Multiframe QA, and Final Products QA) highlighted in yellow. |
The objective of science data quality assurance was to assess data through each stage of processing -- to identify and flag the (small amount of) data that did not meet WISE science requirements while verifying that the remainder were sound. Quality assurance (QA) was performed on the images and source lists from each frameset (a simultaneous group of frames in all four bands) with the purpose of informing Atlas image generation of the poor-quality frames it should omit from coaddition. Quality assurance was also performed on the Atlas images and source lists to ensure that they also met project requirements. Quality scores can be used by the scientific community to help characterize data products contained in the Preliminary Data Release.
The QA system was highly automated. This level of automation was vital so that the final arbiter of quality - the WISE QA scientist reviewing the data - could quickly assess and bless those data meeting project specifications, while spending most of his/her time on the small fraction of data most needing detailed scrutiny. The QA system collected summary reports from all of the data processing subsystems and compiled them into a single concise report to be reviewed by the QA scientist. These summaries consisted of software completion status reports, statistical analyses, and other tabular and graphical material on which data quality could be judged. The QA system collected parameters, compared them to concise metrics, and presented the results in a web-based interface. This interface was used by the QA scientists to efficiently analyze and troubleshoot issues.
An overview of the various steps in QA are given below, along with more details on the individual QA checks performed on the data.
WISE data passed through several different processing stages and quality assurance was performed as an integral part of these. The flow diagram of Figure 1 demonstrates how the QA subsystems interacted with the rest of the data pipeline.
The data flow diagram of Figure 1 pertains to data processing during on-orbit operations ("first-pass" processing). First-pass processing produced the images and source lists contained in the Preliminary Data Release. Knowledge gleaned from first-pass processing will be used to refine the QA algorithms used in "second-pass" processing. Second-pass processing begins at the Level 0 Archive, skipping only the Quicklook Processing and Quicklook QA steps. The goal of second-pass processing is to produce the images and source lists contained in the Final Data Release.
|
| Figure 1 - Data flow diagram with each QA subsystem (Quicklook QA, ScanFrame QA, Multiframe QA, and Final Products QA) highlighted in yellow. |
The purpose of each QA subsystem is listed below along with the timescale on which the QA was performed and the actions resulting from each QA assessment.
The purpose of this step was to check key system performance parameters for each downlink via an abbreviated processing pipeline that processed roughly only 6% of the data. This included monitoring of scan synchronization, system throughput, and image backgrounds and noise. This check was completed within 24 hours of receipt of data at IPAC, so that any discovered problems could be addressed rapidly by the WISE project.
The purpose of this step was to compare achieved performance to metrics tied to mission science requirements and otherwise scrutinize output of the processing pipeline. This check was to be completed within six days of receipt of data at IPAC in order to flag any problems not discovered during the Quicklook QA step. Automated ScanFrame QA reports were usually generated much more quickly than this, typically within 24 hours. Using these reports, the QA scientist assessed the quality of the data, followed up anomalies or problems, and did random spot checking to assign quality scores to each scan and each frameset.
As with ScanFrame QA, the purpose of this step was to compare achieved performance to metrics tied to mission science requirements and otherwise scrutinize output of the processing pipeline. QA scientists assigned quality scores to each data set created in support of the Preliminary Data Release.
The purpose of this step was to assess properties of the images and source lists relative to mission requirements, to check the integrity of the products via range checking on all parameters, and to give an overall characterization of the public data products. The output of this step, which involves the WISE team at IPAC as well as the WISE Science Team and internal collaborators, is summarized under section VI, "Analysis of Release Products", in the Table of Contents.
Each component of the QA subsystem encompassed a number of individual tests. Grades were calculated from several factors, as described below. Allowable values of the factors are 0.0, 0.5, and 1.0. For any quality factor that could not be computed due to lack of data (such as the quality of photometric stability, which could not be measured for scans lacking ecliptic polar fields), the factor was assumed to be 1.0.
Quicklook QA was essentially the same as ScanFrame QA except that only 3% of each data delivery were required to be (and generally 6% were actually) run through the processing pipeline. This step is not discussed further here, as the reader is referred to the ScanFrame section below on details of the QA checks that were made.
Both the scan-level and frame-level scores can be found in the "WISE Preliminary Release Level 1b Frame Metadata Table" available through the Gator service at IRSA. Scan-level score factors qs1, qs5, and qp are listed there as qs1_fact, qs5_fact, and qp_fact, respectively; the overall scan grade, SQ, is presented in the qual_scan column. Frame-level score factors qc, qi, and qn are listed as qc_fact, qi_fact, and qn_fact, with the overall frame score, FQ, as qual_frame. Users may examine these columns should a question arise regarding the quality of a particular set of data.
Multiframe scores can be found in the "WISE Preliminary Release Atlas Metadata Table" available through the Gator service at IRSA. Score factors qc, qi, and qa are listed there as qc_fact, qi_fact, and qa_fact. All Atlas image data in the Preliminary Data Release have perfect scores, so all of these factors are listed as 1.