


Imaging data from all WISE survey phases were combined during AllWISE data processing. However, not all of the Single-exposures taken during the mission were used. This section describes which Single-exposures in which bands were used in to generate the AllWISE data products, and how they were selected.
WISE collected a total of 2,785,836 Single-exposure framesets during its 390 days of surveying. 1,491,686 W1, W2, W3 and W4 Single-exposures were acquired during the 4-Band Cryo phase between 7 January and 6 August 2010, 392,879 W1, W2 and W3 Single-exposures were acquired during the 3-Band Cryo phase between 6 August and 29 September 2010, and 901,271 W1 and W2 Single-exposures were acquired during the Post-Cryo phase between 29 September 2010 and 1 February 2011. The total numbers of Single-exposure frames in each band collected by WISE are listed in Table 1.
AllWISE uses the W1 and W2 Single-exposure frames from all survey phases. Sensitivity in those bands remained close to that during the 4-Band Cryo, with only slight degradation because of increasing numbers of noisy pixels.
W3 and W4 Single-exposure frames from the 4-Band Cryo phase only were used during AllWISE processing. Useful W4 frames were acquired only during the 4-Band Cryo phase. Although W3 frames were acquired during the 3-Band Cryo phase, the W3 sensitivity was greatly reduced because of rising temperatures and the exposure time reductions needed to avoid saturating on the increasing thermal background emission. The reduced sensitivity along with the rapidly changing and sometimes poorly tracked instrumental calibrations mean that including the 3-Band Cryo W3 frames would not add substantively to the sensitivity in that band for AllWISE. Additional time-history of W3 fluxes measured during the 3-Band Cryo phase is limited to only bright objects, and that information can be obtained in the 3-Band Cryo Single-exposure Source Database.
Framesets, and in some cases individual band-frames were used for in AllWISE Multiframe Pipeline processing only if they satisfied minimum quality requirements. Frameset exclusion was done both as through static filtering of the inputs to the Multiframe Pipeline, and dynamic filtering in the image coaddition process.
Framesets and/or band-frames were omitted from Multiframe Pipeline (i.e. static filtering) in the following cases:
Dynamic frame rejection was carried out in the image coaddition subsystem (V.3.ai) during Multiframe processing. This filtering identified and excluded image frames that contain a large number of aberrant pixels as tagged in the Single-exposure Bit Masks. Frames were rejected if they are heavily contaminated by scattered moonlight, large numbers of saturated pixels, or large numbers of glitches and cosmic rays. As described in VI.3.a.iii.2filtering of framesets affected by scattered moonlight was made more aggressive for AllWISE.
In addition to the frameset and frame-level filtering, pixel-level outlier rejection was performed during the Multiframe pipeline coaddition process. Pixel outlier rejection affects the coverage on smaller scales in the resulting Atlas Images that can be tracked by their corresponding Depth-of-Coverage Maps. The coverage that was available for the measurement of each Catalog source are tabulated in the Catalog w1m, w2m, w3m and w4m and w1cov, w2cov, w3cov, w4cov columns. A detailed discussion of AllWISE sky coverage is given in IV.2.
The total number of frames in each band after all static and dynamic filtering that contributed to the full set of coadded AllWISE Atlas Images and Catalog source extractions is listed in Table 1.
| Band | Frames Acquired | Frames Used |
|---|---|---|
| W1 | 2,785,836 | 2,609,135 |
| W2 | 2,785,836 | 2,583,986 |
| W3 | 1,884,565 | 1,347,828 |
| W4 | 1,491,686 | 1,353,656 |
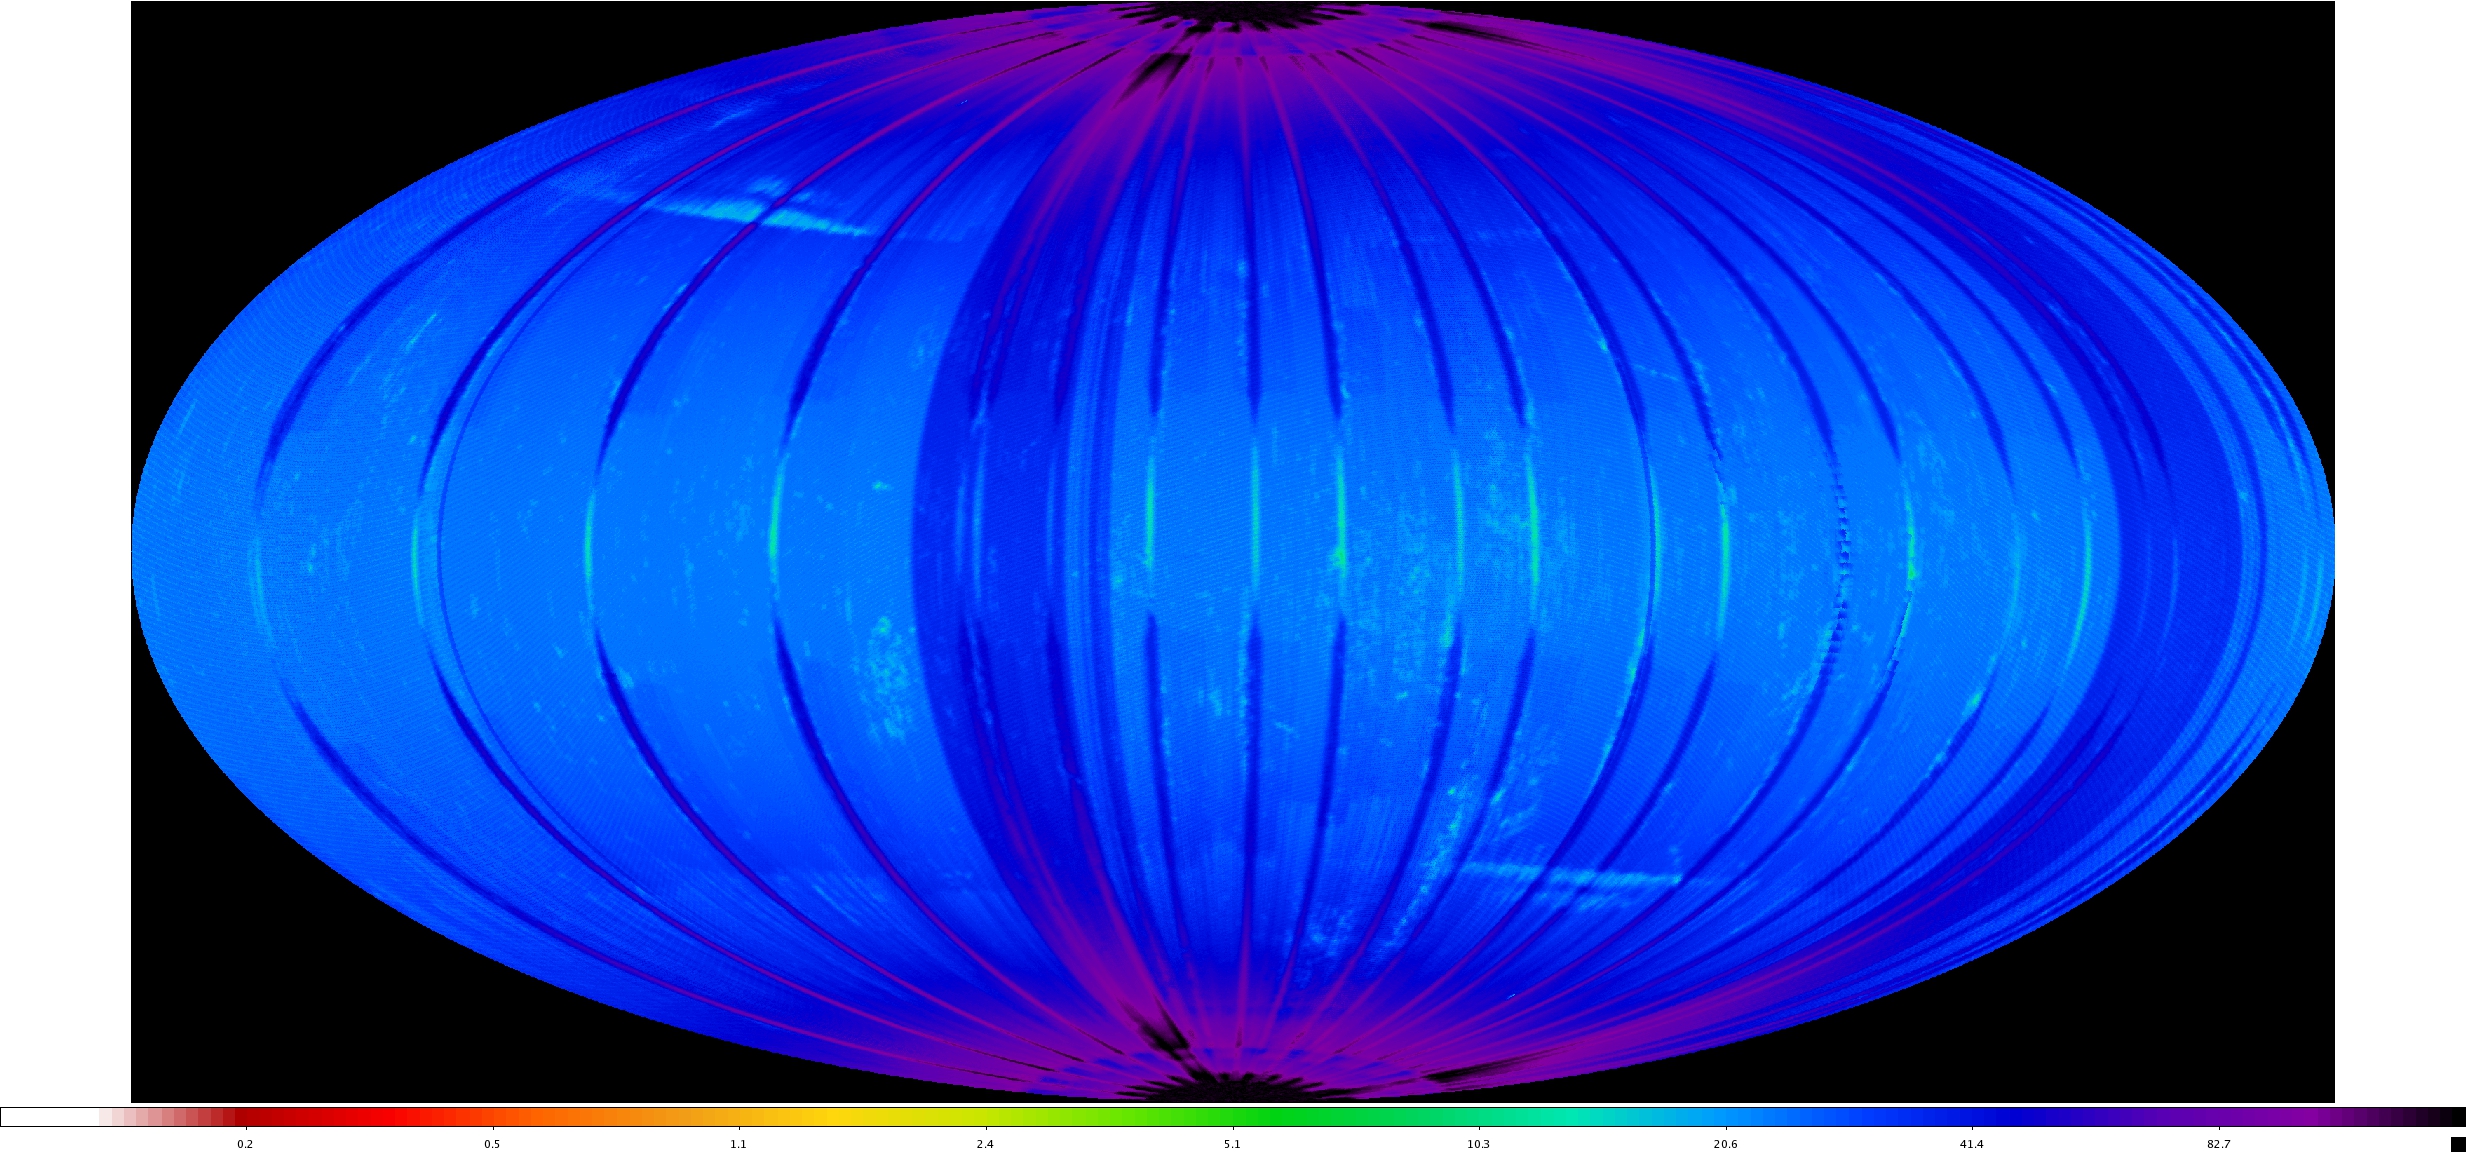
The achieved AllWISE depth-of-coverage after static and dynamic frame filtering and pixel-level outlier rejection in the Multiframe processing is shown in Figures 1-4. The coverage in W1 and W2 is typically a factor of two larger than in W3 and W4 except in the band that was surveyed twice during the 4-Band Cryo phase, and a third time during the 3-Band Cryo, where the increase is a fact of 1.5. The added W1 and W2 depth in AllWISE fills in the horizontal bands of low coverage near λ,β= 100°,+45° and 290°,-45° caused by the magnetic torque rod momentum dumping at the same location on every orbit early in the WISE survey. The inclusion of the second epoch W1 and W2 data also helps mitigate the low coverage due to scattered moonlight near the ecliptic plane. The low coverage regions remain in W3 and W4 because only 4-Band Cryo data were utilized in those bands.
Framesets that contribute to each Atlas Image are tracked in the AllWISE Atlas Frame Cross-Reference Table. This table contains a listing of frameset identifiers that correspond to each Atlas Tile in each band. This table can be used to determine which framesets were used to construct a particular Atlas Image, or to determine to which Atlas Images a particular frameset or frame contributed.
 |
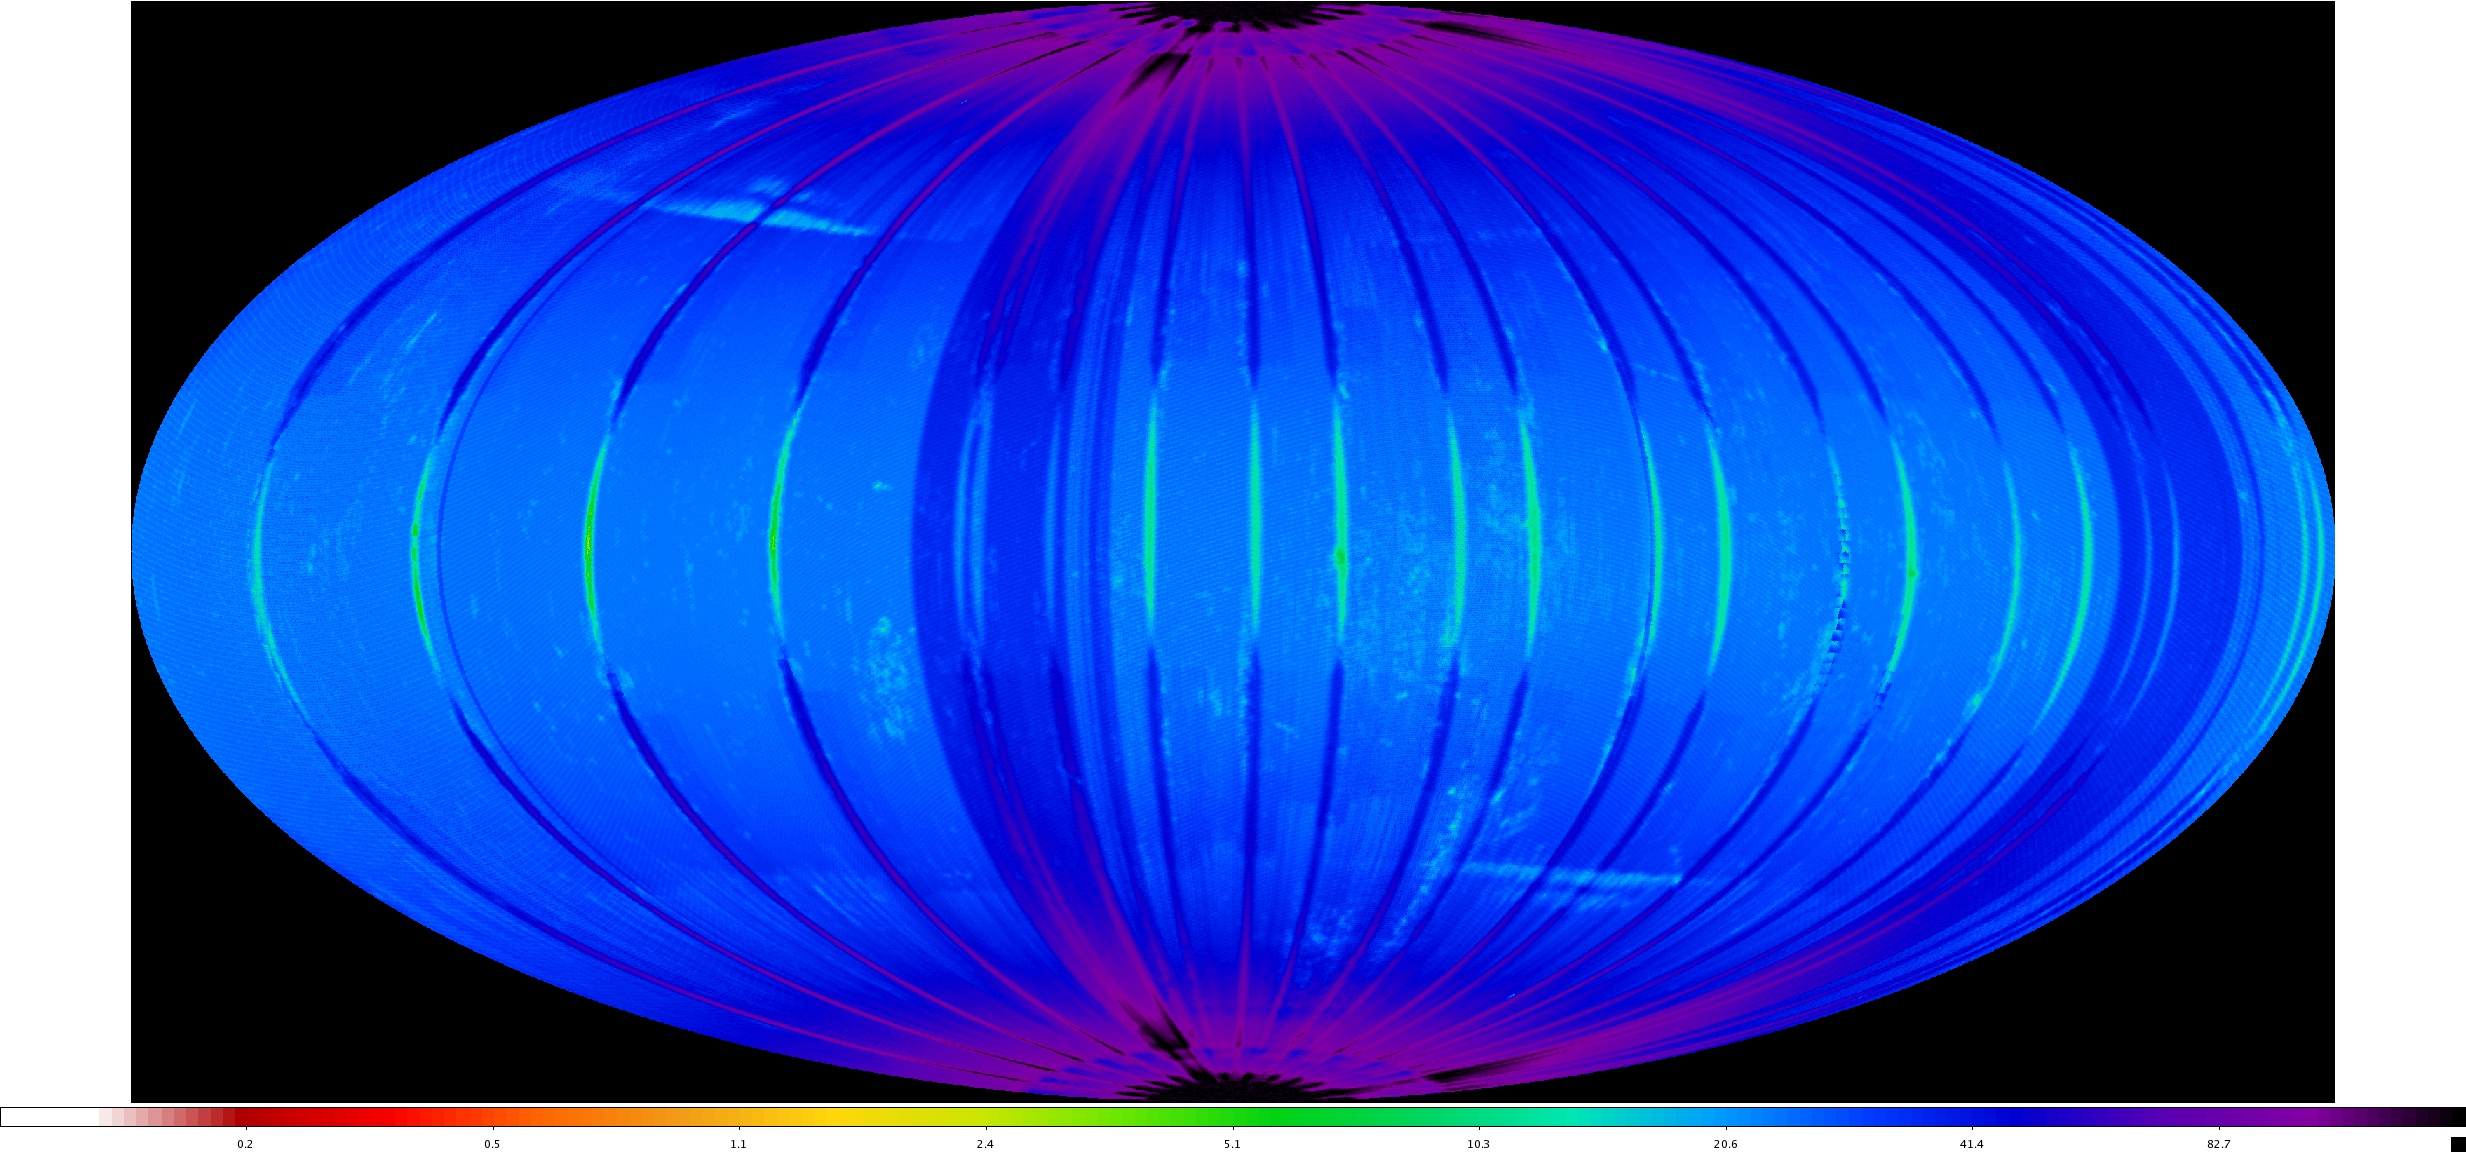 |
| Figure 1 - W1 | Figure 2 - W2 |
 |
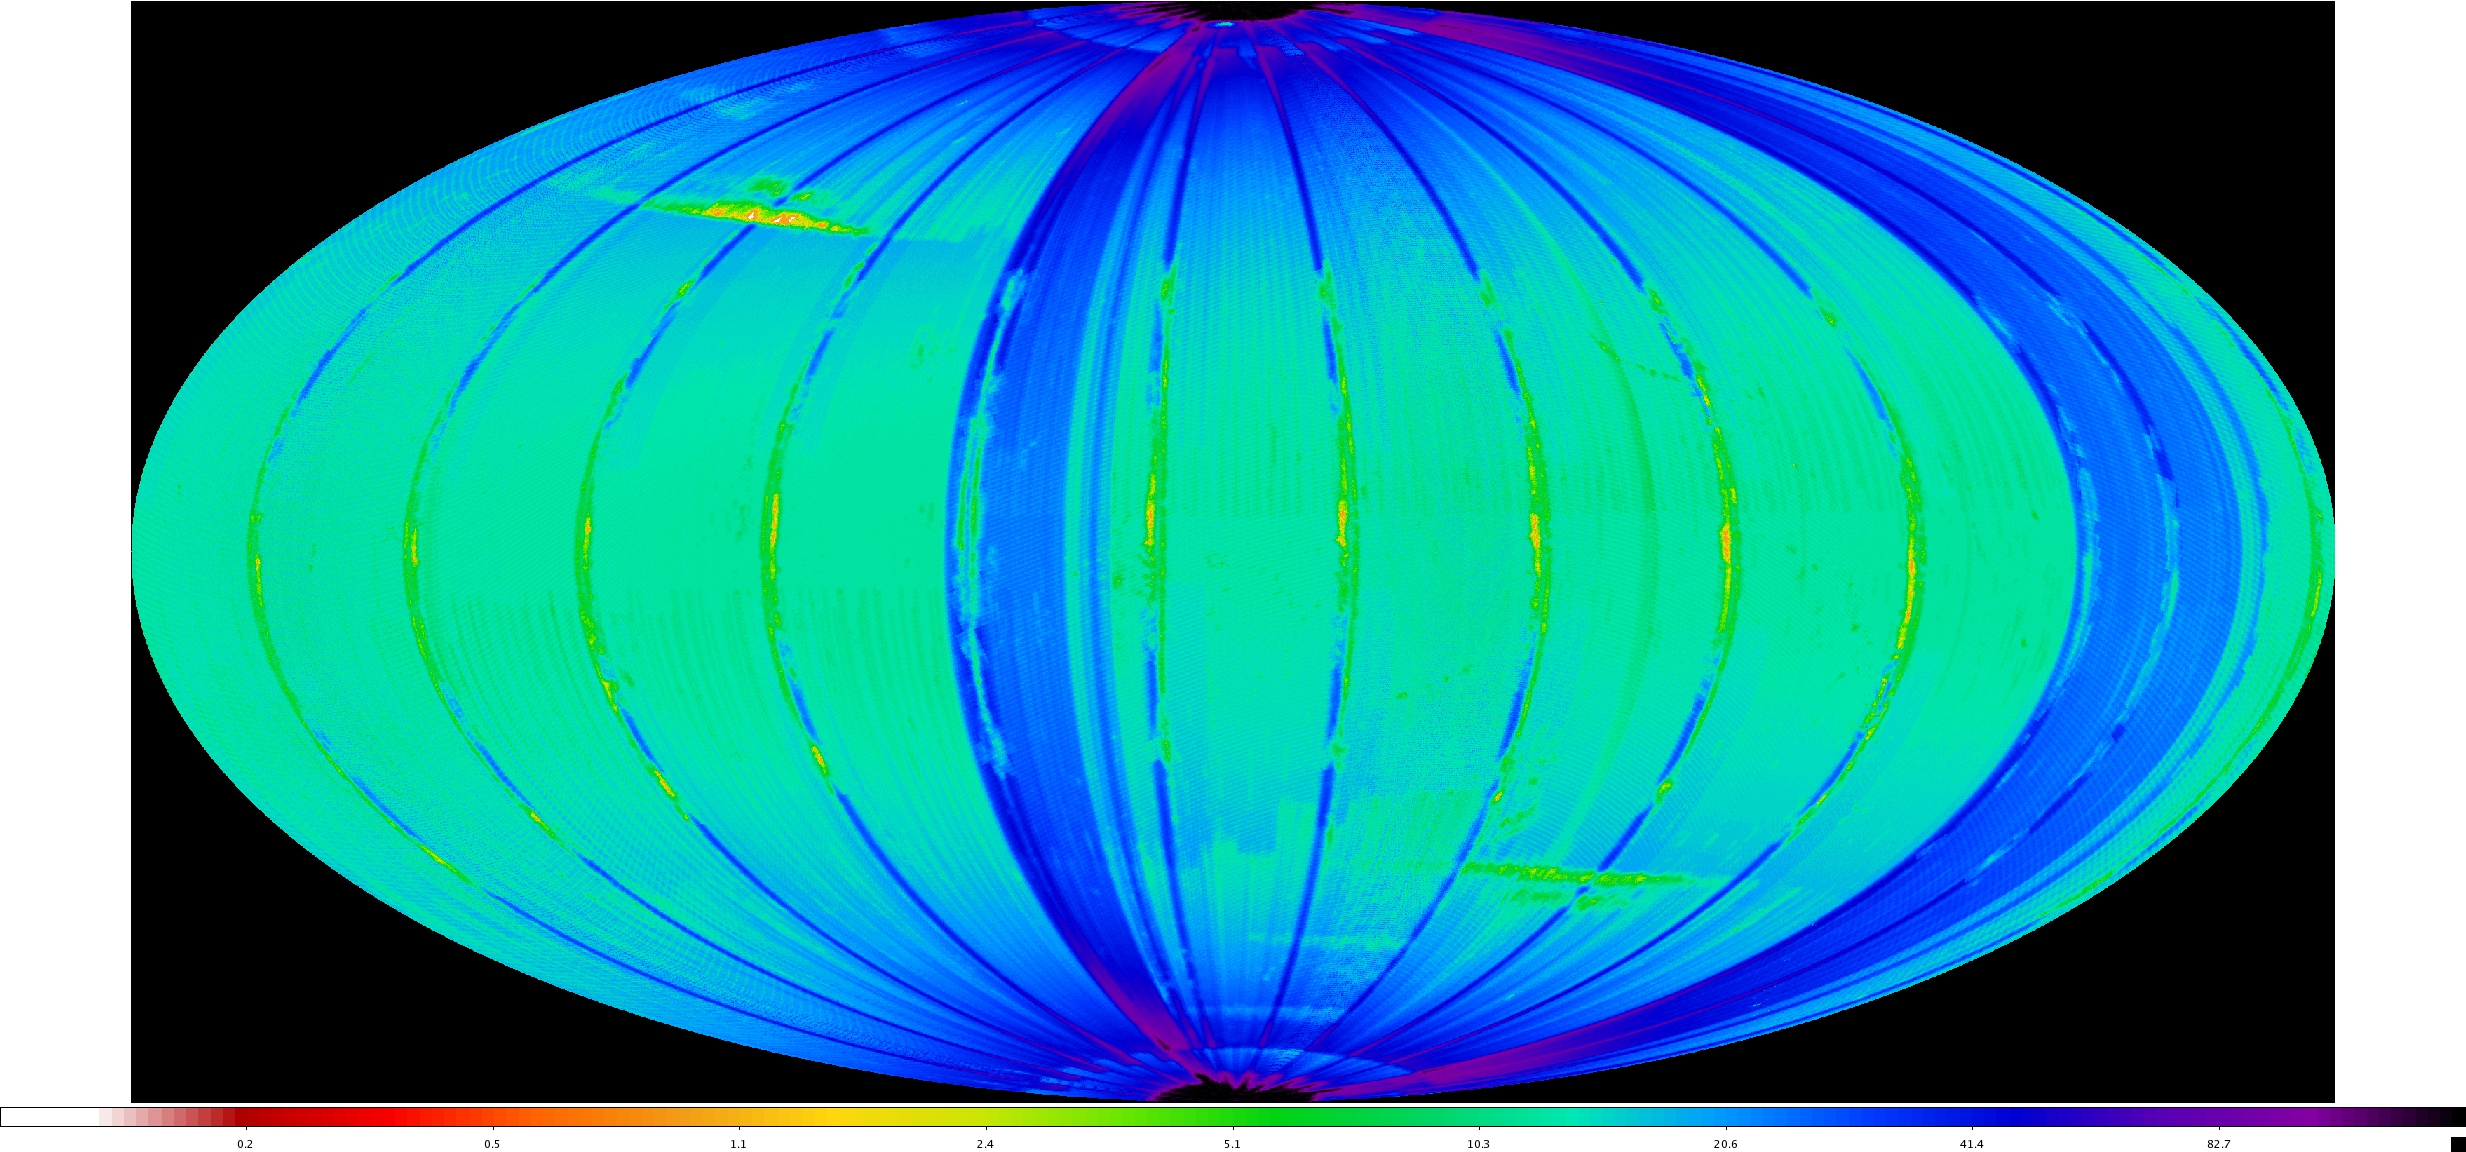 |
| Figure 3 - W3 | Figure 4 - W4 |
| Ecliptic projection skyplots showing the achieved depth-of-coverage in the four bands for the AllWISE Atlas and Catalog. The color scales that encode the average frame depth-of-coverage in 7x7 arcmin spatial bins are the same in each band. The achieved coverage near the ecliptic poles was artificially attenuated to ~165 frames because of data processing limitations. | |
AllWISE data processing utilized W1 Single-exposure images from the early part of the 3-Band Cryo survey phase that had an increasing number of hard-saturated pixels resulting from the increasing detector temperature. The saturated pixels in these images interacted adversely with software that was designed to expand masking of saturated regions associated with bright celestial sources to improve their characterization. The 3-Band Cryo W1 saturation was fixed in pixel-space rather than on the sky, though, so the natural coverage dithering provided by the WISE surveying produced large areas on the coadded Atlas Images that were covered by masked pixels. The interaction between the saturation, expanded masking, and limits in the profile-fit measurement algorithm resulted in some sources having elevated and in some cases missing W1 profile-fit flux uncertainties. The profile-fit flux measurements for these objects are usually valid, but because the flux uncertainty is zero or null in the Working Database, the associated profile-fit magnitudes uncertainties, w1sigmpro, are null which makes the profile-fit magnitude, w1mpro, appear to be 95% confidence upper limit. Special criteria were devised to compensate for the missing W1 flux uncertainties in the AllWISE Source Catalog source selection process, but the elevated W1 flux uncertainties cannot be easily identified and persist into the Catalog and Reject Table. The W2 profile-fit photometry does not appear to have been affected by saturation during the early 3-Band Cryo phase.
The onset of W1 saturation in the 3-Band Cryo data occurred when the temperatures of the HgCdTe focal plane detectors rose above 32 K, the temperature at which they were held during the full Cryogenic period. This occurred on 2010 August 8 in scan 07164a. As the temperatures rose, thermal recombination generation current in the semi-conductor material caused selected pixels to saturate in the normal exposure time. This increase in the number of saturated pixels is illustrated in Figure 5 that shows a comparison between raw and calibrated W1 Single-exposure images of the same region of sky taken during the 4-Band Cryo and the early 3-Band Cryo phases. The saturation is not in response to sources on the sky, but is associated with individual pixels, particularly around the edge of the image. The precise way these pixels align during image coaddition in the Multiframe Pipeline processing affects the impact on the profile-fit photometry measurements.
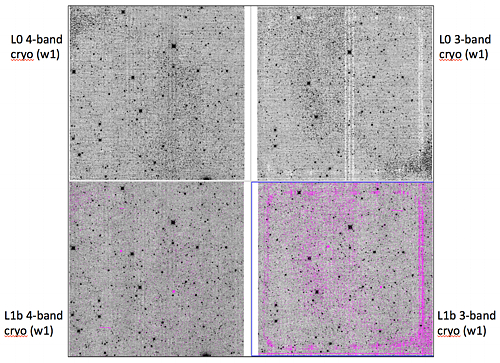 |
| Figure 5 -Comparisons between raw (L0; top row) and calibrated (L1b; bottom row) W1 Single-exposure images of the same region of sky acquired during the 4-Band Cryo survey phase (left) and the early 3-Band Cryo phase when temperatures had risen above 32 K (right). Hard-saturated pixels are marked in magenta. |
Data were taken for ~12 days before the saturation was corrected by adjusting the W1 detector bias on 2010 August 20, just prior to scan 07540a. The ecliptic longitude ranges that were scanned by WISE between the time the temperatures rose above 32 K and the the bias was adjusted are 44.7°<λ<54.8° and 230.9°<λ<238.7°. Figures 6 and 7 show the total number of W1 and W2 saturated pixels per Tile coming from all Single-exposures, scaled by the median depth-of-coverage for the Tile, plotted as a function of Tile ecliptic longitude. The abrupt increase and drop-off of the saturation correspond closely to the longitude ranges given above. There are an order of magnitude fewer saturated pixels in W2 than W1, which is why W2 photometry was not degraded.
 |
 |
| Figure 6 - W2 | Figure 7 - W3 |
| The total number of saturated pixels per Tile coming from all Single-exposures that were coadded to make each Atlas Image, scaled by the median depth-of-coverage of the Tile, plotted as a function of Tile ecliptic longitude. The small black points are for individual Tiles. The green line is the trimmed average saturated pixel count in 0.5 degree wide bins. The rises in the density of saturated pixels away from the major spikes are caused when very bright regions were scanned, such as the Galactic Center. | |
Not all measurements of sources that were covered by the saturated 3-Band Cryo W1 Single-exposures were affected to the same extent. The severity of the impact on the profile-fit photometry depended on the number of 3-Band Cryo W1 frames covering a source, the total depth-of-coverage on a source, and the specific way the saturated pixels aligned in the coadd covering a source. This complicates identifying affected sources in the Catalog, and quantifying their impact on Catalog properties such as completeness.
Source extractions that are missing W1 flux uncertainties are easily identified in the AllWISE Catalog and Reject Table by having a W1 ph_qual value equal to "Z" (ph_qual[1]='Z'). There are 155,843 such entries in the Catalog and Reject, and as shown in Figure 8 they are confined to the expected narrow range of ecliptic longitudes. The sources with missing W1 uncertainties lie preferentially at high ecliptic latitudes where the total depth-of-coverage is greater, and on the side of the sky where there was deeper coverage during the early part of the 3-Band Cryo survey because of a moon avoidance maneuver.
The profile-fit magnitude uncertainties, w1sigmpro, are plotted in Figure 9 as a function of profile-fit magnitude, w1mpro, for all source extractions in Atlas Tile 2578p545_ac51 (λ,β=238.1°,β=76.6°). This Tile lies in a location where there was deep overall frame coverage and a large amount of coverage by 3-Band Cryo frames with W1 saturation. The great majority of the extractions in this Tile do have W1 flux uncertainties, and most follow a well-behaved uncertainty vs. flux relationship that is consistent with regions not affected by saturated 3-Band Cryo frames. However, there is an envelope of measurements scattering to much larger uncertainties at all magnitude ranges. There is no definite way to determine a priori which entries in the AllWISE Catalog or Reject Table in the affected ecliptic longitude range will have degraded flux uncertainties.
 |
 |
| Figure 8 - Ecliptic aitoff projection sky plot showing the location of the AllWISE Working Database extractions that have missing W1 profile-fit flux uncertainties. The narrow range of longitude in which they are found corresponds to the time during which W1 images were saturated during the early 3-Band Cryo phase. | Figure 9 - AllWISE W1 profile-fit flux measurement uncertainties plotted as a function of W1 profile-fit magnitude for all extractions in Atlas tile 2578p545_ac51. The elevated flux uncertainties are caused by the presence of saturated W1 images from the early 3-Band Cryo phase. The horizontal red line indicates SNR=5, the limit used for AllWISE Catalog source selection. |
The general characteristics of AllWISE Catalog and Reject Table sources that may have W1 profile-fit measurements affected by 3-Band Cryo saturation are:
Other than extractions that are missing W1 profile-fit flux uncertainties outright, the remaining characteristics don't guarantee that the W1 flux uncertainties are elevated. But some care should be taken when using the W1 photometry from sources that do exhibit any of these symptoms. It can also be useful to examine the average and standard deviation of the Single-exposure W1 flux measurements that are carried in the AllWISE Catalog and Reject Table records, w1magp and w1sigp2, as they are useful proxies for the profile-fit measurements made on the "stack" of frames.
 |
 |
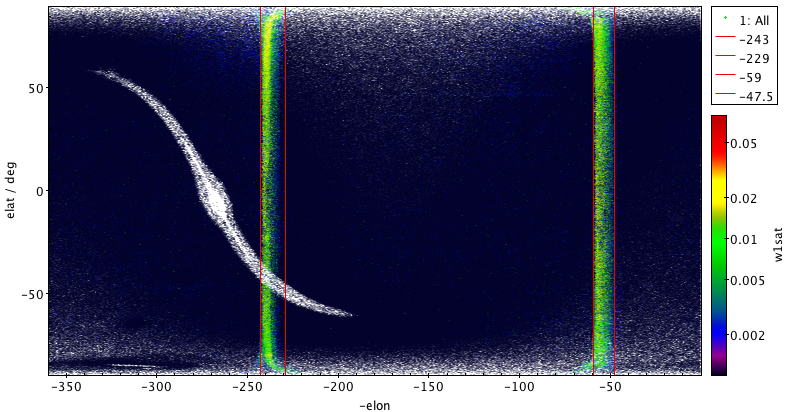
| Figure 10 - Ecliptic cartesian sky plot showing the mean W1 saturated pixel fraction for a source measurement (w1sat) for AllWISE Catalog sources with 15.0<W1<15.1 mag encoded by color. These are much fainter than the nominal W1 saturation limit, W1~8 mag. The elevated mean saturated pixel fractions in the narrow ecliptic longitude bands are caused by the presence of the saturated W1 images from the early 3-Band Cryo survey phase. | Figure 11 - Histograms showing the distribution of the number of W1 and W2 Single-exposure frames available for measurements in the same high ecliptic latitude region of the sky that is covered by saturated W1 3-Band Cryo frames. The nominal W1 and W2 frame depth-of-coverage is the same in this region, but a large number of W1 frames were excluded because truncation in processing due of the presence of the saturated 3-Band Cryo frames. |
Last update: 22 November 2013