


| Date (UTC) | MJD | Scan ID | Event |
|---|---|---|---|
| 08/05/2010 | -- | -- | Secondary cryogen tank exhaustion |
| 08/06/2010 | 55414.441017 | 07101b | Start of 3-Band Cryo survey |
| 08/08/2010 | 55416.494338 | 07164a | W1 and W2 detector temperatures rise above 32K |
| 08/13/2010 | 55421.819228 | 07325a | W3 exposure time reduced to 4.4 sec |
| 08/16/2010 | 55424.414629 | 07402a | Start of inadvertent W3 saturation |
| 8/19/2010 | 55427.835446 | 07506a | W3 exposure time reduced to 2.2 sec, W3 out of saturation |
| 8/20/2010 | 55428.929663 | 07540a | W1 and W2 detector offset levels adjusted |
| 8/22/2010 | 55430.977259 | 07601b | W3 exposure time reduced to 1.1 sec |
| 9/29/2010 | 55468.777510 | 08744a | Primary cryogen tank exhaustion, End of 3-Band Cryo Survey | 9/29/2010 | 55468.778656 | 08745a | Start of Post-Cryo survey operations |
Changes in the payload operating characteristics during the WISE 3-Band Cryo mission phase resulted from the changing temperature of the telescope and the focal plane detectors. Payload operations, particularly in the W3 band, were adjusted to compensate for rising thermal emission levels and higher temperatures.
The WISE payload was cooled by a two-stage solid hydrogen cryostat. The 27 liter inner (primary) tank cooled the Si:As (W3 and W4) focal plane assemblies to 7.8K. The 197 liter outer (secondary) cryogen tank cooled the HgCdTe (W1 and W2) focal plane assemblies, telescope and optics, and shields around the inner tank. During full-cryogenic survey operations, the telescope was cooled to below 13K, and the HgCdTe FPAs were maintained at 32K using heaters.
On 3 August 2010 UTC, the temperature of the WISE outer cryogen tank began to rise slightly, indicating that the solid hydrogen in that tank was nearing exhaustion. The warming accelerated on 5 August signaling that the hydrogen ice had completely sublimated. At 10:35 on 6 August 2010 UTC, the background levels measured in the W4 Single-exposure images began to increase quickly in response to the rising thermal emission from the warming telescope. The W4 Si:As detector was quickly overwhelmed by the thermal emission and no longer yielded useful data. This point, corresponding to the start of survey scan 07101b, is defined to be the start of the 3-Band Cryo survey phase. The W3 Si:As detector remained operational, cooled by hydrogen in the inner cryogen tank, but with reduced sensitivity because of the elevated telescope thermal emission. The W1 and W2 HgCdTe detectors remained operational at near the full-cryogenic sensitivity levels, but with an increase in the number of high noise pixels (see VII.3.b.iv).
The WISE telescope temperature is shown plotted as a function of date in Figure 1, beginning shortly before the outer cryogen tank exhaustion. The temperature rose rapidly for approximately 15 days and then settled near 45 K, sustained by the solid hydrogen in the inner cryogen tank. The telescope remained relatively stable until 29 September when the cryogen in the inner tank was exhausted. Temperatures quickly rose resulting in saturation of the the W3 detector and bringing to a close the 3-Band Cryo survey phase.
WISE continued to survey the sky in the Post-Cryo mission phase from 29 September 2010 until 1 February 2011 UTC, collecting data with the W1 and W2 detectors that still had sensitivity close to that in the full cryogenic survey phase. Approximately 70% of the sky was covered during this phase, completing a second complete sky coverage and the survey of the inner main asteroid belt.
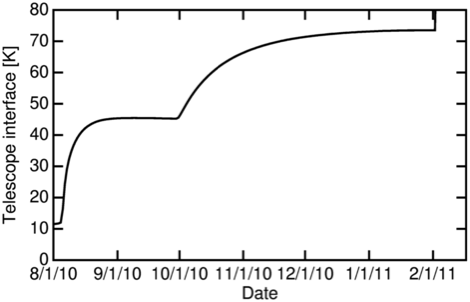 |
| Figure 1 - WISE telescope interface flange temperature as a function of date following the end of the full cryogenic mission phase. The 3-Band Cryo mission phase began on 6 August 2010 and ended on 29 September 2010 UTC. The Post-Cryo survey phase began on 29 September 2010 and ended on 1 February 2011 when data acquisition was halted. |
Increasing thermal emission from the WISE telescope required decreasing the W3 exposure time to avoid saturation during a normal exposure. As described in III.2.a, the WISE focal plane array detectors are read using the sample-up-the-ramp (SUR) method. While sky is held fixed on the focal plane by the scan mirror during an exposure, the arrays are read out non-destructively nine times and the nine reads are multiplied by different weights and summed to give the slope of the integrating counts. The slope values measured for each pixel comprise the "raw" image in each band. During the full cryogen mission phase the weights applied to the W3 and W4 detector reads were {-4,-3,-2,-1, 0, 1, 2, 3, 4}. The W3 exposure time was reduced by successive factors of two during the early 3-Band Cryo phase by changing the SUR weights to the values given in Table 2. The SUR weights were not changed for the W1 and W2 detectors, leaving their net exposure time at 7.7 sec, the same as during the full cryogenic mission phase. Because the telescope temperature rose quickly and then remained stable for most of the 3-Band Cryo period, 70% of the 3-Band Cryo W3 data were acquired with 1.1 sec exposures.
| Exposure Time (sec) | SUR Coefficients | Scan Interval |
|---|---|---|
| 8.8 | { -4,-3,-2,-1, 0, 1, 2, 3, 4 } | 07101b - 07324a |
| 4.4 | { -4,-2, 0, 2, 4, 0, 0, 0, 0 } | 07325a - 07505b |
| 2.2 | { -4, 0, 4, 0, 0, 0, 0, 0, 0 } | 07506a - 07601a |
| 1.1 | { -4, 4, 0, 0, 0, 0, 0, 0, 0 } | 07602a - 08744a |
The W3 Single-exposure data began to saturate from the telescope thermal emission during the 4.4 sec interval before the the SUR coefficients could be changed to further reduce the exposure time. As a result, the W3 frames in scans 07402a through 07505a had some level of saturation. These frames were omitted from second-pass Scan/Frame Pipeline processing and hence were not included in the coaddition to construct the 3-Band Cryo Atlas Images. This gap in the 3-Band Cryo W3 Atlas Image coverage is discussed in VII.4.c.
W3 exposure times are given by the w3exptime parameter in the 3-Band Cryo Single-exposure Source Database, and the 3-Band Cryo Single-exposure Frame Metadata Table. However, the W3 exposure time given in the EXPTIME FITS keyword in the headers of the W3 Single-exposure Images is listed erroneously as 8.8 sec in the shorter exposure time data.
The median W3 pixel values in the W3 Single-exposure images are shown in Figure 2 plotted as a function of time through the 3-Band Cryo period. The steady increase in the frame medians tracks the increase in telescope temperature seen in Figure 1. Because individual read-out signals are combined using the different weights given in Table 2 to derive an effective slope for each pixel, the resulting Single-exposure pixel levels in DN do not scale linearly with the exposure time. Hence the jumps in the median frame pixel values in Figure 2 are not equal to a factor of two at each exposure time change. Relative to the 8.8 sec exposures, DN values reduction scale factors for 4.4, 2.2 and 1.1 sec exposures are 3, 7.5 and 15, respectively. Changing W3 detector QE and gain with rising operating temperatures also cause deviations from simple exposure time scaling. Both of these factors are taken into account in the derivation of the proper photometric calibration zero points for the 3-Band Cryo data, as described in VII.3.g.
Another consequence of the changing SUR weights is that the shorter exposure W3 images sample only the early part of the scan-mirror travel, as compared to the 8.8 sec exposures that were formed by averaging over the all scan mirror angles. Because image distortion varies with scan mirror position, the shorter exposure W3 field distortion and net image quality is different than in the longer exposures, and the relative positions of images shift compared to the W1 and W2 images. These changes affect the derived distortion corrections required for 3-Band Cryo position reconstruction, as described in VII.3.d..
 |
| Figure 2 - W3 Single-exposure image median pixel values as a function of MJD. The red vertical line denotes the start of the 3-Band Cryo phase. The blue, green and cyan vertical lines indicate the times at which W3 exposure times were reduced to 4.4, 2.2 and 1.1 sec, respectively. The dashed magenta line indicates the time at which W3 image began to saturate on the normal sky background before the exposure time could be reduced to 2.2 sec. The spikes in the median background levels that occur approximately twice per day are caused by thermal annealing, and the broader increases that occur every two weeks are caused by elevated levels of scattered light when WISE scanned close to the moon. |
Another change in the payload characteristics following the exhaustion of cryogen in the outer tank was the loss or intermittent performance of saturated pixel encoding. The on-board electronics in the WISE payload compared each of the nine individual reads of each pixel to predefined threshold values that indicated the onset of saturation. If the threshold was exceeded, the output pixel was set to a flag values (32,752 to 32,761) that indicate in which sample saturation was detected, rather than the measured slope of the ramp. These flag pixel values are recognized in the image calibration pipeline module (IV.4.a) and used to set values in the Single-exposure Bit Mask images that are used in downstream processing to recognize the presence of saturated pixels.
During the 3-Band Cryo survey phase, the on-board saturated pixel encoding was disabled for the W3 images when the exposure time was reduced from 8.8 sec. When the temperatures of the W1 and W2 HgCdTe detectors rose above 32K on 8 August 2010 UTC (scan_id 07164a), the operating temperature during the full cryogenic survey, saturation encoding became intermittent because rising detector bias levels caused the saturation signal level to be reached before the threshold level was reached. The W1 and W2 detector offset levels were adjusted to compensate for the changing temperature on 20 August 2010 UTC (scan_id 07540a), but there continued to be unflagged saturated pixels, particularly in W2, as shown in Figure 5 of VII.3.b.iv.1.
A conservative effort was made to recover the missing saturation encoding
during the 3-Band Cryo period by using a a prior list of very bright
sources derived from the WISE All-Sky Catalog and the 2MASS and IRAS
Point Source Catalogs and tagging pixels at the stars location
over an area that is a function of the source brightness.
This process, described in VII.3.b.iv.1,
was most effective for bright point sources with good position priors.
Saturated pixels associated with objects having large proper motions or
relatively poor positional information could not be accurately flagged.
The saturation recovery was also unable to encode pixels in
extended regions of saturating emission such as the Galactic Center
and the core of very bright HII regions such as Orion.
WISE employed the same scanning and survey strategy during the 3-Band Cryo mission phase that was used during the full cryogenic survey. As described in III.4, WISE continued to scan the sky along great circles approximately perpendicular to the Earth-Sun line. Single-exposures were acquired using the normal freeze-frame scanning technique that acquired new W1, W2 and W3 framesets each 11 sec. Adjacent exposures within a scan overlap by approximately 10%, and the orbital precession rate produces ~90% overlap near the ecliptic plane between adjacent scans.
During the 3-Band Cryo survey period, 1643 survey scans were performed, numbered 07171b - 08744a, and 392,879 Single-exposure framesets were acquired. 3-Band Cryo scans covered approximately 30% of the sky in two broad ecliptic longitude ranges, 42.2°<λ<98.0° and 228.5°<λ<281.7°, as illustrated in Figure 3. The nominal depth-of-coverage of 3-Band Cryo Single-exposures was typically 12-13 near the ecliptic plane, increasing towards the ecliptic poles as the scan paths converged. The effective sky coverage achieved during the 3-Band Cryo period when taking into account data quality and the temporary loss of W3 frames due to saturation is discussed in VII.5.a.
WISE scanned points on the sky in opposite directions during the full cryogenic and 3-Band Cryo survey periods. Therefore, image artifacts such as latent images and optical ghosts, whose position relative to their parent stars depends on scan direction, will appear in different locations in the All-Sky and 3-Band Cryo images.
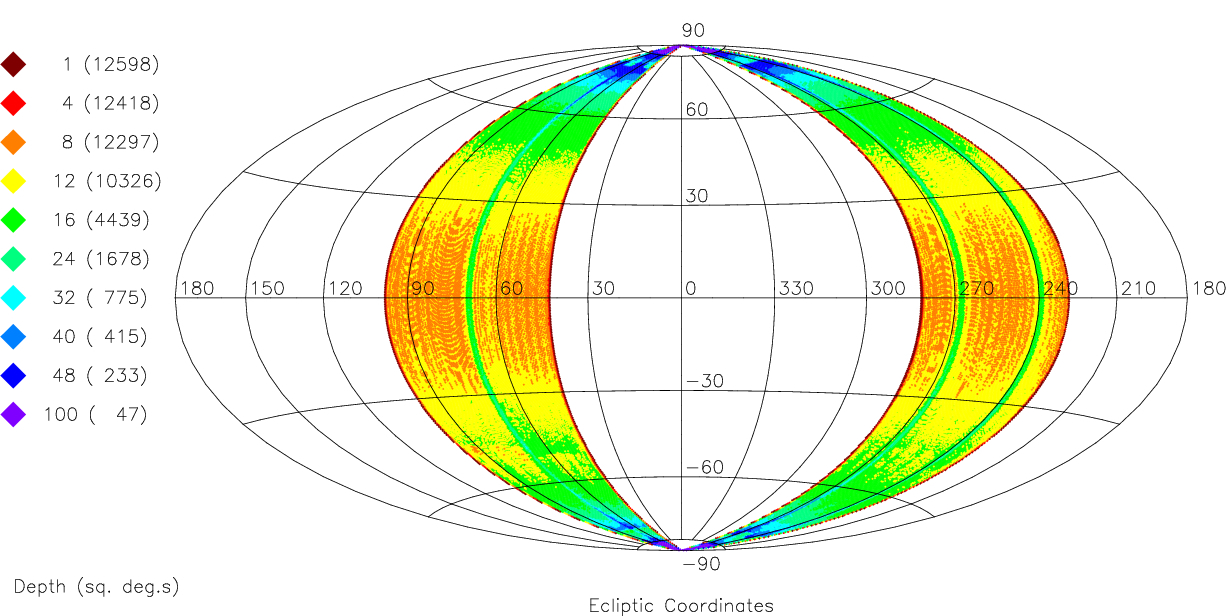 |
| Figure 3 - Ecliptic sky plot showing the average raw frameset depth-of-coverage in 23'x23' spatial bins during the WISE 3-Band survey phase. Colors encode the average depth-of-coverage indicated by the key on the left side of the diagram. |
Last Updated: 2012 July 26