


One of the ancillary Atlas Image products is a depth-of-coverage map, generically named: COADDID-wBAND-cov-3.fits, where BAND = 1, 2, 3, or 4 and COADDID is a unique identification string pertaining to the sky footprint. The depth-of-coverage map includes FITS metadata matching that in the primary intensity Atlas Image and uncertainty map, and has the same dimensions and pixel-scale as these products.
The value of a pixel in a depth-of-coverage map represents the effective number of times that point on the sky was visited by a "good" detector frame pixel, that is, not rejected due to bad pixels, saturation, or outliers (e.g., cosmic rays, moving objects or non-uniform moon glow). In general, the depth-of-coverage is not an integer since it is a by-product of the co-addition process that uses the Point Response Function (PRF) as an interpolation kernel. As described further in section IV.4.f.vii, the effective depth Nj at some co-add pixel j is in fact the sum of all overlapping PRFs (or pixel responses) at that location contributed by all detector pixels i, both spatially and temporally in the stack: Nj = Σ iPRFij. If no pixels were rejected, the effective depth will reduce to the integral number of frame overlaps in the stack. Figure 1 shows a 1-D schematic of this operation for a single input frame, illustrating the case where the effective depth can be fractional and even less than unity.
For each Atlas tile, five depth-of-coverage metrics
are written to the FITS headers of all Atlas Image products,
all of which are band-dependent.
These metrics are represented by the FITS keywords:
MEDCOV, MINCOV, MAXCOV, LOWCOVPC, LOWCOPC, NOMCOVPC,
and PCTMINC,
and are defined in section II.3.b.
For global (all-sky) analyses of the depth-of-coverage that make use
of the individual depth-of-coverage maps, see section VI.2.
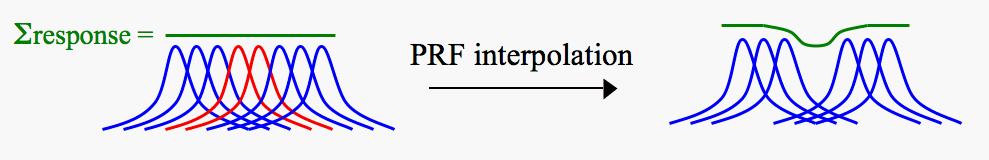 |
| Figure 1 - Schematic of Point Response Function (PRF) interpolation in one-dimension. The red PRF profiles are at the locations of bad frame pixels which when masked, do not lead to zero coverage because there is non-zero response contributed by neighboring pixels. As a consquence, fractional values for the depth-of-coverage can result. For details, see section IV.4.f.vii. |
Last update: 2012 February 20