


The variability flag in the WISE source records, var_flg, is a four-character string, with one character per band, that gives a measure of the probability that the source is variable in that band. Var_flg can have a value in each band of "0" to "9" or "n". Values of "0" through "9" indicate increasing probability of variability. A var_flg value of "n" in a band indicates insufficient or inadequate data to make a variability determination. Values of "0" through "3" can generally be regarded as non-variable sources in that band. Values of "4" through "7" can be regarded as potentially variable with small amplitudes. Objects with a value of "8" or "9" are the most likely to be variables in the given band.
The probability of flux variability in a band is evaluated by analyzing the distribution of flux measurements of a source on the individual Single-exposure frames during Multiframe pipeline processing. As discussed in III.1.b, these measurements are not the same as those in the All-Sky Release, 3-Band Cryo, or Post-Cryo Single-exposure Source Working Databases that are generated from Scan/Frame Pipeline Processing. In the Multiframe Pipeline photometry module, individual frame measurements are made at the same sky position, determined from the profile-fit deep source extraction on all of the Single exposures that cover the source. In the Scan/Frame Pipeline, photometry is extracted for a source only if it is detected on the shallower Single-exposures, so objects fainter than the Single-exposure detection limit will not have entries in the Single-exposure Source Database. In addition, positions in the Scan/Frame pipeline are determined independently on each frame, so measurements for the same source may occur at slightly different sky positions on different frames. By forcing the source to have same sky position on each frame and allowing only the intensity amplitude of the to vary from frame to frame, the total number of fitting parameters is greatly reduced. Multiframe Pipeline photometry is consequently more robust and of higher quality, particularly for core-saturated sources and very faint sources.
Note that saturated sources in Post-cryo data suffer from a positive flux bias which is probably a consequence of a change in the PSF after cryogen depletion. To avoid introducing false variability detection, Post-cryo photometry for sources with W1 < 8 mag or W2 < 7 mag is not used in the computation of variability estimators.
The probability of variation is based on two components and is different from that used in the All-Sky Release. The first component, w?mlq, is a measure of the implausibility of the null hypothesis (e.g. that the source is non-variable). The second component, Fc, uses band-to-band correlation significances. Both components use an integer logarithmic scale between 0 and 9 to give the probability of variability. The two components are then combined so as to give twice the weight to the correlation significance. Before estimating the probability of variability, sources are pre-filtered to eliminate objects that have inadequate or insufficient data available to make a variability determination. The following are the pre-filters used and a brief purpose of each:
| w?ndf > 6 | Minimum number of degrees of freedom in the flux variability chi-square. Small depth of coverage produces unreliable statistics since outliers have a larger effect on the overall variability. This filter helps to ensure the variability is significant. |
| w?nm / w?ndf > 0.4 | Reliability of single-frame measurements: this filter helps to ensure that there is a detection of the source in the Single-exposure image. These parameters ensure that at least 40% of the frames have a single-exposure 3σ detection at the location of the source in the multiframe image. However, this does not ensure that there are also Single-exposure flux detections for the source, as the Single-exposure and Multiframe fluxes are measured at slightly different positions. |
| cc_flags = 0 or cc_flags = [a-z] in at least one band | Artifacts, especially diffraction spike artifacts, can produce variability since the artifact location and intensity can vary between frames. Variability flagging is unreliable in the presence of artifacts and is avoided. Lower-case artifact flags, denoting contaminated but not spurious sources, are accepted as many sources are over flagged. |
| w?snr > 5 | The Multiframe extraction SNR must be significant, otherwise there will be no Single-exposure detections. This filter rejects sources that are too faint to have Single-exposure detections. |
| na = 0 | Eliminates sources with active deblending, which indicates one more more close neighbors which can produce false variability. |
| w?sigmpro not null | There must be a valid Multiframe detection of the source in the band. |
For each source that satisfies the pre-filter conditions, the variability flag in each band is computed via:
| var_flg[?] = int[ ( Floor(w?mlq/10) + 2 * QF) / 3 ] | (Eq. 1) |
where w?mlq is a probability measure that the source is variable in the band, and QF is defined as:
| W1 | if rho12 > 0, then QF = q12, else QF = 0 |
| W2 | maximum of the following two QF quantities: |
| W3 | maximum of the following two QF quantities: |
| W4 | if rho34 > 0, then QF = q34, else QF = 0 |
Floor() refers to the integer part of a real number, while int() is a real number rounded to the nearest integer. Note that all quantities above are available in the AllWISE source catalog; the pre-filter limits or weighting scheme can be modified and the var_flg indices recomputed by the user as needed.
w?mlq is defined as -ln(Q), where Q = 1 - P(χ2). P is the cumulative chi-square distribution probability for the flux sample measured on the individual Single-exposure images and is clipped at 9. The Q value is the fraction of all cases to be expected to be at least as large as that observed if the null hypothesis (that the flux is emitted by a non-variable astrophysical object) is true. It may be false because the object is a true variable. It may also be false because the flux measurement is corrupted by artifacts such as cosmic rays, scattered light, etc. The smaller the Q value, the more implausible the null hypothesis, i.e., the more likely it is that the flux is either variable or corrupted or both.
rho12, rho23, and rho34 are the correlation coefficients between Single-exposure flux measurements in W1 and W2, W2 and W3, and W3 and W4, respectively. These are approximately equal to 100 times the J variability index of Stetson (1996 PASP, 108, 851). Note that requiring rho?? > 0 prevents strong anti-correlation from being mistaken for a sign of variability. This was inadvertently missed in the All-Sky release.
q12, q23, and q34 are the correlation significance between W1 and W2, W2 and W3, and W3 and W4, respectively. The values are -log10[Q2(rho??)], where Q2 is the two-tailed fraction of all cases expected to show at least this much apparent positive or negative correlation when in fact there is no correlation. The value is clipped at 9.
Figure 1 shows histograms of var_flg for the sources in the AllWISE Source Catalog with at least one non-trivial (!="n") flag value in any band. More than half of all Catalog sources fall in this category. At any given var_flg value, W1 and W2 flags are typically two orders of magnitude more frequent than those in W3 and W4, and W1 and W2 account for the vast majority of non-trivial var_flgs.
Approximately 60% of the sources have var_flg[1]=0 in and 0.5% have var_flg[1]=9. The percentage of all Catalog sources that are "significantly" variable (var_flg >; 6) is about 1%. Sources with var_flg > 6 can generally be regarded as having a high reliability of being variable. Of 112 million sources with w1mpro < 14, 2.5\% have var_flg[1] > 6, and 1.3% have var_flg[1] = 9.
A discussion of how var_flg values should be interpreted, examples of light curves for periodic and non-periodic variable sources, and tips for using the var_flg in Catalog queries are presented in II.3.c.
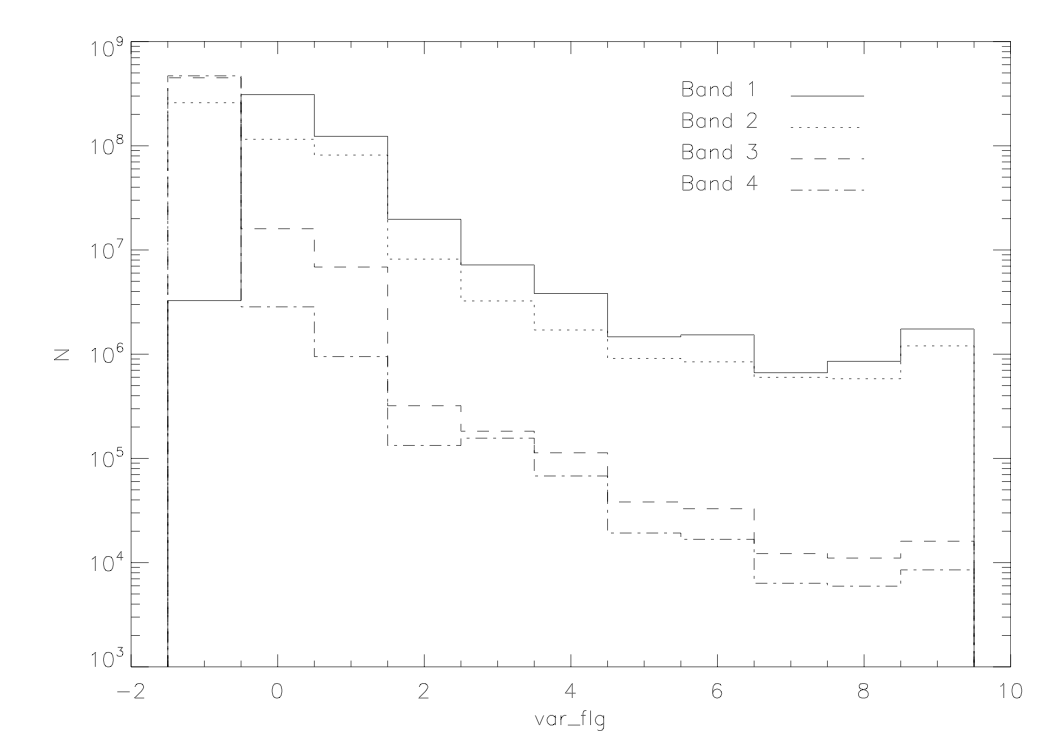 |
| Figure 1 - Histograms of var_flg values for 4.7x10⁸ sources for which at last one non-trivial (!="n") flag value was found. "n" flags are assigned a value of -1 in the plot. |
There are some known limitations with the variability flagging algorithm that can result in anomalous large var_flg values.
Last update: 19 November 2013