


The magnitudes in the AllWISE Catalog and Reject table effectively measures the source fluxes averaged over all of the individual Single-exposure measurements covering the object taken over a span ranging from about 6 to 12 months. Objects whose flux varied between the different Single-exposures may exhibit larger photometric uncertainties or elevated profile-fit chi-squared goodness-of-fit parameters. Source entries in the Catalog and Reject Table that have a statistically significant probability of that their fluxes varied in each band are identified using by var_flg, the variability flag.
The var_flg is a four character string parameter, one character per band. The value for each band can be 0-9, where larger numbers indicate increasing probability of flux variability. A value of "n" in a band means that there is insufficient information to make a good estimation of flux variability. The var_flg parameter is derived from statistics on the Single-exposure flux distributions for each sources, as described in V.3.b.vi.
Figure 1 shows histograms of var_flg for all sources in the AllWISE Source Catalog with at least one non-trivial (i.e. != "n") value in any band. More than half of all Catalog sources fall in this category. At any given var_flg value, W1 and W2 flags are typically two orders of magnitude more frequent than those in W3 and W4, and W1 and W2 account for the vast majority of non-trivial var_flg entries.
Approximately 60% of the sources have var_flg=0 and 0.5% have
var_flg=9. The total percentage of "significantly" variable
sources (var_flg > 6) that are evaluated is about 1%. Sources with
var_flg > 6 can generally be regarded as having a very high
probability of being flux variable. About 1% of the AllWISE Catalog sources
have var_flg > 6 in any band.
Variability is most likely to be detected in W1, and for sources
that are detected with good SNR on the Single-exposures, or W1<14.25 mag.
Of the 112 million Catalog sources with
w1mpro < 14, 2.5% have
var_flg[1] > 6, and 1.3% have
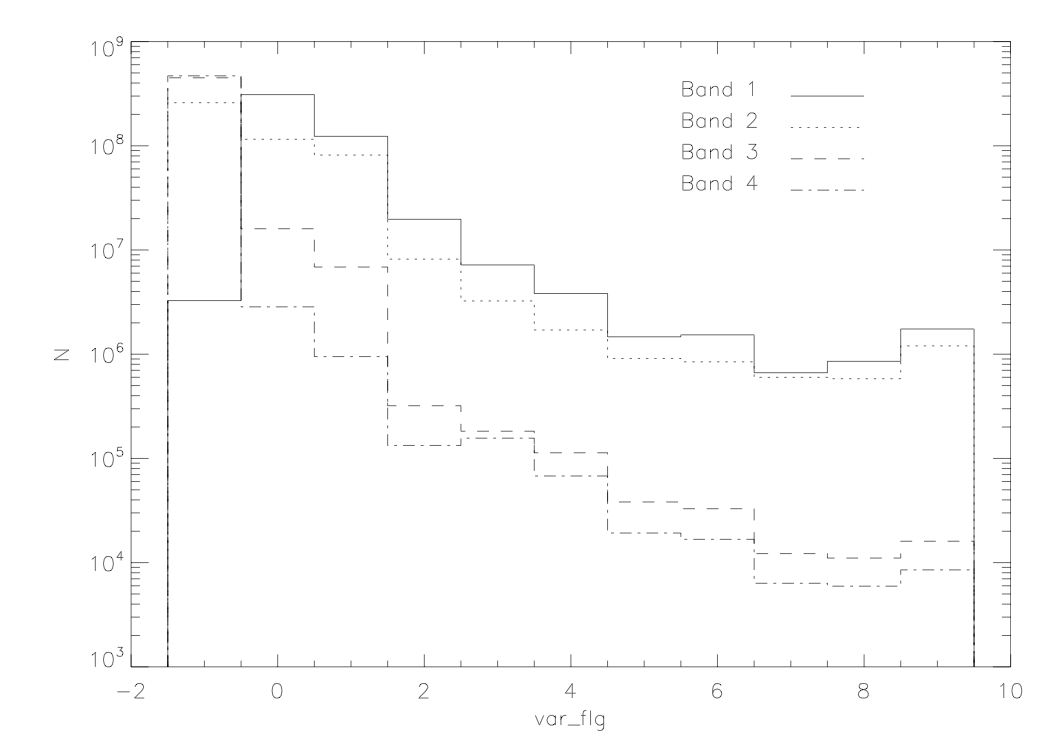 |
| Figure 1 - Histograms of var_flg values for 4.7x10⁸ sources for which at last one non-trivial (!= "n") flag value was found. Var_flg="n" values are are assigned a value of -1 in the plot. |
We can gauge the usefulness of the var_flg index by comparing values for bona fide variable sources with var_flg for field stars. For a sample of 2634 variables in the General Catalog of Variable Stars that are also in the AllWISE Source Catalog, we show the fraction, integrated over all magnitudes, of these variables recovered as a function of minimum var_flg in Figure 2. Comparing with similar fractions computed for AllWISE sources that are not found in the GCVS catalog, we see very good contrast for minimum var_flg > 1. If we demand var_flg > 7, then Figure 2 indicates that we will detect approximately 73% of real variables. If we relax this to var_flg > 4, then we can expect to capture approximately 85% of real variables. According to Figure 2, these var_flg limits would lead to less than 2% contamination by non-variable sources.
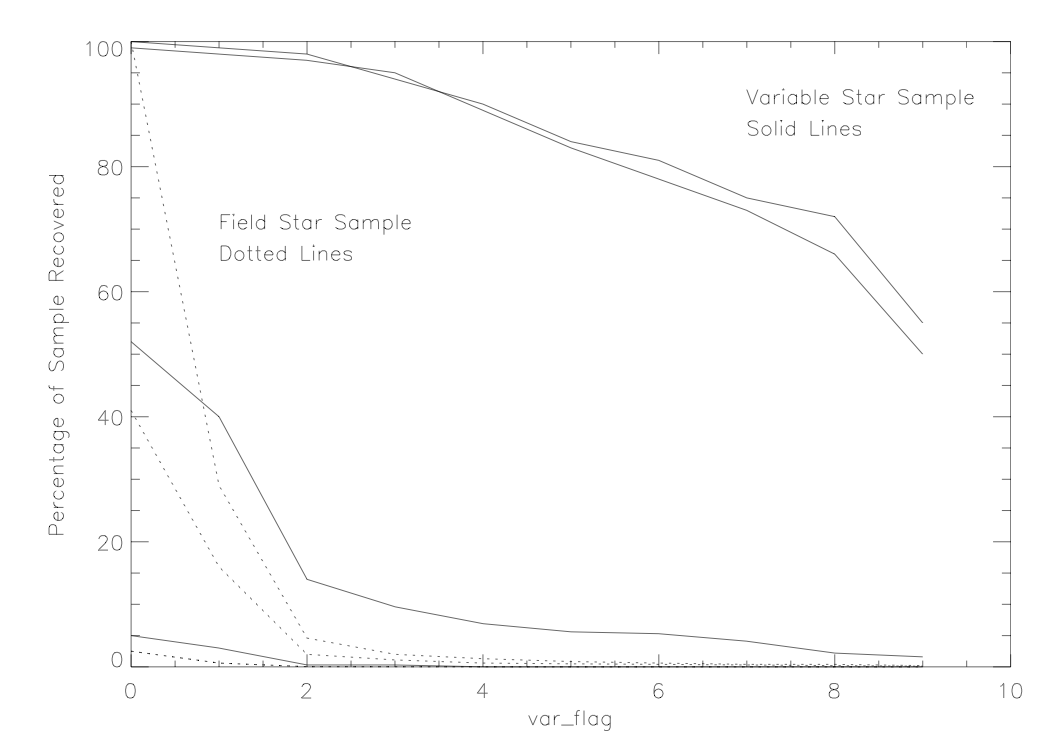 |
| Figure 2 - Recovery rate for known variable stars versus minimum var_flg value. Solid lines show results for known variables, with W1 at the top and W4 at the bottom. Dotted lines show the percentage of field stars (which will include some fraction of unknown variables) captured at any particular minimum var_flg value. |
The var_flg index must necessarily become less reliable at fainter magnitudes. In Figure 3 we examine the mean value of the var_flg index in W1 as a function of magnitude for the same GCVS sample as above. The var_flg contrast between variables and field stars drops both at bright magnitudes (due to saturation) and faint magnitudes (due to noise). Figure 3 indicates that var_flg becomes a relatively poor discriminator for W1 > 14 mag. However, for W1 < 14 mag, using a minimum var_flg[1] of 5 should provide > 3σ contrast with respect to field stars. For W1 > 14 mag, samples will be increasingly contaminated by non-variable sources.
 |
| Figure 3 - The run of mean var_flg with W1 magnitude for 2634 known variables (filled circles), compared with the mean var_flg for one million random field stars (asterisks). The error bars correspond to one standard deviation. Var_flg = "n" sources have been excluded from this calculation. |
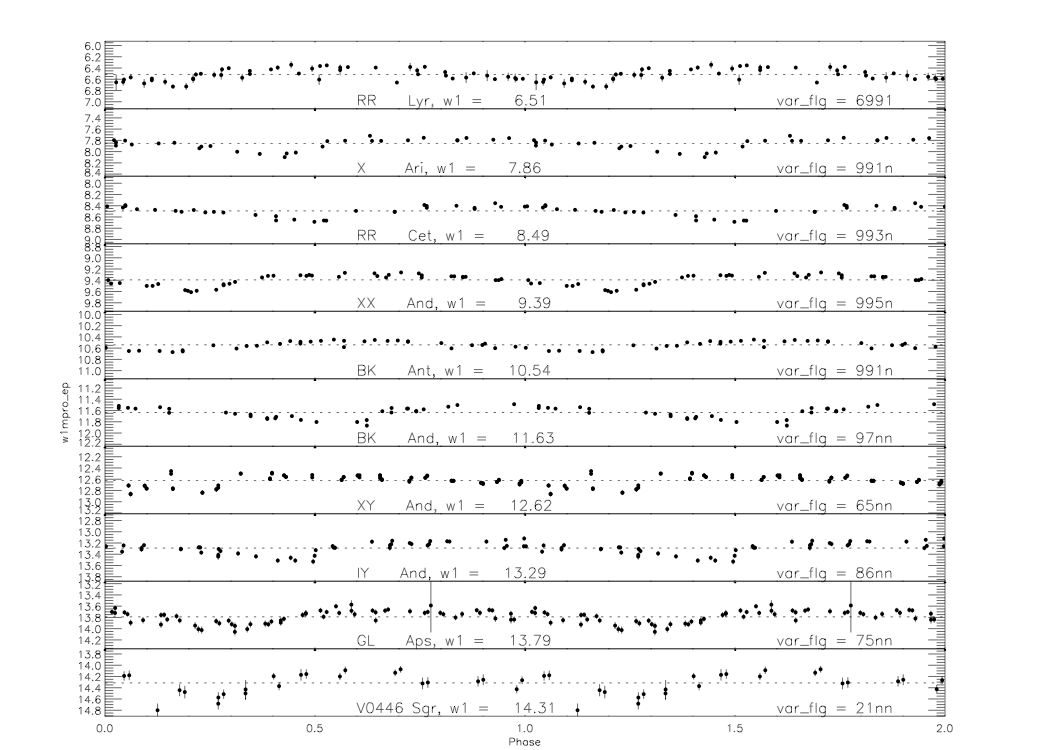
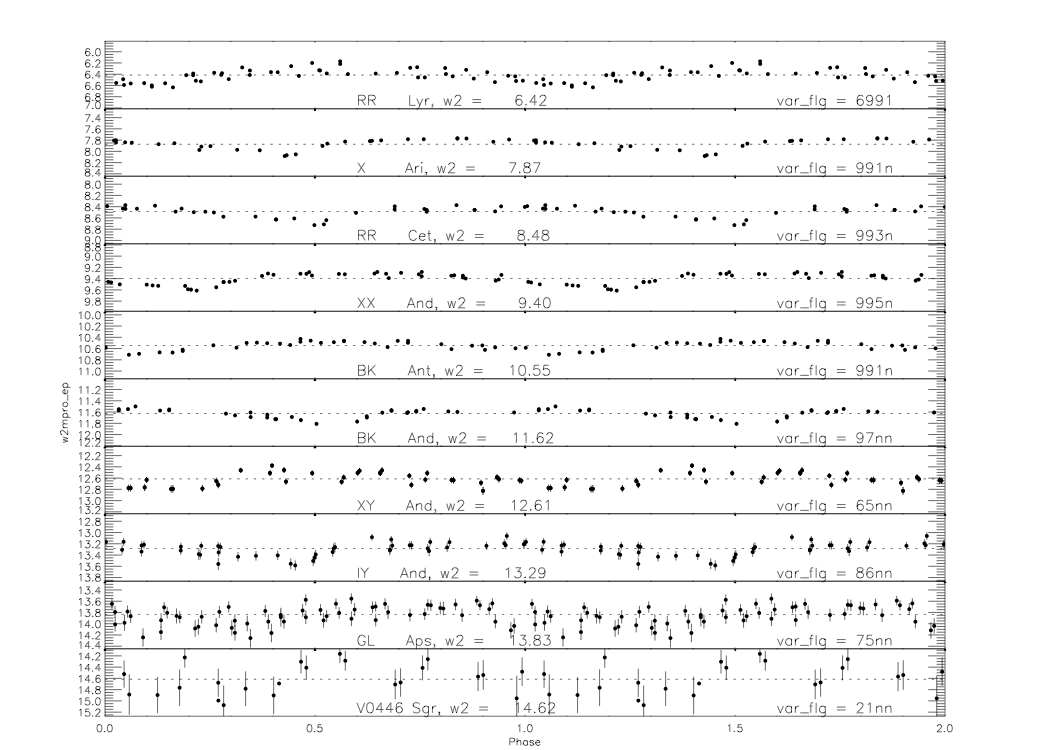
Examining the behavior of var_flg with magnitude more closely, figures 4 and 5 show phased W1 and W2 light curves constructed from AllWISE Multiepoch Photometry Database measurements of RR Lyrae stars ranging in magnitude from heavily saturated to W1, W2 > 14. As above, the computed var_flg drops off significantly at W1,W2 > 14 mag. For the case of V0446 Sgr, the drop in the var_flg is due primarily to a very low band 1/2 flux correlation significance (q12).
 |
 |
| Figure 4 - W1 | Figure 5 - W2 |
| Phased AllWISE light curves generated from Multiepoch Photometry Database measurements of RR Lyrae with a range of magnitudes. Dashed lines indicate the median magnitudes, and the computed var_flgs are listed. | |
Figure 6 shows the fractional, differential distribution of var_flg[1] as a function of W1 magnitude. If the frequence of variables was independent of magnitude, then a perfect variability estimator would yield identical vertical profiles at all magnitudes. Using our estimator above, the ratio of high to low var_flgs remains relatively constant until W1 ~ 14 mag, where the fraction of high var_flgs begins to drop precipitously and the fraction of low var_flgs rises accordingly. As expected, var_flg becomes less sensitive when the photometric errors begin to rival in magnitude the variability we are trying to detect.
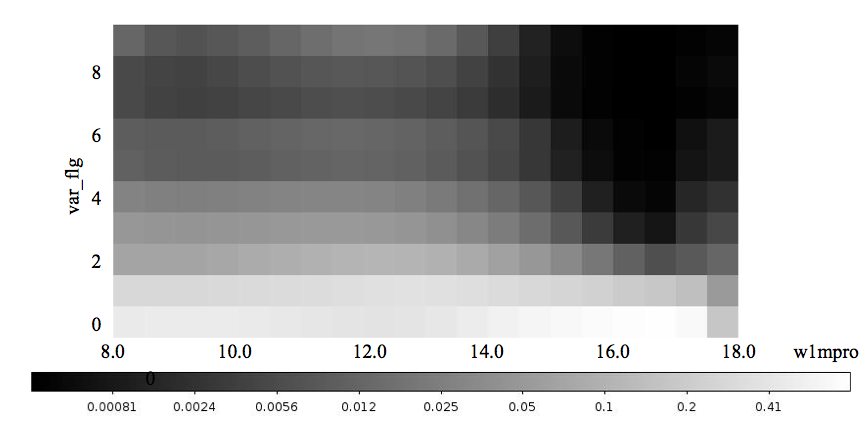 |
| Figure 6 - Logarithmic stretch of the fractional, differential distribution of var_flg[1] vs w1mpro. Each bin is normalized to the total number of sources with that magnitude at all non-null var_flg values. |
The var_flg index is also effective at identifying non-periodic variable sources. Figures 7 and 8 show light curves for for 3C279, an optically violent variable quasar, from the AllWISE Multiepoch Photometry Database. Very nearly on the Ecliptic, this object had minimal coverage in each epoch, though it was imaged during three different epochs. The strong variability of the object is quite apparent, earning 3C279 a var_flg of '9999', one of only 2007 sources (0.0003%) in the AllWISE Catalog to achieve this distinction.
 |
 |
| Figure 7 - AllWISE Multiepoch Photometry Database photometry for the optically violent variable quasar 3C279 (var_flg = '9999'). W1 data are in black, and W2 data are in red. | Figure 8 - W1, W2 light curves of 3C279, focusing on just the central epoch shown in Figure 7. |
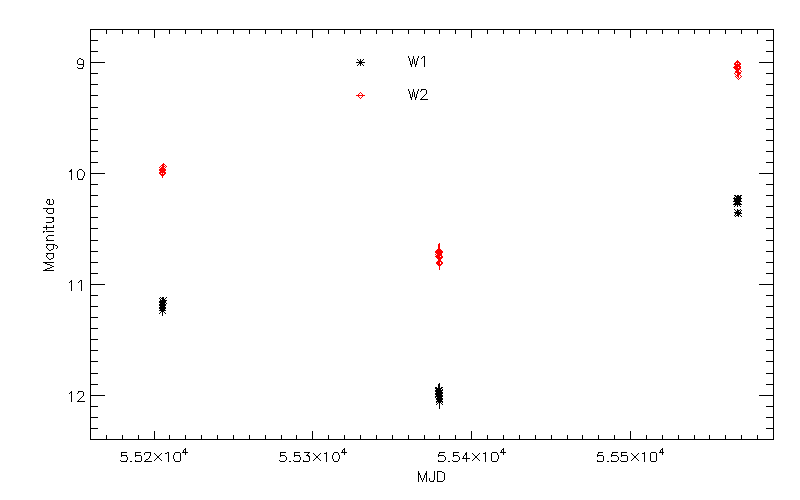
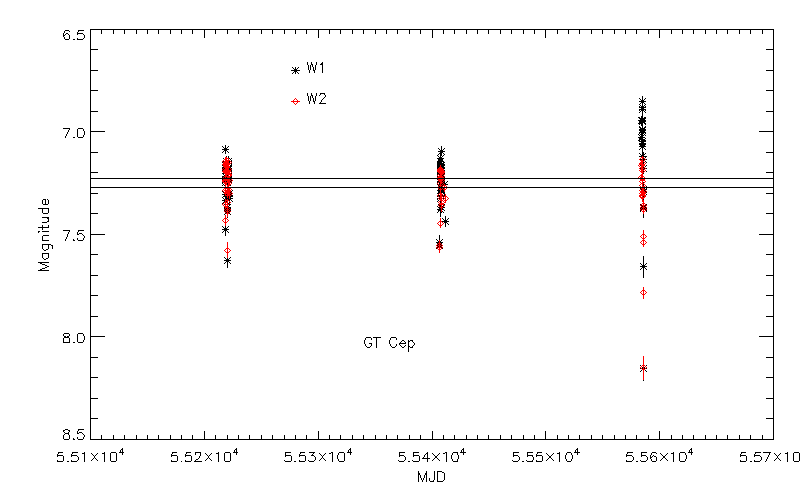
Caution must be used when interpreting Multiepoch Photometry Database light curves for sources that are saturated in W1 and W2 observed during the NEOWISE Post-Cryo survey phase. The W1 and W2 band photometric measurements of sources brighter than W1<8 and W2< 7 mag sources are systematically brighter on the NEOWISE Post-Cryo survey phase data than those measured on the cryogenic phase images (see section VIII.3.e.iii in the All-Sky Data Release Explanatory Supplement. For that reason, Post-Cryo phase photometry of saturated W1 and W2 sources are not used when computing the Single-exposure flux measurement statistics and the var_flg. Figures 9 and 10 show the raw and phased light curves for Cepheid variable GT Cep. The W1 photometry in the third coverage epoch from the Post-Cryo phase is elevated by 0.3 mag with respect to the first two epochs that are from cryo phase measurements. The phased W1 light curve in Figure 10 made using the all three epoch measurements shows increased scatter due to the presence of the biased post-cryo W1 measurements.
 |
 |
| Figure 9 - The raw light curve of Cepheid variable GT Cep. The Post-cryo epoch measurement shows the documented positive flux bias for saturated sources. It is for this reason that Post-cryo photometry of saturated sources is not used in computing the flux variability statistics. | Figure 10 - The phased light curve of GT Cep. The broad hump elevated by 0.3 mag in W1 is caused by the biased W1 photometry. The W2 photometry is not saturated, so the light curve is well-behaved. |
When incorporating the variability flag, var_flg, into AllWISE Catalog searches, remember that the flag is a string. You will likely need to use custom SQL in searches. For example, if you are using the IRSA/Gator query engine, you would search for sources with var_flg > 7 in W1 and W2 and var_flg > 5 in W3 by entering the following in the "Additional Constraints (SQL)" box:
In most cases, it is best to place a constraint on at least two bands to minimize the likelihood of being fooled by one of the known issues that cause anomalous variability flagging.
For maximum reliability when identifying variable sources, one should also pick sources that have ext_flg = 0. This will help to exclude resolved sources and sources with large profile-fit goodness-of-fit chi-squared values that may be affected by confusion with nearby sources or extended nebulosity. This is particularly important for W3 and W4, as those bands are more likely to affected by nebulosity. Requiring high values of the two-band flux correlation parameters, q12, q23, and q34, also increases the search reliability, especially for periodic variable stars. Saturation during any of the survey phases can also lead to anomalously large values of var_flg. Thus, constraints for a high reliability search for variables in W1 would be: