


| Date (UTC) | MJD | Scan ID | Event |
|---|---|---|---|
| 9/29/2010 | 55468.777510 | 08744a | Primary cryogen tank exhaustion, End of 3-Band Cryo Survey |
| 9/29/2010 | 55468.778656 | 08745a | Start of Post-Cryo survey operations and first-pass processing |
| 10/26/2010 | 55495.927201 | 09565b | Reaction wheel friction parameter update |
| 11/05/2010 | 55502.341844 | 09760a | Updated Post-Cryo image calibrations introduced in the first-pass processing |
| 01/09/2011 | -- | 11817b | Second inertial sky coverage completed |
| 02/01/2011 | 55593.435983 | 12514b | Final Post-Cryo survey scan start |
| 02/01/2011 | 55593.460432 | 12514b | Final frameset acquired; data acquisition terminated |
| 02/17/2011 | -- | -- | Flight-system decommissioned |
| 07/31/2012 | -- | -- | Post-Cryo Preliminary Data Release |
| 05/22/2013 | -- | -- | 2013 Post-Cryo Data Release |
The WISE telescope temperature is shown plotted as a function of date in Figure 1, beginning shortly before the end of the full cryogenic survey. The first rapid temperature increase marked the exhaustion of solid hydrogen in the outer tank of the two-stage cryostat, and the onset of the 3-Band Cryo phase. The Si:As focal plane assemblies continued to be cooled by hydrogen ice in the inner cryogen tank while the telescope and HgCdTe focal plane assemblies stabilized near 44 K. The W1 and W2 HgCdTe detectors continued to operate at sensitivities close to those during the full cryogenic survey phase, and the W3 detector operated at reduced sensitivity because of the increase in thermal emission from the warming telescope. On 29 September 2010 UTC, the WISE telescope began to warm rapidly once again, signaling the exhausting of hydrogen ice in the inner cryogen tank and the end of WISE cryogenic operations. The W3 detector quickly saturated because of rising temperatures, while the W1 and W2 detectors remained fully functional.
The beginning of the WISE Post-Cryo survey phase corresponds to the start of survey scan 08745a at 18:41:16 on 29 September 2010 UTC. The payload temperatures continued to rise through the Post-Cryo phase, reaching an equilibrium temperature near 73.5 K after about two months.
WISE surveyed in the Post-Cryo phase from 29 September 2010 until 1 February 2011 UTC, collecting data with the W1 and W2 detectors that still had sensitivity close to that in the full cryogenic survey phase. Approximately 70% of the sky was covered during this time, completing WISE's survey of the inner main asteroid belt, and a full second-epoch coverage of the inertial sky.
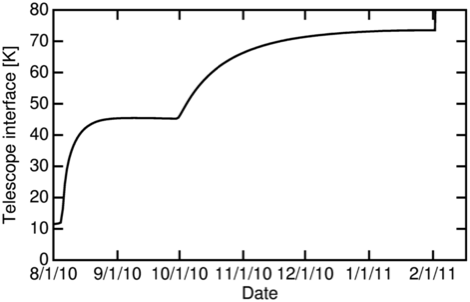 |
| Figure 1 - WISE telescope interface flange temperature as a function of date following the end of the full cryogenic mission phase. The Post-Cryo survey phase began on 29 September 2010, following exhaustion of solid hydrogen in the inner cryogen tank, and ended on 1 February 2011 when data acquisition was halted. |
As the HgCdTe focal planes warmed over the course of the Post-Cryo survey period, the number of high noise pixels increased by nearly a factor of five in W1 and two in W2 (see VIII.3.b.iv). The increase over time is apparent in visual comparisons between Single-exposure images from the beginning and end of the Post-Cryo period, as can be seen in Figure 2.
High noise pixels are identified and masked in the image calibration step of the Scan/frame Pipeline processing so that they can be handled correctly by downstream source detection and extraction modules. Masked noisy pixels are excluded or interpolated over during the source photometric measurements. However, as the number of masked pixels increases, the precision of photometry will decrease slightly. Therefore, although the W1 and W2 detectors operated during the Post-Cryo phase at sensitivities close to those of the full cryogenic phase, the precision of the Post-Cryo photometry will not be as good as from full cryo data.
| 3/24/2010 | 9/30/2010 | 2/1/2011 | |
|---|---|---|---|
| W1 | 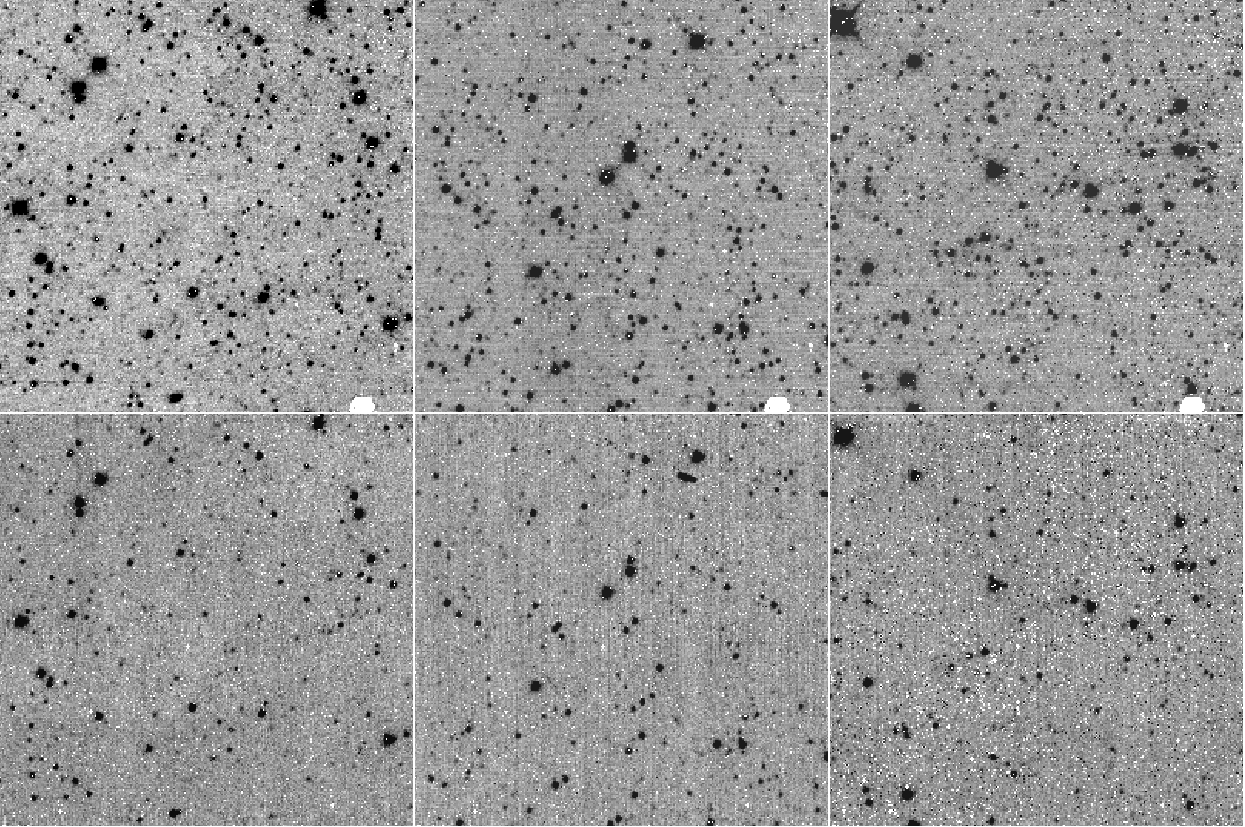 |
||
| W2 | |||
| Figure 2 - Montage showing the same 254x254 pixel (12'x12') regions of the W1 (top row) and W2 (bottom row) focal planes on Single-exposure images near the south ecliptic pole taken at different times during WISE operations. The first column shows All-Sky Release W1 and W2 Single-exposure images taken on 24 March 2010 UTC during the full cryogenic survey phase. The center and right columns show Post-Cryo Release Single-exposure images taken on 30 September 2010 and 1 February 2011 UTC, the second and final days of the Post-Cryo survey period, respectively. | |||
 |
| Figure 3 - The RMS of multiple Single-exposure measurements of the same sources plotted as a function of the mean source magnitudes for sources in a 1.6°x1.6° region near α,δ=121.6°,+19.6°. The blue curve is from the All-Sky Release photometry and the green curve is from Post-Cryo Release photometry. Although the Post-Cryo and All-Sky Release data reach the same depth, the precision of the Post-Cryo photometry is lower because of the more noisy pixels. |
Intermittent performance of the saturated pixel encoding for the W1 and W2 HgCdTe detectors that began during the 3-Band Cryo survey phase continued in the Post-Cryo phase. The on-board electronics in the WISE payload compared each of the nine individual reads of each pixel to predefined threshold values that indicated the onset of saturation. If the threshold was exceeded, the output pixel was set to a flag values (32,752 to 32,761) that indicate in which sample saturation was detected, rather than the measured slope of the ramp. These flag pixel values are recognized in the image calibration pipeline module (IV.4.a) and used to set values in the Single-exposure Bit Mask images that are used in downstream processing to recognize the presence of saturated pixels.
When the temperatures of the W1 and W2 HgCdTe detectors rose above 32K, the operating temperature during the full cryogenic survey, saturation encoding became intermittent because rising detector bias levels caused the saturation signal level to be reached before the threshold level was reached. The W1 and W2 detector offset levels were adjusted to compensate for the changing temperature six times during the Post-Cryo phase, and the threshold levels for tagging saturation were adjusted downward to account for the decreasing dynamic range. Despite this, saturated pixel flagged remained intermittent, as shown in Figure 5 of VII.3.b.iv.1.
The Post-Cryo second-pass data processing incorporated the saturation encoding recovery process that was developed for the 3-Band Cryo second-pass processing. Although saturated pixels were identified and masked out during source extraction, the measured fluxes for saturated sources in the 2013 Post-Cryo Release Source Working Database are systematically brighter than measurements of the same sources in the All-Sky Release Catalog, as discussed in VIII.3.e. The flux overestimation increases with increasing source brightness. The origin of this bias is not believed to be in the saturated pixel encoding, but more likely it is associated with changes in the wings of the PSF during the Post-Cryo survey phase.
Saturation encoding recovery was not employed during the first-pass processing that produced the Post-Cryo Preliminary Release products. As a result, there are many more unflagged saturated pixels in the Post-Cryo Preliminary Release images than in the 2013 Post-Cryo Release images. Photometry of saturated sources in the Preliminary Post-Cryo Release Source Database may badly underestimate the true brightness, and contamination by image artifacts produced by bright stars will be underflagged.
WISE employed the same scanning and survey strategy during the Post-Cryo mission phase that was used during the cryogenic survey phases. As described in III.4, WISE continued to scan the sky along great circles approximately perpendicular to the Earth-Sun line. Single-exposures were acquired using the normal freeze-frame scanning technique that acquired new W1, W2 and W3 framesets each 11 sec. Adjacent exposures within a scan overlap by approximately 10%, and the orbital precession rate produces ~90% overlap near the ecliptic plane between adjacent scans.
A small adjustment was made to the spacecraft reaction wheel friction parameters in the attitude control system on 26 October 2010 UTC. This update did not impact survey strategy in any way. However, there is a small change in the source position reconstruction residuals related to the optical distortion model that appeared just following the time of this update (see VIII.3.c).
A sky map showing the nominal Single-exposure depth-of-coverage obtained during the Post-Cryo survey is shown in Figure 4. Post-Cryo scans covered approximately 72% of the sky with at least one exposure depth in two broad ecliptic longitude ranges, 89.4°<λ<221.8° and 280.6°<λ<48.2°. There is diminished coverage between 89° and 97° longitude because the start of the Post-Cryo survey period coincided with a moon avoidance maneuver. In these maneuvers, the scan longitude is moved back to reobserve areas that may have been affected by scattered moonlight, and then is advanced quickly to catch up with the average scan stepping cadence. The Post-Cryo observations started during the "catch-up" phase resulting in lighter than normal coverage. That same region was also observed at the end of the 3-Band Cryo survey phase (see Figure 3 in VII.1.a.iv), so the total net coverage obtained between 3-Band and Post-Cryo phases is similar to other longitude ranges. As in the full cryogenic and 3-Band Cryo survey phases, the average coverage depth achieved near the Ecliptic plan is 12-13, and the coverage increases towards the Ecliptic poles as the scan paths converge. Because of the moon-avoidance maneuver, multiple frame depth coverage starts near 97.1° longitude, and the sky area covered with multiple exposures is approximately 70%.
During the Post-Cryo survey period, 3775 survey scans were performed, numbered 08745a - 12514b, and 901,274 Single-exposure framesets were acquired. The Post-Cryo Release includes all of these framesets.
The Post-Cryo observations provide a second independent epoch of coverage for much of the sky surveyed during the WISE cryogenic survey. WISE completed its second complete coverage of the inertial sky on 9 January 2011 UTC so the final three weeks of the Post-Cryo survey provided a third independent observation epoch for nearly 20% of the sky.
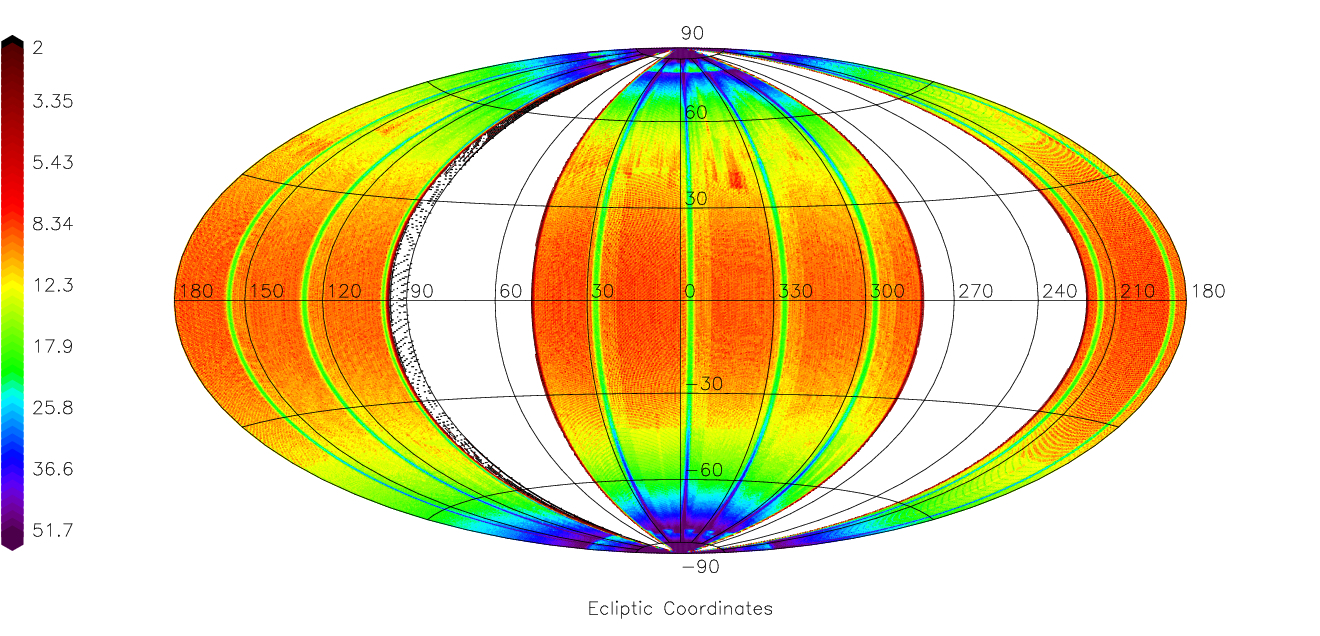 |
| Figure 4 - Ecliptic projection sky map showing the average raw frameset depth-of-coverage computed in 14'x14' spatial bins during the WISE Post-Cryo survey phase. Colors encode the average depth-of-coverage indicated by the key on the left side of the diagram. |
Last Updated: 17 May 2013