


II. The WISE All-Sky Data Products
2. Source Catalog
Contents
- Column Descriptions
- Source Selection Criteria
- General Properties
- Photometric Properties
- Astrometric Properties
The WISE All-Sky Release Source Catalog contains positions and
four-band photometry for 563,921,584 objects detected in
18,240 Atlas Tiles.
Each Catalog
entry gives positions, magnitudes, astrometric and photometric uncertainties,
flags indicating the reliability and quality of the source characterizations,
and associations with any nearby
2MASS Point and
Extended Source Catalog.
The All-Sky Release Catalog contains many types of sources, and is not
restricted to point-like objects such as stars and unresolved galaxies.
The Catalog contains both point-like objects and close multiple sources,
detections on the disks and spiral arms of resolved galaxies and clumps or
filaments in Galactic nebulosity if they meet the Catalog criteria described
in sections II.2.b below and
V.3.
A summary of the properties of the Source Catalog and a detailed
Catalog format description
are presented below. More detailed descriptions of photometric
and astrometric characteristics of the Catalog are presented in section
VI. Descriptions of processing algorithms
used to generate the Source Catalog can be found in section
IV.
Users are strongly encouraged to read the
Cautionary Notes before using the All-Sky Release Catalog.
b. Source Selection Criteria
Sources in the All-Sky Release Catalog were drawn from a
Working Database (WDB) of
all detections made on the coadded Atlas Images
that was generated during second-pass
Multiframe Pipeline processing.
The WDB contains 847,809,235 entries, significantly more than the
Source Catalog because many of the entries are spurious detections of noise
and image artifacts. The reliability of the WISE Source Catalog was
achieved by selecting entries in the WDB that satisfy
the quality criteria that are described in V.3
and summarized in Table 1.
WDB entries that were not selected for inclusion inthe All-Sky
Release Source Catalog are contained in the Reject
Table.
Table 1 - Source Selection Criteria for the All-Sky Release Source Catalog (V.3)
| Category | Parameter | Criteria | Purpose |
|---|
Detection Reliability:
Extractions must have
a "reliable" detection in at least one band. A reliable band-detection
must satisfy all these criteria in that band. | Signal-to-Noise Ratio (SNR) | Source must be detected with a SNR>5 | Rejection of
spurious detections of low SNR noise excursions. |
| Frame coverage | There must be
five or more single-exposure images on which the source can be measured
and characterized. | Rejection of single-exposure
transient events that can persist into the coadded images because
of low coverage. |
| Artifacts | Extraction must not
be identified as a spurious
detection of an image artifact from a bright source,
including one of the planets.
Sources believed to be real, but whose measurements are affected by
artifacts, are included in the Catalog, and are flagged using
the cc_flags parameter. |
Rejection of spurious detection of image artifacts. |
| Tile Boundaries | | Extraction lies >50" from
the
edge of the Atlas Tile | To avoid truncation of the largest
measurement aperture used for the source aperture photometry. |
| Duplicate Source Entries | | For multiply-detected
sources in Atlas Tile overlap regions, the apparition farthest from
its respective Tile edge is selected. Sources in the overlap regions
not multiply-detected are always included in the Source Catalog if
they satisfy all other selection criteria. | To eliminate
duplicate extractions of the same source |
c. General Properties
- Total Number of Entries in the All-Sky Release Catalog: 563,921,584
- Band-detection Statistics for the All-Sky Release Catalog
The number of sources in the All-Sky Catalog with >2σdetections
in each of four WISE bands, and with detections in combinations of
bands, are listed in Tables 2 and 3, respectively. The overwhelming
majority of objects in the Catalog have detections in the W1 band
because that band has the best flux sensitivity
(see VI.3.a) and because the spectral
energy distributions of most objects on the sky favors detection
in that band. Because WISE source detection and characterization
is done on all bands simultaneously, the preponderance of detections in
W1 means that source properties in this band will be weighted
heavily in the measurements in all bands.
Although more than 99% of the All-Sky Release Catalog sources
have W1 detections, there are over 5 million objects that aren't detected
in W1. These rare objects may be among the most interesting measured
by WISE (e.g. Kirkpatrick et al. 2011, ApJS, 197, 19;
Liu et al. 2011; Eisenhardt et al. 2012).
Table 2 - Number of Catalog Entries With >2σ Detections in Each Band
| Band | Number of Objects | Percentage of Total |
|---|
| W1 | 558,595,964 | 99.1 |
| W2 | 471,057,750 | 83.5 |
| W3 | 170,326,893 | 30.2 |
| W4 | 61,049,159 | 10.8 |
Table 3 -Band-Detection Combinations (>2σ per Band) in the Catalog
| Band-Combination | det_bit | Number | Percentage of Total |
|---|
| W1-W2-W3-W4 | 15 | 41,339,822 | 7.3 |
| W2-W3-W4 | 14 | 196,155 | <0.1 |
| W1-W3-W4 | 13 | 2,591,107 | 0.5 |
| W3-W4 | 12 | 1,796,871 | 0.3 |
| W1-W2-W4 | 11 | 12,880,072 | 2.3 |
| W2-W4 | 10 | 34,456 | <0.1 |
| W1-W4 | 9 | 2,151,812 | 0.4 |
| W4 | 8 | 58,864 | <0.1 |
| W1-W2-W3 | 7 | 109,835,173 | 19.5 |
| W2-W3 | 6 | 303,942 | <0.1 |
| W1-W3 | 5 | 11,906,923 | 2.1 |
| W3 | 4 | 2,356,900 | 0.4 |
| W1-W2 | 3 | 305,889,698 | 54.2 |
| W2 | 2 | 578,432 | 0.1 |
| W1 | 1 | 72,001,357 | 12.8 |
- Sky Coverage
The approximate coverage of the All-Sky Release Source Catalog is
42,195 deg2, or 99.86% of the entire sky (VI.2).
Although WISE imaged every point on the sky multiple times during its
full cryogenic mission phase, some of the Single-exposure framesets
had degraded quality and therefore were not utilized in the
construction of the Source Catalog (V.2.c). Sources extracted by the Multiframe Processing
pipeline were required to have at least five independent
Single-exposures available for there measurement, so the loss
of frame depth-of-coverage sometimes resulted in loss of Catalog effective
sky coverage.
Obscuration by the scattered light and other image artifacts from bright
sources and nebulosity also diminishes the effective coverage of the Catalog.
Some of the most prominent coverage gaps caused by degraded frame quality and
losses due to bright sources and source confusion can be seen in the
All-Sky Release Catalog source count map shown in
Figure 1.
WISE All-Sky Release Catalog sky coverage is discussed in detail in
VI.2.
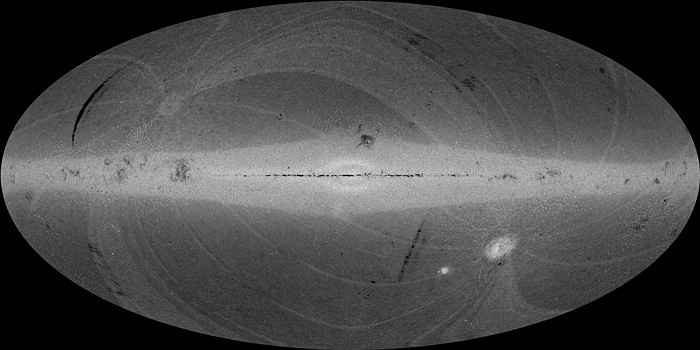 |
| Figure 1 - Hammer galactic projection showing a
grey-scale surface density map of All-Sky Release
Source Catalog
entries computed in 0.2°x0.2° spatial bins. The full range
is 0 to 1166 per bin (0 to 29,150 deg-2).
Galactic north is towards the top and galactic longitude increases
to the left. |
- Spatial Distribution of Catalog Sources
As can be seen in Figure 1, the spatial distribution of All-Sky Release
Catalog sources is concentrated towards the Galactic plane. Half of the
Catalog entries are found within approximately ±25° of the
plane, as shown in Table 4 which gives the cumulative Catalog source counts
as a function of galactic latitude. However, the source density
profile with galactic latitude, shown in Figure 2, flattens
significantly beginning at ~40° from the plane.
The nearly uniform source density at the high latitudes indicates
that Catalog is dominated by extragalactic sources.
Table 4 - Catalog Cumulative Source Counts
| |b| < (deg) | Number | Percentage of Total |
| 2° | 32,922,390 | 5.8 |
5° | 81,847,817 | 14.5 |
10° | 155,531,242 | 27.6 |
15° | 217,512,089 | 38.6 |
20° | 268,792,953 | 47.7 |
30° | 351,094,792 | 62.3 |
40° | 416,763,089 | 73.9 |
50° | 469,573,884 | 83.3 |
60° | 511,182,765 | 90.6 |
70° | 540,669,661 | 95.9 |
80° | 558,194,753 | 99.0 |
90° | 563,921,584 | 100.0 |
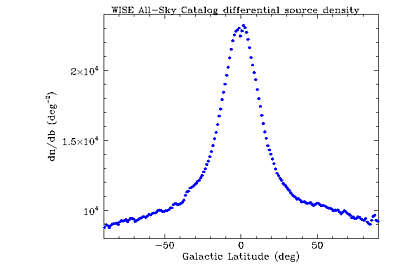 |
| Figure 2 - Differential All-Sky Release Catalog source density
measured in one degree wide bands of galactic latitude, plotted as a
function of galactic latitude. |
The detailed distribution of Catalog sources on the sky
is a complex function of brightness in each band because
of the variation of source density on the sky, the survey depth-of-coverage,
and the effects of confusion on source extraction.
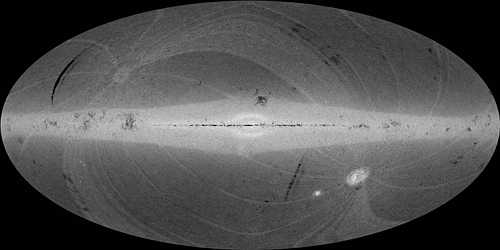
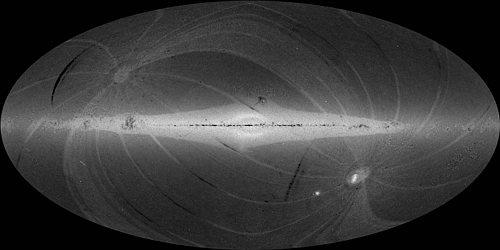
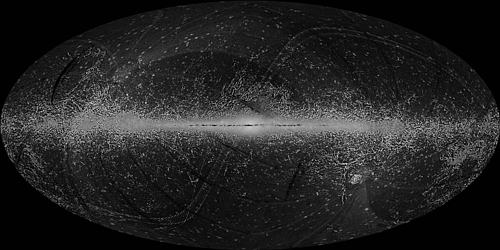
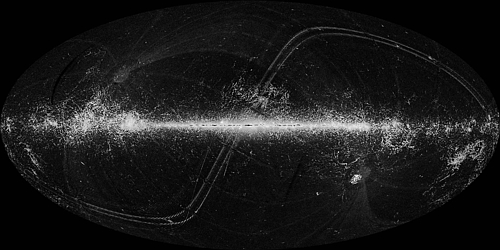
Figures 3-6 are animated GIF images that show sky maps of the
surface density of Catalog sources in 0.5 magnitude bins in
progressively fainter magnitude slices. Completeness in the Galactic Plane
begins to fall off quickly in the short wavelength bands because of confusion
in high source density regions. The distribution of sources at higher
Galactic latitudes remains relative uniform until W1<17.0, W2>16.0,
W3>12.5 and W4>9.0 mag. For fainter magnitudes, the non-uniform
depth-of-coverage produced by survey
strategy begins to dominate the distributions.
Another feature that is seen in the animations in Figures 5 and 6,
is that the distributions of sources in W3 and W4 begin to trace the
zodiacal dust bands and halos around bright stars at SNR<5-7. This
is a by-product of the multiband source detection and extraction algorithms
used in the WISE data reduction pipelines
(c.f. IV.4.b and IV.v.c).
The surface density of W1 and W2 sources is high over virtually the entire sky.
When W1 and W2 sources fall on regions that have extended, structured
background emission in W3 and W4, such as the dust bands, comet trails, or
scattered light halos around very bright stars, the higher SNR W1 and W2
extractions will sometimes "pull along" apparent, albeit low SNR detections
at the longer wavelengths. These low SNR "shadow" detections in W3 and W4
can be numerous, and thus standout in the cumulative count maps shown
in the thumbnail images for Figures 5 and 6.
 |
 |
| Figure 3 - W1: Linear stretch; Range = 0-1057.3 |
Figure 4 - W2: Linear stretch; Range = 0-1005.3 |
 |
 |
| Figure 5 - W3: Log stretch; Range = 0-1055.5 |
Figure 6 - W4: Loglog stretch; Range = 0-702.2 |
| Hammer galactic projection grey-scale maps showing the
cumulative counts >2-σ source densities computed in 0.2°x0.2°
spatial bins, by band, in the WISE All-Sky Release Catalog. Click on the
thumbnails to view animated GIF images that show the Catalog count
maps for each band in slices of 0.5 mag intervals at progressively fainter
levels. The center of the maps corresponds to galactic coordinates
0°,0°. Galactic north is towards the top of the maps and
galactic longitude increases to the left. |
- All-Sky Release Source Catalog Depth
WISE Source Catalog is >95% complete for sources with
SNR>20 in unconfused regions of the sky that have five or more
Single-exposure depth-of-coverage (see VI.5).
This corresponds approximately to magnitudes of W1=16.6,
W2=16.0, W3=10.8 and W4=6.7 mag. The effective depth of the Catalog will vary around the sky, decreasing in regions with low depth-of-coverage or higher
levels of confusion due to high source density or complex and
bright emission backgrounds.
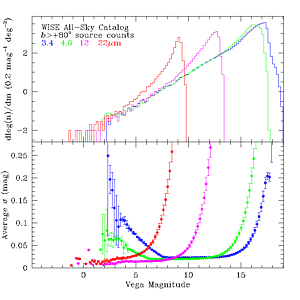
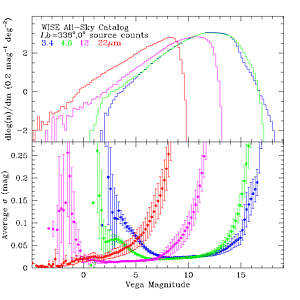
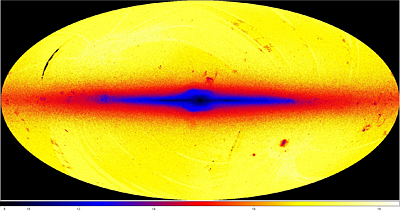
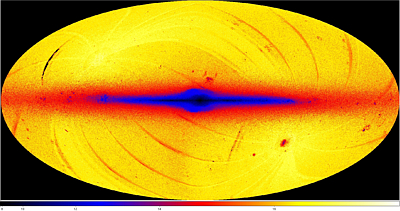
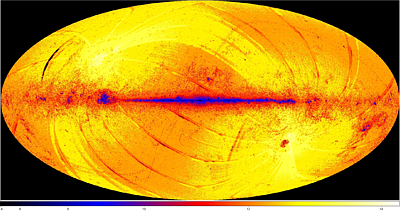
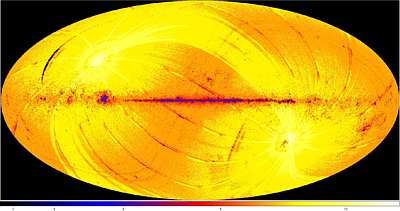
The variation of Catalog depth with source density is illustrated
in the top panels of Figures 7 and 8 which show examples of source count
log histograms for two representative regions in the All-Sky Release
Source Catalog. Figures 7 shows the region within 10° of the north
Galactic pole and 8 shows a region on the galactic plane.
Although these two regions have similar survey depths-of-coverage,
the peak of the source count curves (a proxy for the completeness
level) occur at fainter magnitudes in the north Galactic pole field
where source densities are much lower. The differences are most
apparent in the W1 and W2 bands, and less prominent in the longer
wavelength bands where the surface density of sources is lower
all over the sky. The spatial distribution of the source count curve
peak magnitudes are shown in Figures 9-12.
The effect of survey-depth-of-coverage can be seen in all bands,
with fainter completeness levels towards the ecliptic poles, and
in the multiple-epoch coverage regions.
The loss of depth due to confusion in the Galactic Plane
is prominent in W1 and W2. In W3 and W4, there is an additional gradient
in the depth with ecliptic latitude because of the varying impact of the
zodiacal emission.
 |
 |
| Figure 7 - (top) Differential WISE Source
Catalog counts in the 313 deg2 within 10° of the north Galactic
pole. (bottom) Average photometric uncertainty as a function of source
brightness in this region. |
Figure 8 - (top) Differential WISE Source Catalog counts in a 10°x10° region centered on
l,b=338°,0°.
(bottom) Average
photometric uncertainty as a function of source brightness in this
region. |
 |
 |
| Figure 9 - W1 |
Figure 10 - W2 |
 |
 |
| Figure 11 - W3 |
Figure 12 - W4 |
| False-color maps showing the spatial distribution
of the peak magnitude of the differential source count histograms computed in
0.2x0.2 deg spatial bins. The color scale in the images gives
the peak magnitude color encoding for each band. The
Maps are Hammer projections in galactic coordinates.
The centers correspond to ecliptic coordinate 180°,0°.
Galactic north is towards the top, and galactic longitude increases
towards the left. |
- Saturation and Bright Source Detection Limits
Listed in Table 5 are the approximate magnitudes at which
50% of the sources in the
All-Sky Release Source Catalog are saturated.
Photometry is performed for sources brighter than the saturation limits
by PSF-fitting to the non-saturated
wings of the source profiles. The quality of the photometry for
saturated sources is progressively degraded. Brighter than the extraction
limit levels given in Table 5, saturation sources could no longer
be reliably extracted and may be missing from the Catalog.
Table 5 - Point Source Saturation and Bright Source Extraction Limits
| Band | Saturation Limit1
(mag) | Extraction Limit2
(mag) |
|---|
| W1 | 8.1 | 2.0 |
|---|
| W2 | 6.7 | 1.5 |
|---|
| W3 | 3.8 | -3.0 |
|---|
| W4 | -0.4 | -4.0 |
|---|
Notes:
1 Approximate values. Onset of saturation can vary
by ~1mag depending on BG and sub-pixel location (see VI.3.d)
2 Approximate values. Sources brighter than these
limits may not be present in the Catalog. (see VI.3.c.i)
|
d. Photometric Properties
- Photometric Accuracy and Sensitivity
Photometry of bright, non-saturated sources in the Preliminary Release
Source Catalog has an accuracy of ~2-3% (VI.3.a).
Photometric SNR>5 is achieved for sources with W1<16.6, W2<15.6,
W3<11.2 and W4<8.0 mag in the unconfused regions of the sky with
at least 8 independent coverages (VI.3.b).
The characteristic sensitivity
of the Source Catalog varies significantly around the sky because
of the variable depth-of-coverage, background emission levels and
source confusion. The bottom panels of Figures 5 and 6 show the average
quoted W1, W2, W3 and W4 profile-fitting photometric uncertainties in
0.2 magnitude bins for high and low galactic latitude regions in the Catalog,
respectively. The vertical bars show the RMS dispersion in the mean uncertainties in
each brightness. Photometric uncertainties increase at the bright end
because of the onset of saturation. Uncertainties increase towards
fainter flux levels as photon noise increasingly dominates the measurements.
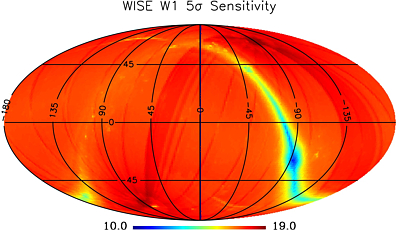
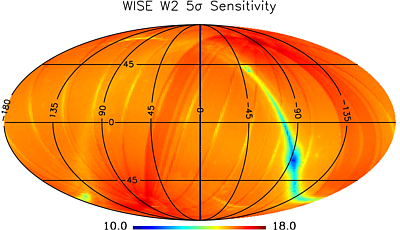
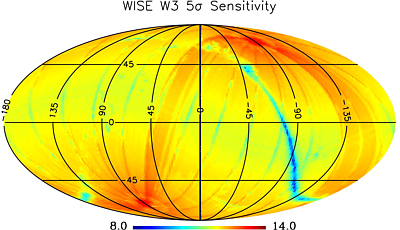
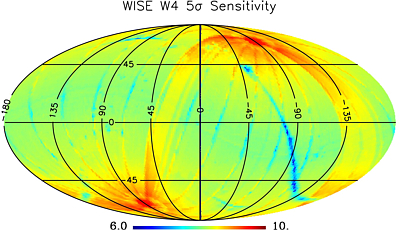
The variation of photometric sensitivity around the sky is illustrated
in Figures 13-16. These diagrams show sky maps of the
magnitude for which the mean photometric measurement uncertainty in each band is
equal to 0.217 mag, corresponding to 5σ, within each Atlas Tile.
Sensitivities are lowest in the high source density regions of the Galactic plane.
Sensitivities increase towards the Galactic poles, but also in regions
with deeper Single-exposure coverage, such as in the portion of the
sky surveyed twice during the full-cryogenic mission phase. There is also
an ecliptic latitude-dependence in the achieved sensitivity because
of the presence of the zodiacal background. The achieved sensitivity
also varies along the "spokes" produced by the Moon avoidance maneuvers. It is minimized near the Ecliptic plane because of quality degradation due to
scattered moonlight, but increases at high Ecliptic latitudes because of the double-coverage produced by the Moon avoidance maneuver. See VI.3.a for more details.
 |
 |
| Figure 13 - W1 | Figure 14 - W2 |
 |
 |
| Figure 15 - W3 | Figure 16 - W4 |
| False-color equatorial projection sky maps showing the spatial
variation of average magnitude at which the average source SNR=5
in the All-Sky Release Source Catalog
(see VI.3.a). The colors denote the mean SNR=5
magnitude per Tile, according to the color bars in each Figure. |
- Band-Band Photometric Performance
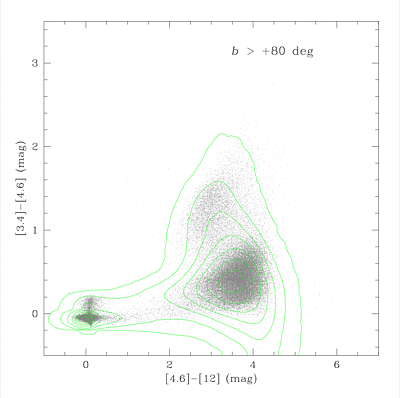
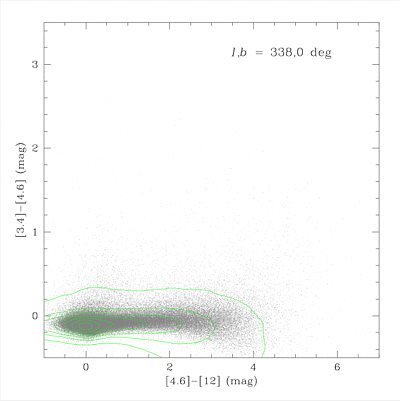
W1-W2-W3 (3.4-4.6-12 μm) color-color diagrams drawn from high and low
galactic latitude regions in the All-Sky Release Source Catalog
are shown in Figures 17 and 18, respectively.
The locations in color-space for various classes of astrophysical
objects are shown in the annotated
version of Figure 17.
 |
 |
| Figure 17 - WISE 3.4-4.6-12 μm color-color diagram for a
116 deg2 region at l,b=225°,-55°. Green
contours trace the density of sources in color bins. Click
here for an
annotated version of the color-color diagram showing the location
of different classes of objects.
|
Figure 18 - WISE 3.4-4.6-12 μm color-color diagram for a
116 deg2 region at l,b=338°,-1°. Green
contours trace the density of sources in color bins. |
e. Astrometric Properties
The astrometric properties of the WISE All-Sky Release Source Catalog
are discussed in detail in VI.4.
Catalog source are reconstructed with respect to the
2MASS
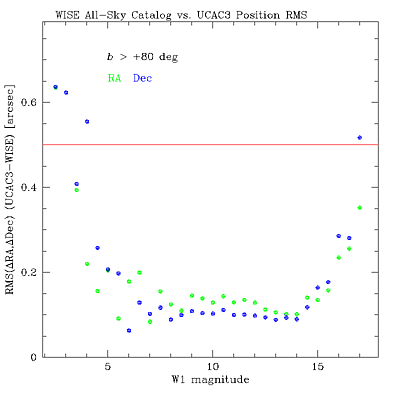
Point Source Catalog reference frame. The RMS accuracy of the
reconstructed positions with respect to the 2MASS PSC for unsaturated
sources with SNR>50 in unconfused regions of the sky is approximately
200 mas on each axis, with biases typically less than 50 mas.
The accuracy is approximately 400 mas at SNR=20, and decreases
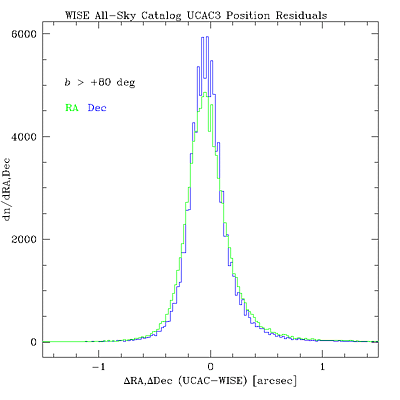
towards fainter flux levels. Figures 19 and 20 illustrate
the distribution of position differences between the WISE All-Sky
Catalog and those in the USNO CCD Astrograph Catalog (UCAC3). WISE Catalog
position reconstruction did not use any reference to UCAC3, so that
Catalog provides a good independent check on the WISE astrometry.
Because of proper motion of 2MASS reference stars used by WISE
in the ten years between the surveys, there can be systematic position
biases between the WISE reference frame and the ICRS of up to
approximately 150 mas depending on direction on the sky (see
VI.4.f).
 |
 |
| Figure 19 - Histogram of RA (green) and Dec (blue) position
residuals between UCAC3 and WISE All-Sky Catalog for sources with SNR(W1)>20
within 10° of the north Galactic pole. |
Figure 20 - RMS of the UCAC3-WISE RA (green) and Dec (blue) position
residuals as a function of WISE W1 source magnitude for sources within 10°
of the north Galactic pole |
Last Updated: 2012 July 26


