


The fundamental objective of WISE is to produce a sensitive mid-infrared all-sky survey. In the 3 to 30 μm wavelength range imaged by WISE the most sensitive previous all-sky surveys include: COBE/DIRBE, which achieved point source sensitivities of roughly 60 Jy at 3.5 and 50 Jy at 4.9 μm (Smith, Price, and Baker 2004 ApJS, 154, 673); IRAS, which achieved 0.2 Jy at 12 and 25 μm; and AKARI, which achieved 50 mJy at 9 μm and 90 mJy at 18 μm (section 7.6 of AKARI/IRC All-Sky Survey Point Source Catalogue Version 1.0 Release Note (Rev.1). WISE sensitivity varies with position on the sky due to changes in the depth of coverage and the zodiacal foreground emission, both of which improve towards the ecliptic poles, and in the local source density (primarily due to Galactic sources) which limits sensitivity because of confusion.
Taking 10 exposures per position as the depth of coverage achieved over 95% of the sky in W1 and W2, and 9 coverages in W3 and W4, zodiacal emission levels near the ecliptic, and high Galactic latitude source density, the estimated WISE sensitivities are given in Table 1 below.
| Noise Model | ||||
|---|---|---|---|---|
| Band | External Check2 | COSMOS3 | 95%4 | Internal Repeatability5 |
| W1 (3.4 μm) | 0.0686/16.83 | 0.035/17.36 | 0.037/17.30 | 0.039/17.23 |
| W2 (4.6 μm) | 0.098/15.60 | 0.070/15.97 | 0.079/15.84 | 0.083/15.78 |
| W3 (12 μm) | 0.86/11.32 | 0.59/11.73 | 0.67/11.59 | 0.75/11.46 |
| W4 (22 μm) | 5.4/8.0 | 4.7/8.1 | 5.1/8.0 | 5.1/8.0 |
Notes to Table 1
|
||||
Table 1 includes sensitivity estimates from comparison to external photometry from Spitzer and 2MASS, as well as from the profile-fit photometry noise model and the internal repeatability of WISE photometry. Because the local source density does not vary in repeated WISE observations of a given source, the internal repeatability estimates do not include the effect of confusion.
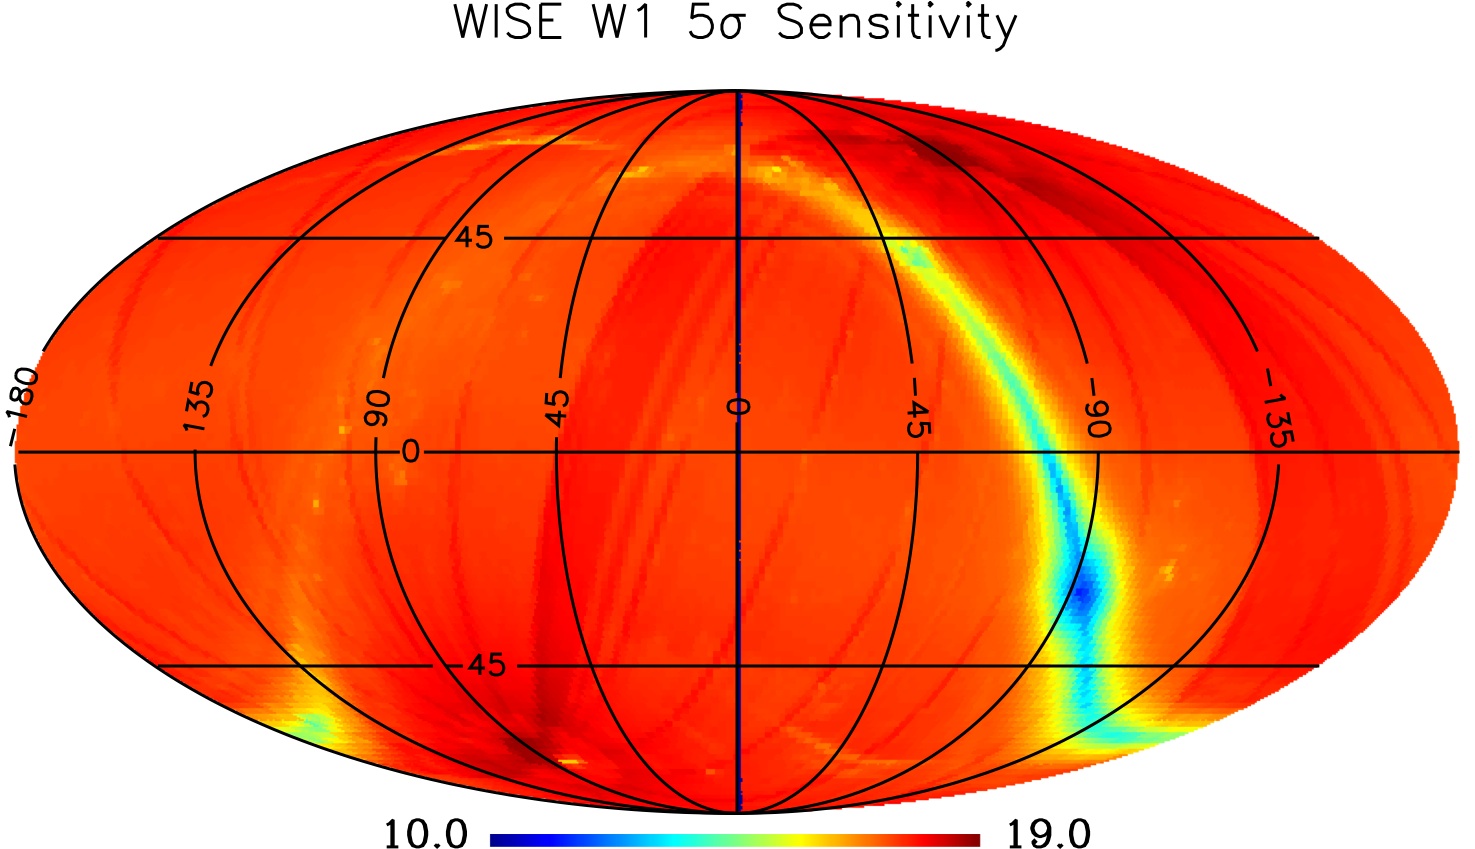
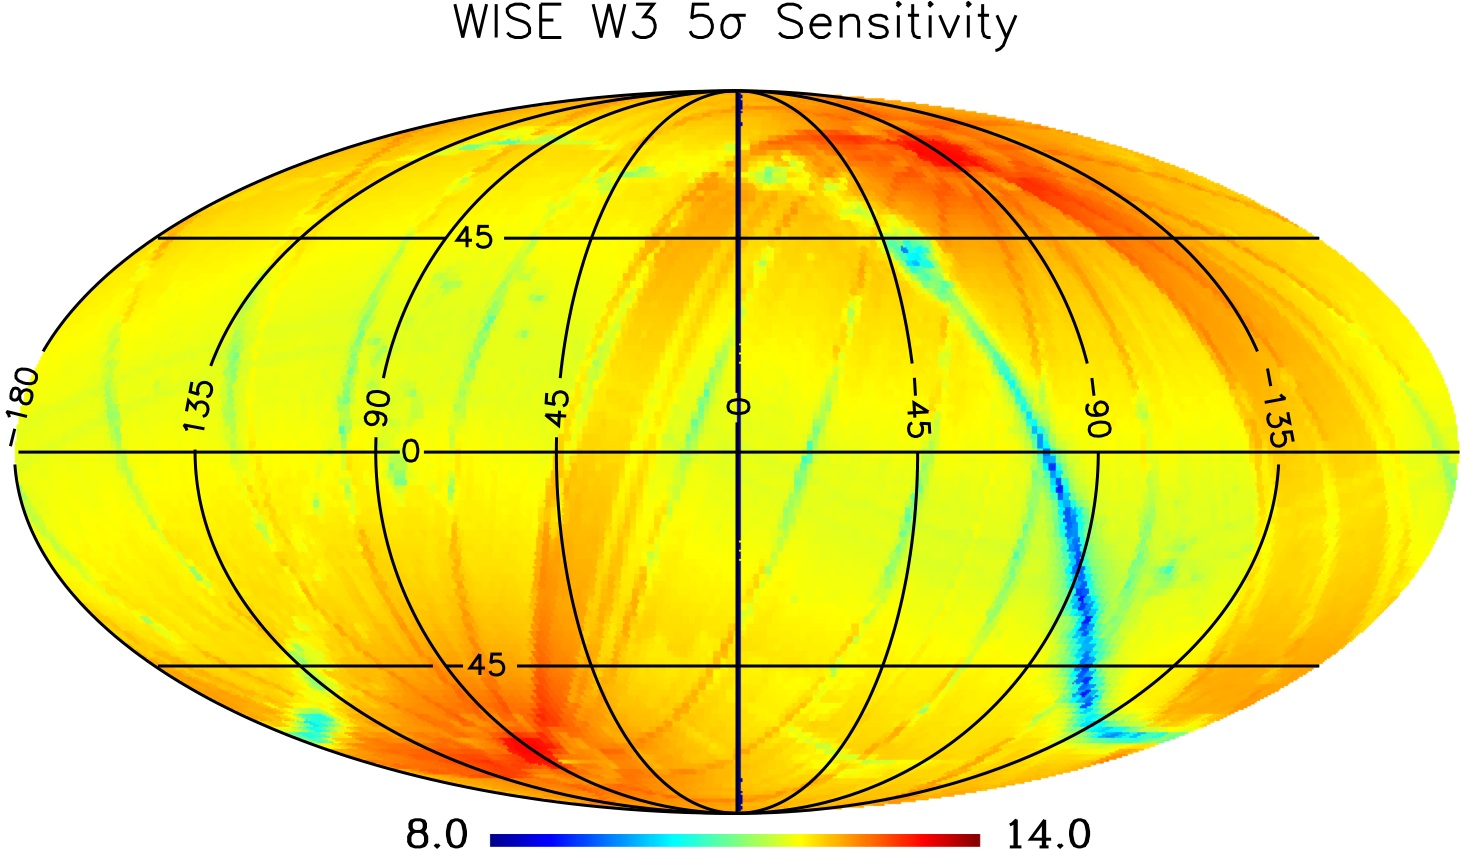
Figure 1 shows the variation over the sky of the the magnitude corresponding to SNR 5 from the noise model for the four WISE bands, plotted in equatorial coordinates. Table 2 lists the magnitudes corresponding to SNR 5, 7, and 10 from the noise model for each tile in order of declination. For convenience the tile identification (coadd_id), and equatorial, Galactic, and ecliptic coordinates are also provided.
 |
 |
| W1 | W2 |
 |
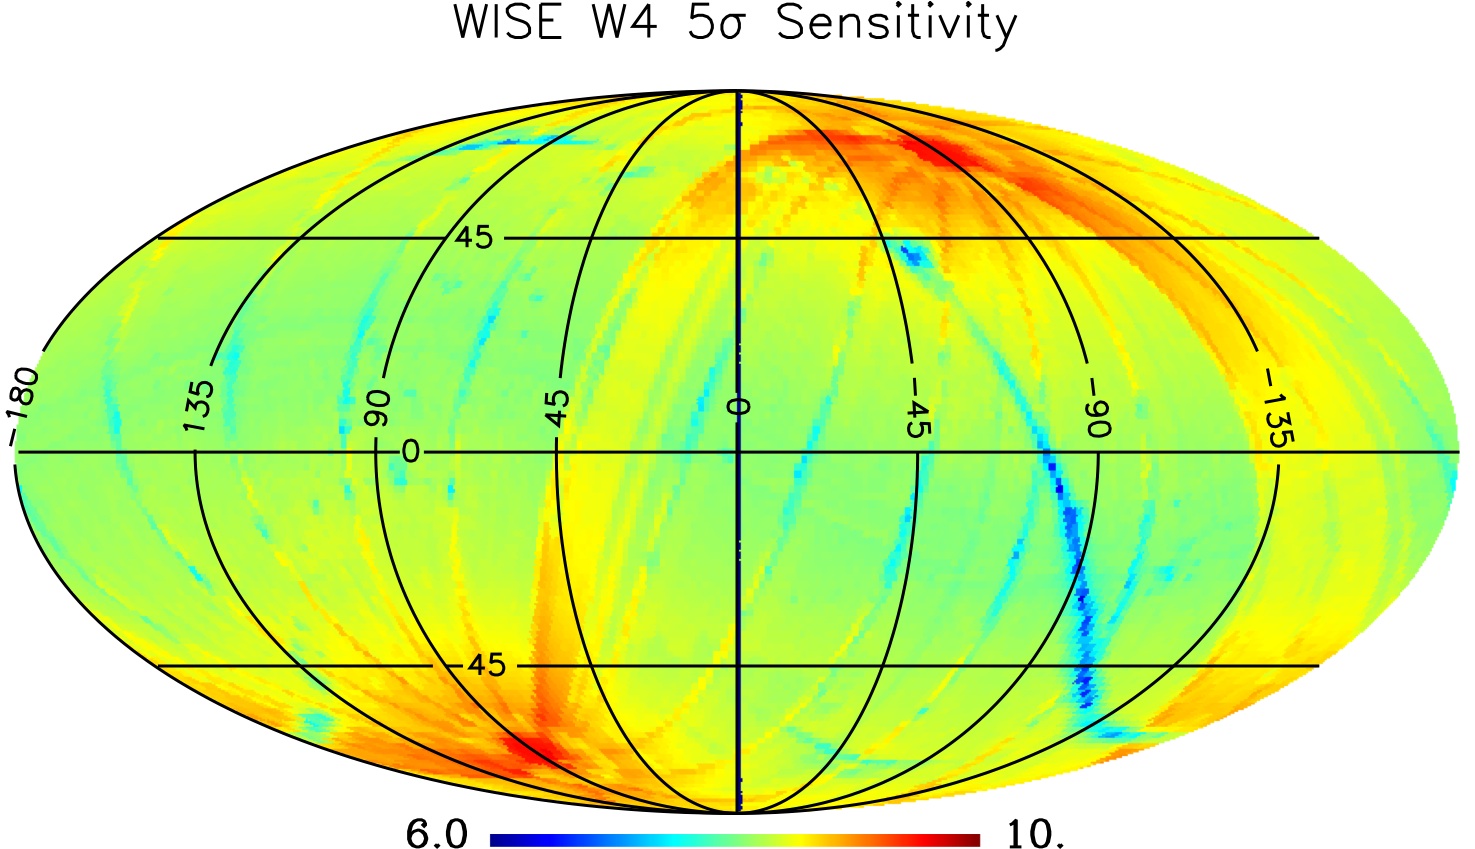 |
| W3 | W4 |
| Figure 1 - Magnitude at SNR 5 vs.position on the sky from the WISE All-Sky Release noise model (equatorial projection). | |
Sensitivity can be assessed using WISE measurements of sources whose flux densities are known from other data at similar wavelengths. The 3.6 and 4.5 μm bands of the Infrared Array Camera (IRAC) on the Spitzer Space Telescope are similar to the W1 and W2 bands on WISE, and the 24 μm band of Spitzer's Multi-band Imaging Photometer for Spitzer (MIPS) is similar to the WISE W4 band. Of course Spitzer data is only available for a small fraction of the all-sky area covered by WISE. When available, Spitzer's 85 cm primary mirror (vs. 40 cm for WISE) and 1.2" IRAC and 2.55" MIPS 24 μm pixels (vs. 2.75" for W1, W2, W3; 5.5" for W4) provide image quality twice as good as achieved by WISE in similar bands. Spitzer exposure times on a source are often many times longer than WISE, which with the larger aperture and better image quality allow Spitzer to reach fluxes many times fainter than WISE. Therefore magnitudes from Spitzer in these bands (hereafter referred to as [3.6], [4.5], and [24]) provide a "truth set" for evaluating the limiting flux sensitivity in W1, W2, and W4.
For the 12 μm W3 band, there is no closely comparable Spitzer filter, and other data sources do not provide substantial numbers of sources with fluxes below 1 mJy. However when expressed in Vega magnitudes, the 5σ sensitivity of W3<12 corresponds to much brighter stellar photospheres than the >14 mag 2MASS limits (Skrutskie et al 2006, AJ, 131, 1163). The < 3" FWHM of 2MASS is also better than WISE, so by selecting stars based on their 2MASS morphologies and 2MASS, W1, and W2 colors, W3 magnitudes can be predicted.
The S-COSMOS survey of the Hubble Space Telescope COSMOS field mapped this two square degree field with IRAC and MIPS to much greater depth than WISE. The COSMOS field, centered at at 10h 00m 28.6s +02d 12m 21.0s, is especially useful for assessing the WISE All-Sky Release sensitivity. This is because with its relatively low ecliptic latitude (-9°) it has a WISE coverage depth of 11 exposures, close to the 95% sky coverage depth achieved by WISE, which with its high galactic latitude (-60°) makes it representative of the performance achieved by WISE in unconfused regions over the bulk of the survey.
IRAC [3.6] and [4.5] magnitudes were downloaded from the S-COSMOS IRAC 4-channel Photometry June 2007 Catalog from IRSA. with the requirement that they have clean SExtractor and data quality flags and have 3.6 μm flux densities > 30 μJy in the r=1.9" aperture after applying the 0.765 correction factor specified in the README file. To ensure a compact source whose flux could be compared to the WISE point source fitting photometry measurements, the SWIRE 3.6 μm aperture corrected flux in the 4.1" radius aperture was required to be less than 10% larger than that in the 1.9" radius aperture after applying the relevent correction factors. This returned 14,482 sources.
Those sources were uploaded and matched to W1 and W2 photometry in the WISE Pass2 Multiframe Working Database, requiring a matching radius of 2", that the WISE extended source flag (ext_flg) was 0 and the proximity to a 2MASS extended source (xscprox) was null, and that the contamination and confusion flags (cc_flags) were 0 in all four WISE bands. Note that this database includes sources found in the Reject Table which are not in the released Catalog, because they have WISE SNR<5. This matching process returned 11,604 sources.
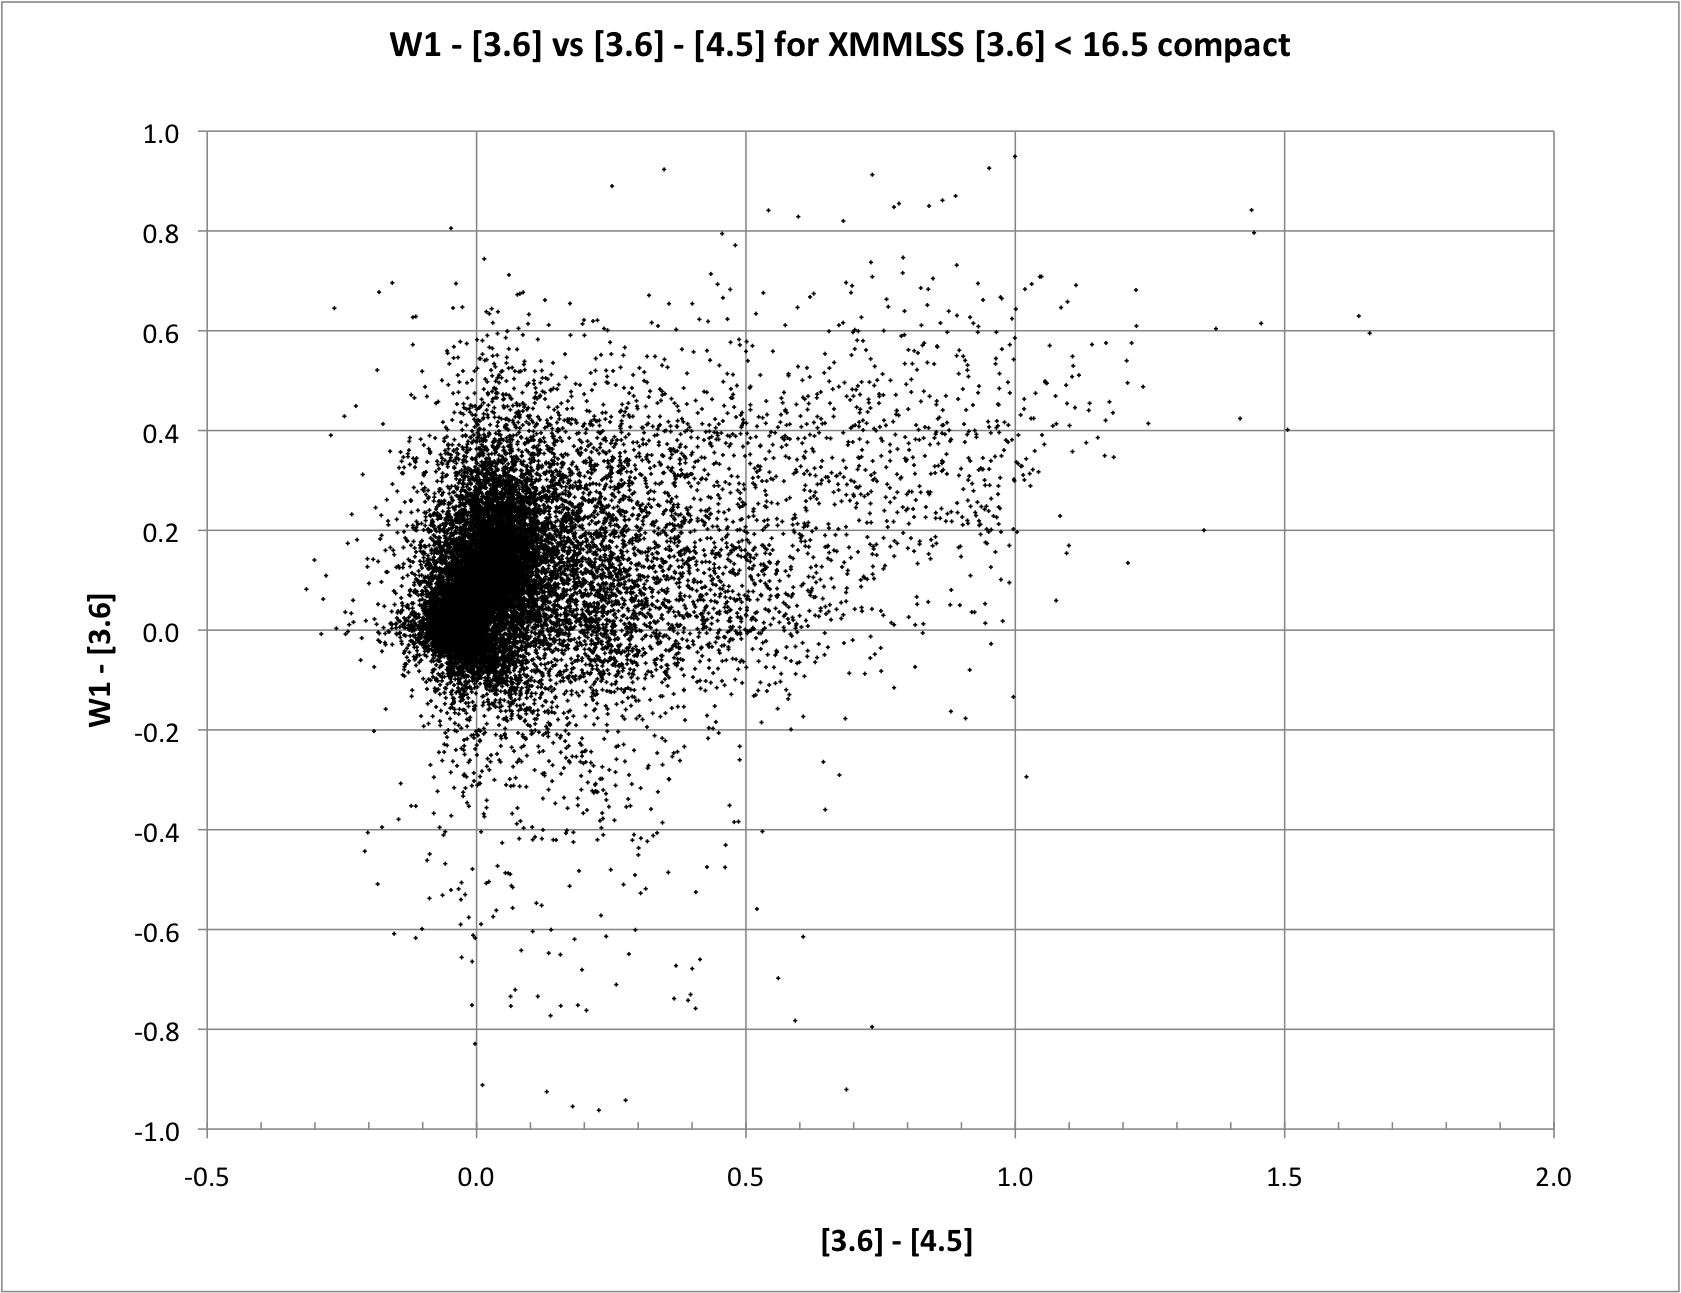
In addition, to minimize potential color terms and the possibility of intrinsic variations in source SEDs, the Vega-system color was required to be -0.1 < [3.6]-[4.5] < 0.0. This choice was motivated by examining the W1 - [3.6] vs [3.6] - [4.5] color distribution (Figures 2 and 3) of similar sources extracted from the Spitzer SWIRE XMM-LSS field. Adding this restriction leaves 1,921 sources which should have comparable IRAC [3.6] and WISE W1 photometry.
 |
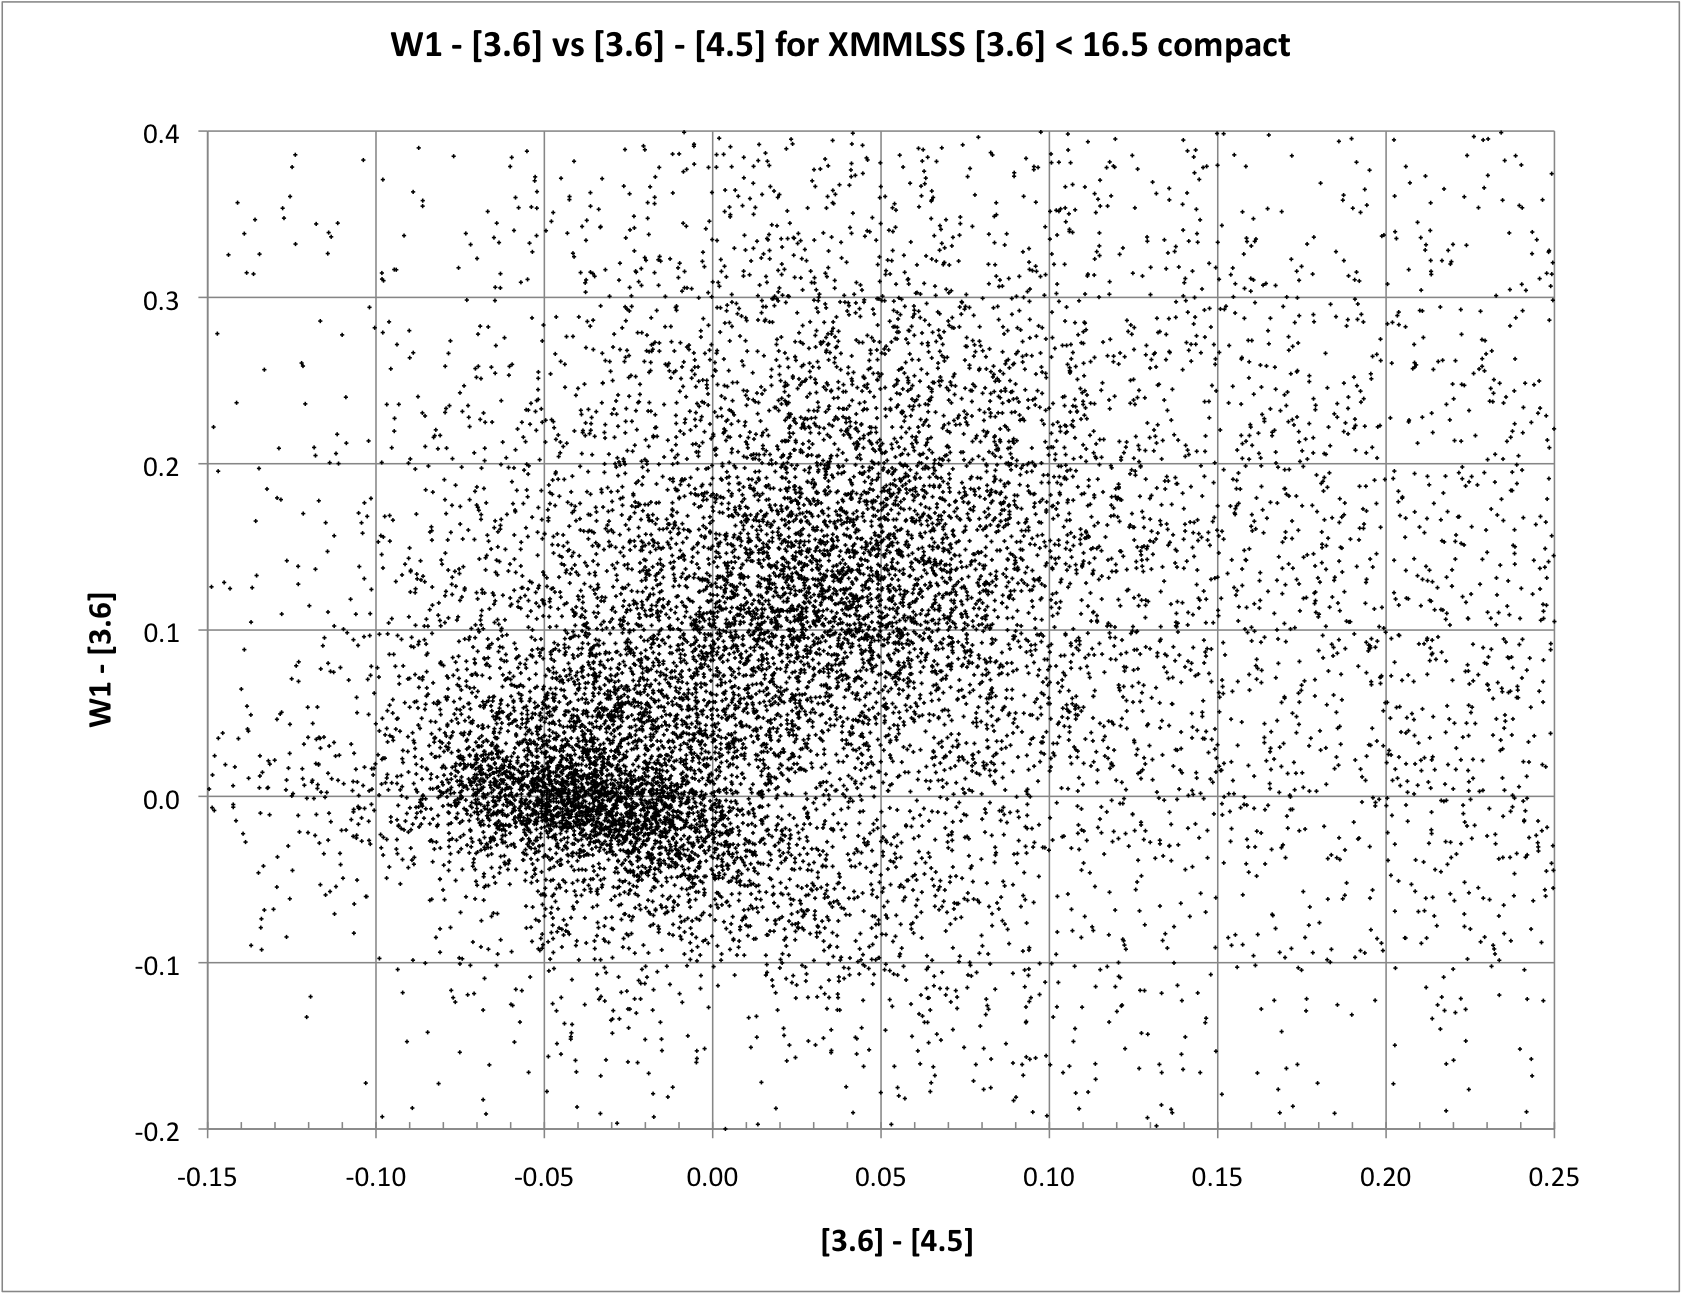 |
| Figure 2 - WISE W1 - SWIRE [3.6] photometry vs. [3.6] - [4.5] in the XMM-LSS field. Although the wavelength of W1 (3.4 μm) is similar to the IRAC 3.6 μm band, the two filters are not identical, and the plot shows that W1 - [3.6] ~ 0.4{[3.6] - [4.5]}. | Figure 3 - Zoomed-in view of the WISE W1 - SWIRE [3.6] vs. [3.6] - [4.5] colors in the XMM-LSS field. The color distribution suggests that two populations - perhaps dwarf and giant stars - with close to zero color are present. |
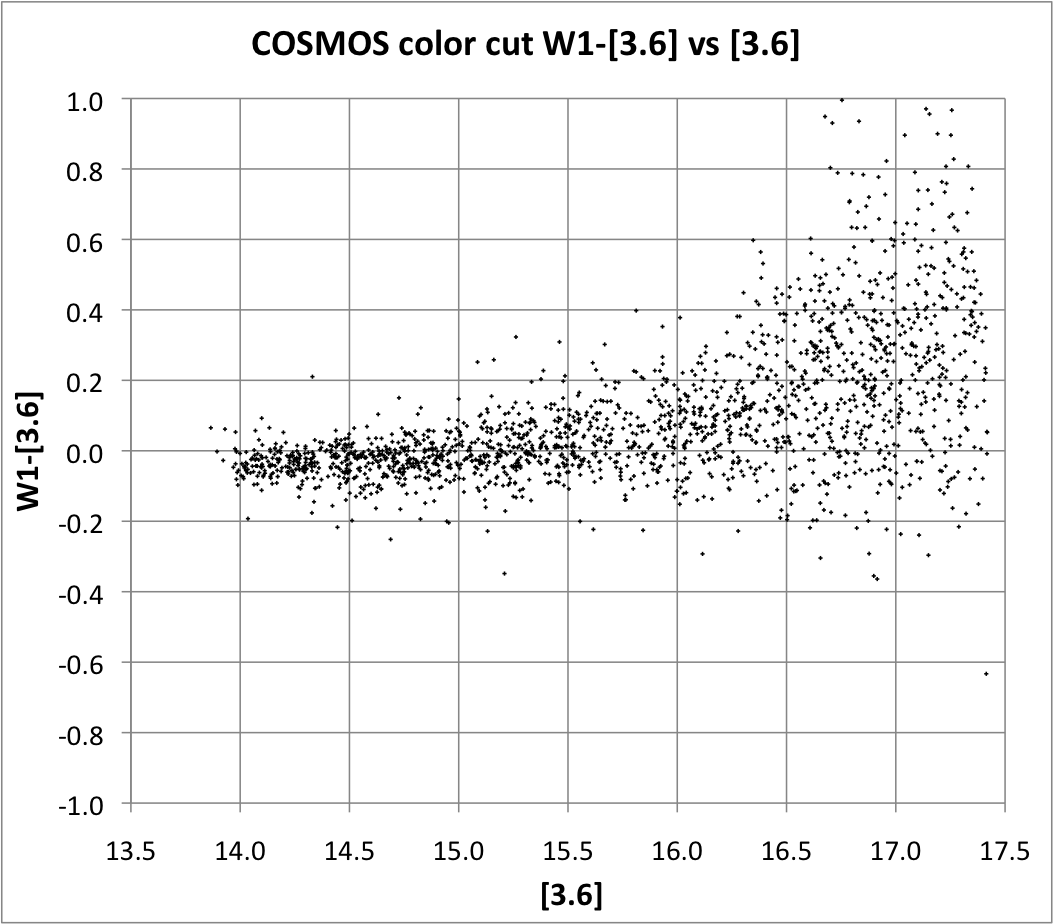
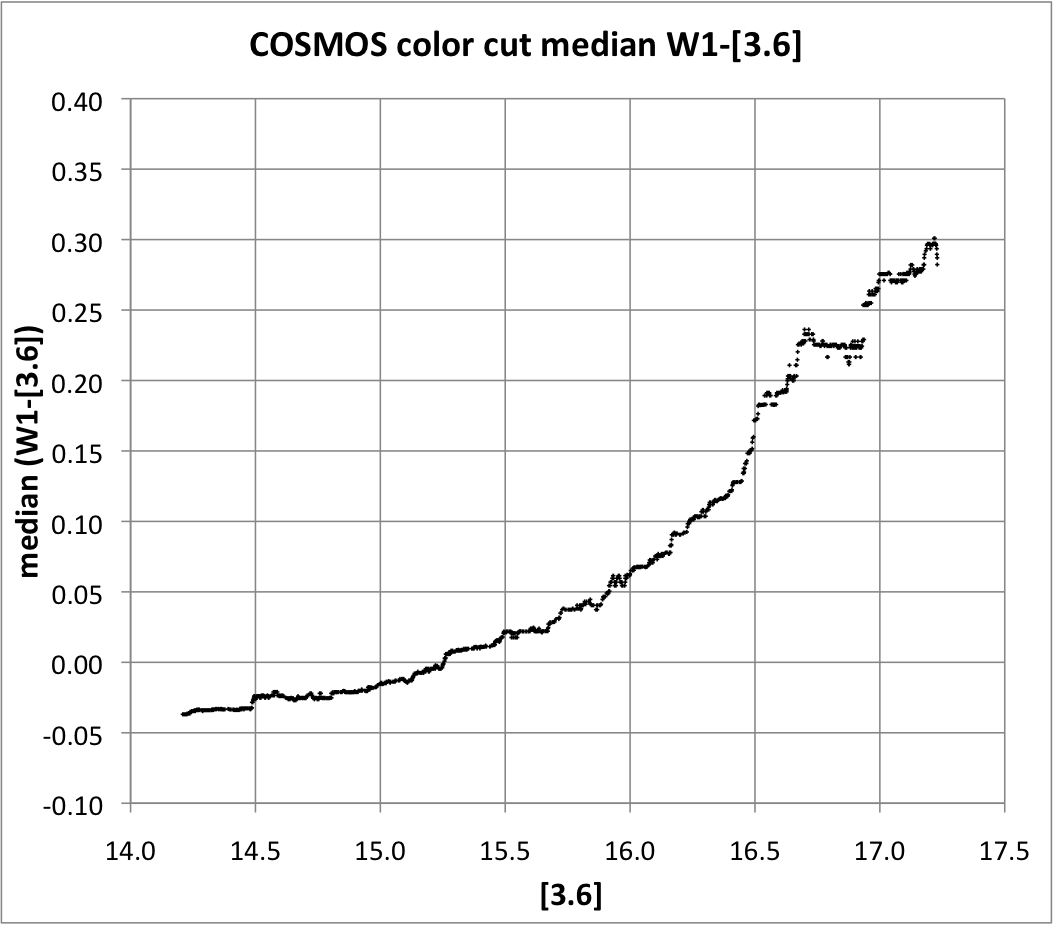
Figure 4 shows a plot of these COSMOS field stellar sources in W1-[3.6] vs [3.6]. The difference between W1 and [3.6] becomes systematically larger at faint [3.6] magnitudes, in the sense that the W1 magnitudes are larger (fainter) than the [3.6] magnitudes. Figure 5 shows this trend more clearly in a plot of the median difference between W1 and [3.6] vs [3.6] calculated for a moving window including 200 objects at a time. Section VI.3.c provides additional detail on this bias, which is not fully understood.
 |
 |
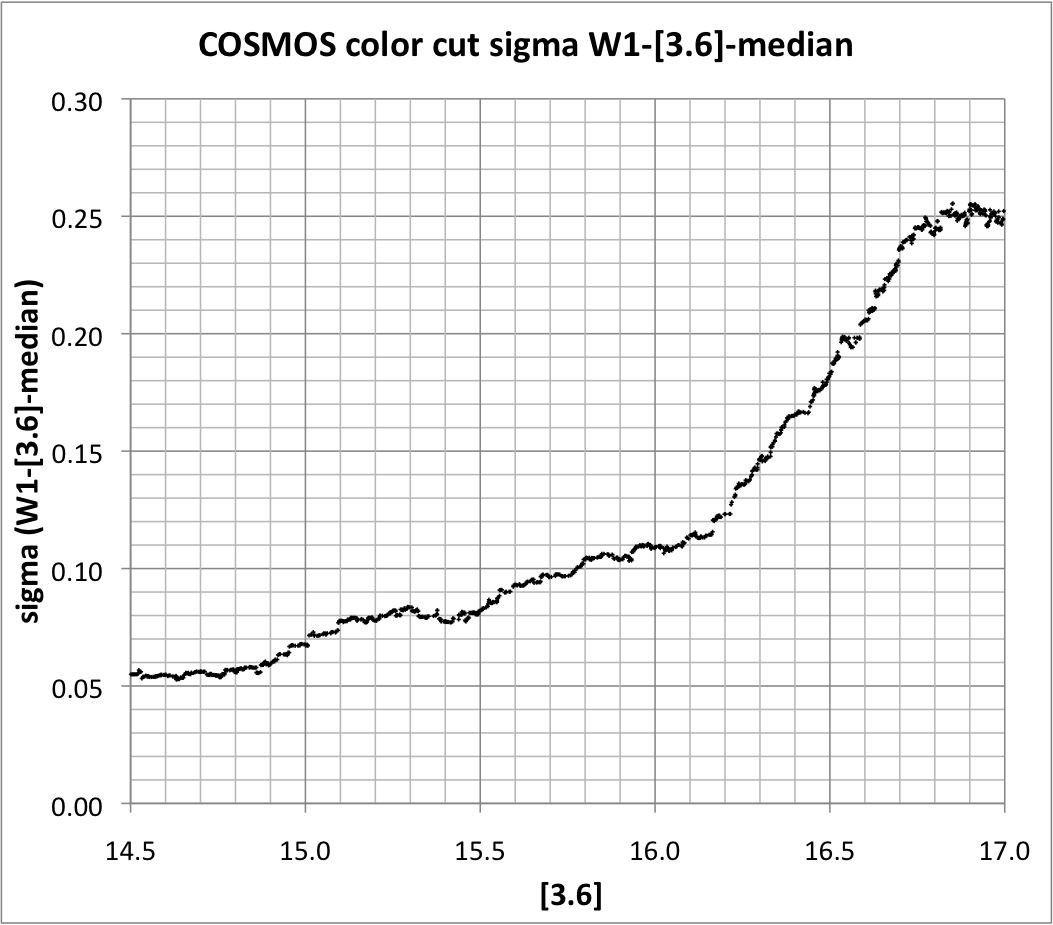 |
| Figure 4 - WISE W1 - Spitzer [3.6] photometry vs. [3.6] for stellar color sources in the COSMOS field. | Figure 5 - Median W1 - [3.6] color difference vs [3.6] for stellar color sources in the COSMOS field. | Figure 6 - rms of {W1 - [3.6] - median(W1-[3.6] from figure 5)} vs [3.6] for stellar color sources in the COSMOS field. |
To estimate the W1 sensitivity, the sigma in W1 - [3.6] - the running median shown in Figure 5 was calculated for a moving window including 200 objects at a time and plotted against the median [3.6] in that window in Figure 6. Since mag = 2.5log10(flux) = [2.5/ln(10)]ln(flux) and thus d(mag) = [2.5/ln(10)] df/f, the rms mag error corresponding to a given SNR=f/df is just 2.5/[SNR*ln(10)] or 1.086/SNR. For SNR=5, the running median rms in W1 - [3.6] is 0.217 mag at [3.6] = 16.64. As noted above, W1 magnitudes become systematically fainter than [3.6] magnitudes as [3.6] increases, so the W1 magnitude which corresponds to a 5σ sensitivity is W1=16.83. However, in the absence of a full understanding of the systematic photometric bias at fainter W1 magnitudes, we assume the correct flux density to associate with SNR 5 is given by that for W1 -[3.6] = 0, i.e. W1 = 16.64, or 68 μJy.
The same analysis has been applied to fields with deeper WISE coverage and Spitzer data. The 9 deg2 Spitzer Wide-area InfraRed Extragalactic Survey (SWIRE) XMM-LSS field, centered at 02h 21m 19.08s -04d 29m 58.0s, is at high galactic latitude (-60°), and has 23 coverages with WISE despite its a relatively low ecliptic latitude (-17.5°) because it was covered twice during the full cryogenic WISE mission. For the SWIRE XMM-LSS field we obtain SNR 5 at W1=17.02, and correcting for 0.24 mag of photometric bias, this corresponds to a flux density of 60 μJy. The 9 deg2 Spitzer Deep Wide Field Survey (SDWFS) is centered near 14h 32m +34d 00m, at high galactic (57°) and ecliptic (46°) latitude, and has 30 coverages with WISE. For the SDWFS field we obtain SNR 5 at W1=17.30, and correcting for 0.29 mag of photometric bias, this corresponds to a flux density of 53 μJy. The XMM-LSS and SDWFS values do not scale to the COSMOS value of 68 μJy by the square root of the COSMOS coverage depth (11) over their coverage depth, probably due to confusion noise.
A similar procedure to that for W1 was followed in comparing the W2 band to [4.5] COSMOS photometry. In this case no obvious color correlation between W2 - [4.5] and [3.6] - [4.5] is seen (Figure 7) so no color cut was applied, and there is only a slight trend for W2 magnitudes to become systematically fainter than [4.5] as a function of [4.5] magnitude (Figures 8 and 9). Incompleteness in W2 is apparent in Figure 8 for sources at magnitudes [4.5] > 16, and sources fainter than this were excluded from subsequent analysis, but this magnitude is well below the SNR 5 limit in W2.
 |
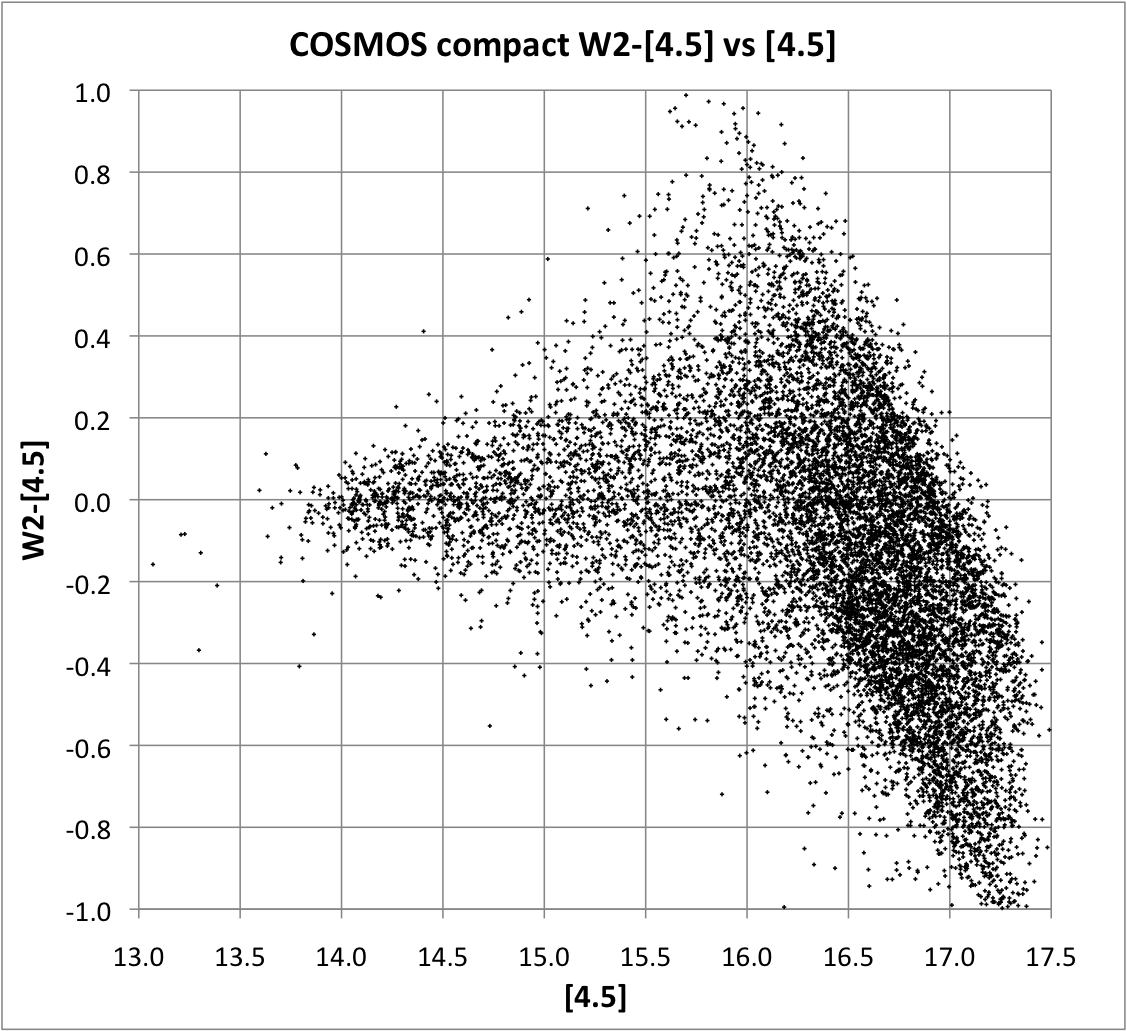 |
| Figure 7 - WISE W2 - [4.5] vs [3.6] - [4.5] for sources with W2 < 16 in the COSMOS field. | Figure 8 - W2 - [4.5] photometry vs. [4.5] in the COSMOS field. |
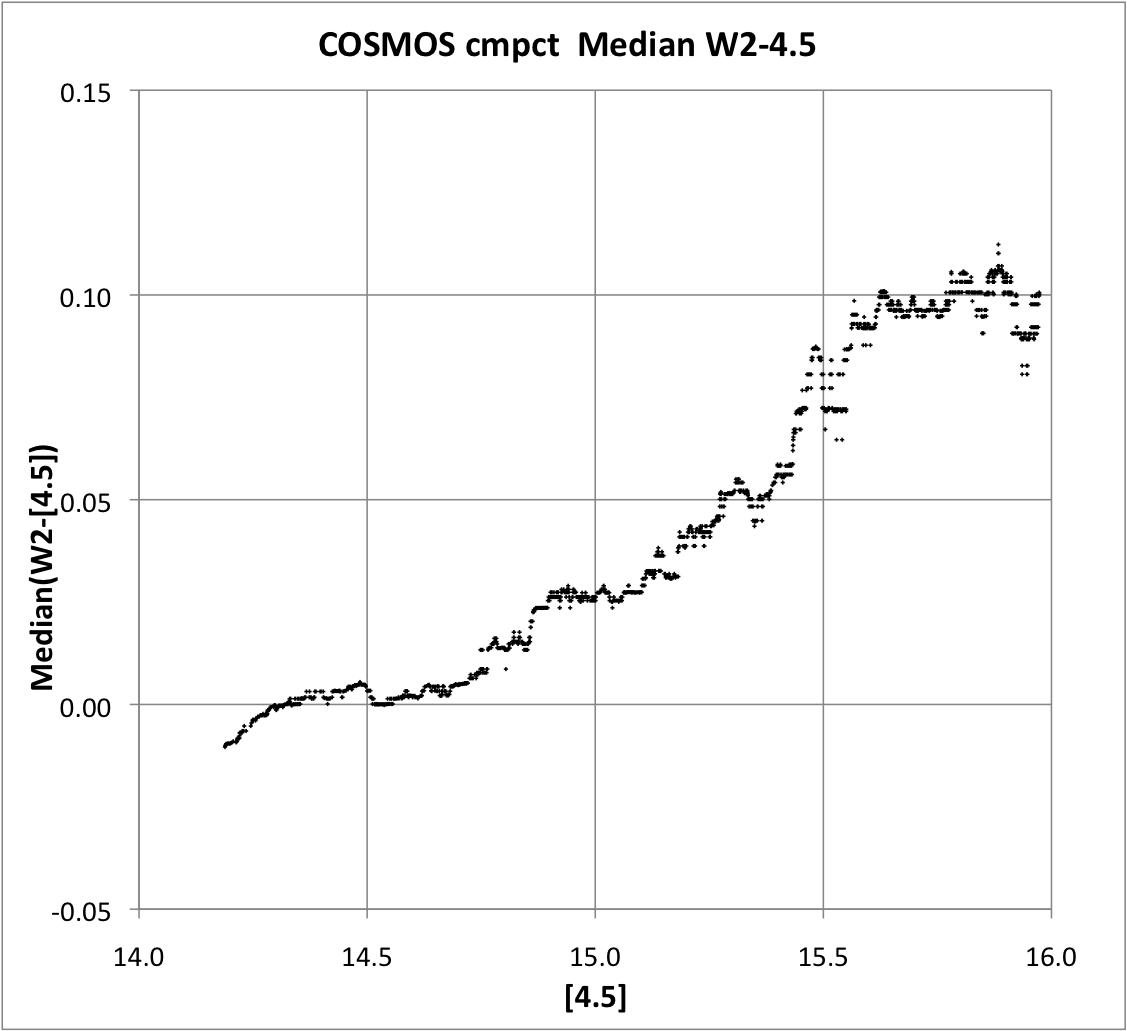
Figure 9 plots the running median of 400 sources in W2 - [4.5], which shows more clearly the slight trend for W2 magnitudes to become fainter than [4.5]. Figure 10 shows the running rms of 400 sources in W2-[4.5]-median(W2-[4.5]) vs. [4.5]. For this rms calculation 18 outlier points with W2 - [4.5] more than 3σ away from the local trend were excluded. The SNR 5 value is at [4.5]=15.53, which with the median offset at this magnitude of W2 - [4.5] = 0.07 results in SNR 5 for W2=15.60 or 98 μJy.
 |
 |
| Figure 9 - Median W2 - [4.5] photometry vs. [4.5] in the COSMOS field. | Figure 10 - rms of {W2 - [4.5] - median(W2-[4.5] from figure 9)} vs [4.5] in the COSMOS field. |
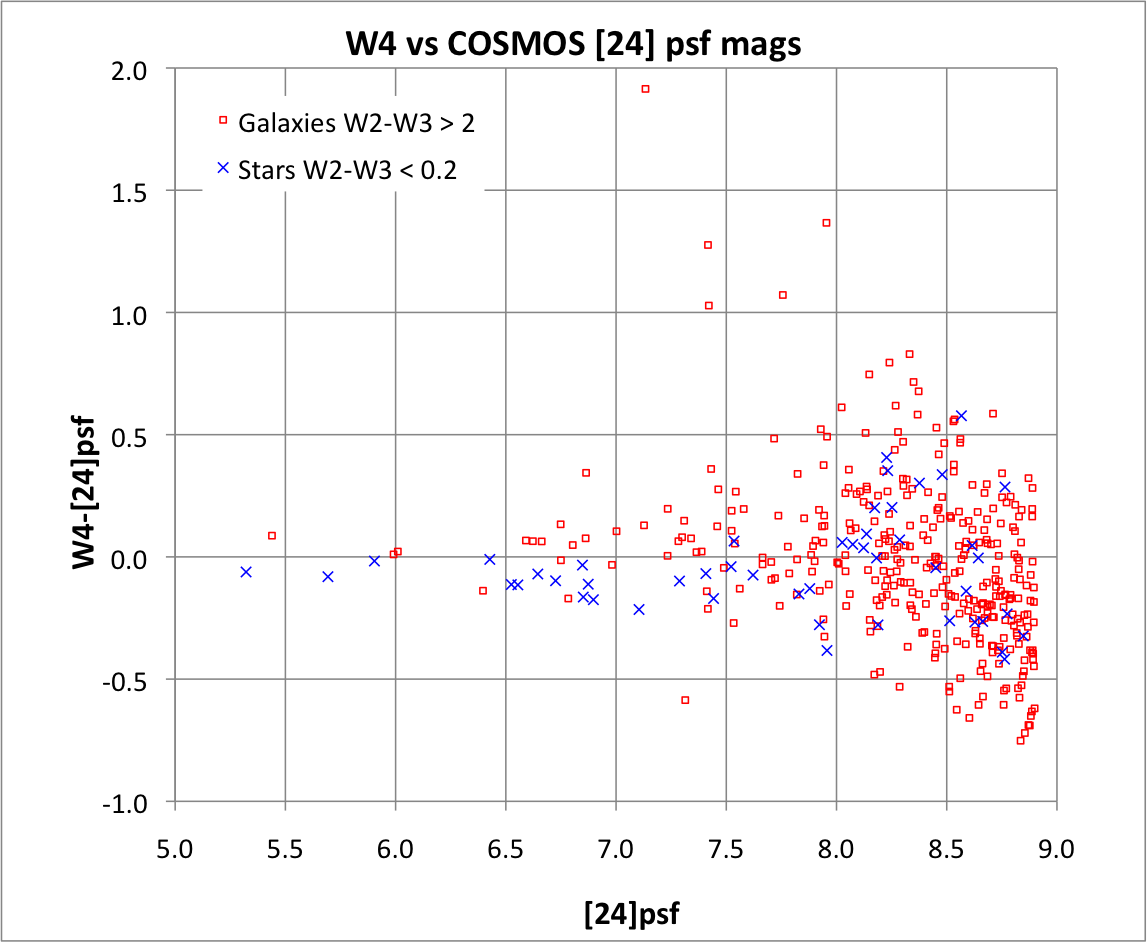
For the W4 to [24] comparison, the S-COSMOS MIPS 24 μm MAIN Photometry June 2007 Catalog was used, with a requirement that the 24 μm flux exceeded 2 mJy (after multiplying them by the 1.32 correction factor), resulting in 703 COSMOS sources. Note these [24] magnitudes are psf-fit values, unlike the aperture magnitudes used for [3.6] and [4.5]. Of these S-COSMOS sources, 396 were matched to the WISE catalog. Figure 11 shows W4 - [24] vs. [24] for these sources. Objects with blue W2 - W3 colors (W2 - W3 < 0.2; plotted blue in Figure 6) are likely stars, and have -0.10 magnitude median offset in W4 -[24] for W4 < 7.5. There is a gap in W2-W3 color beyond 0.2: all such sources (plotted red in Figure 11) have W2 - W3 > 2 and are likely galaxies, with a median W4 -[24] value of 0.07.
 |
 |
| Figure 11 - WISE W4 - Spitzer [24] photometry vs. [24] in the COSMOS field. | Figure 12 - rms(W4 - [24] - median) error vs [24] in the COSMOS field. |
Figure 12 shows the running sigma of 30 points in W4 -[24] corrected for the star or galaxy median value noted above, vs. [24]. Several outlier points apparent in Figure 11 with W4 - [24] > 1, and one near [24]=7.3, W4-[24]=-0.6, were excluded from the sigma calculation. This leads to an estimate for SNR 5 of approximately [24]=7.9, which after correcting for the 0.07 median galaxy offset corresponds to W4=8.0 or a flux density of 5.4 mJy.
As noted above, 2MASS stars were used as an external check on W3 sensitivity, as there is no suitably deep data set over a large area in similar band. The WISE Catalog allows direct queries on cross-matched 2MASS sources. An all-sky search on the Source Catalog was carried out for sources with 11 coverages in WISE band 3 (w3m=11); a single 2MASS counterpart (n_2mass=1) within 3" (r_2mass<3); not extended or close to a 2MASS extended source (ext_flg = 0 and xscprox is null); well detected in 2MASS (k_m_2mass<12 and k_msig_2mass<0.03); and with colors appropriate for stars hotter than spectral class F7 (-0.05<j_m_2mass - k_m_2mass<0.3 and k_m_2mass - w2mpro<0.1 and -0.05<w1mpro - w2mpro<0.05).
In addition, sources were required to have no contamination or confusion in any band (cc_flags = "0000"); only a single blend component (nb = 1); SNR>10 in W1 and 2 and >2 in W3 (ph_qual at least AAC); good PSF fits especially in W3 (rchi2<1.5 and w3rchi2<1.2); to have a Galactic latitude of at least 20° and be at least 30° from the Galactic Center, and to avoid the Large and Small Magellanic Clouds. These constraints yielded a total of 26,432 sources.
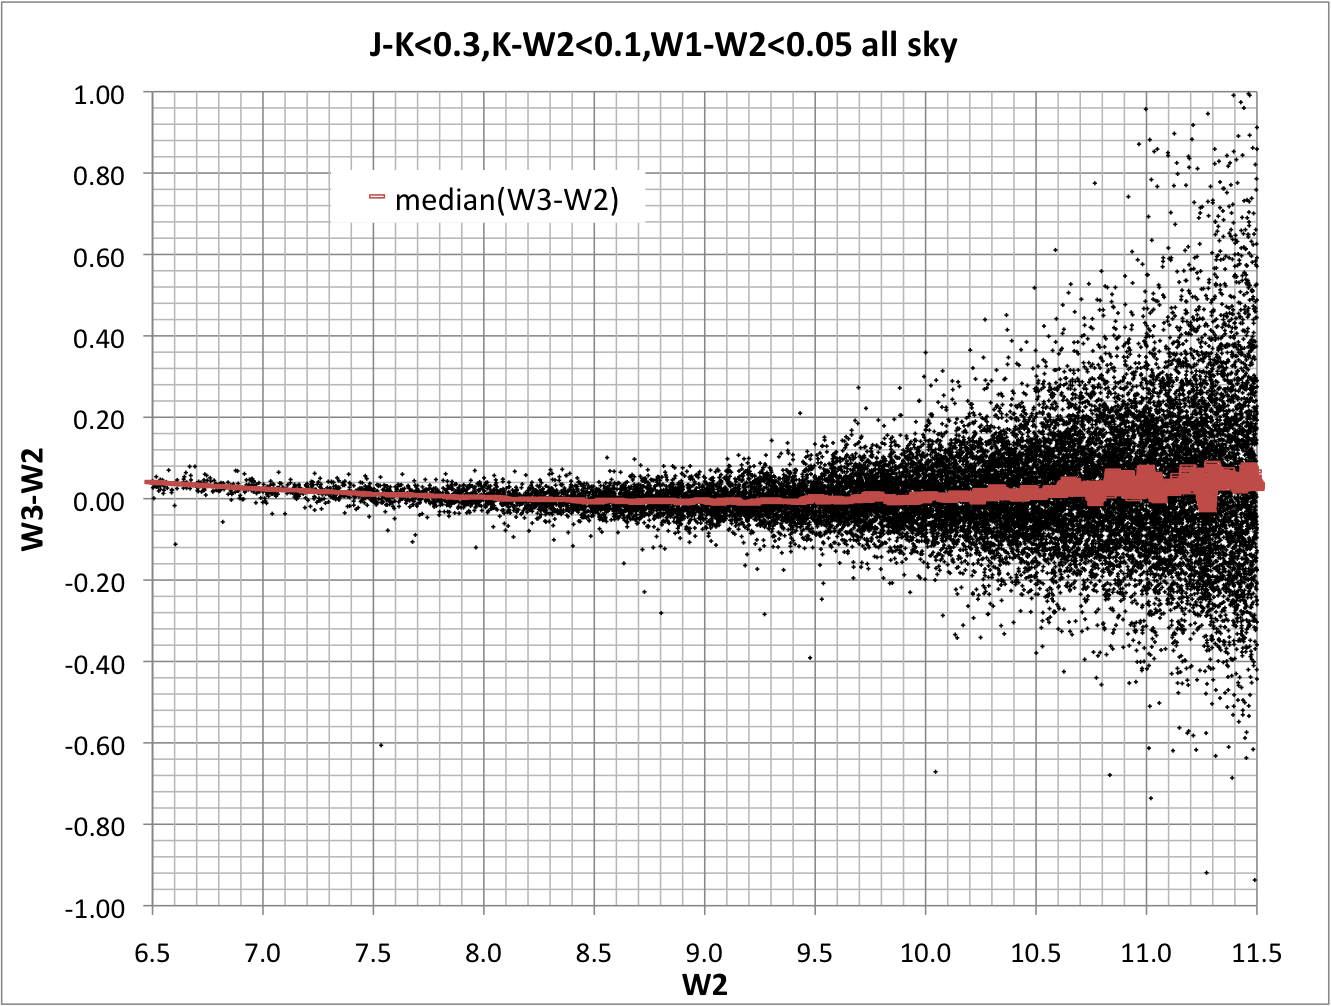
Figure 13 shows a plot of W3 - W2 vs. W2 (with the running median overlaid) for these sources. The median offset is small (< 0.05 mag) and varies only slightly with magnitude. Figure 14 shows the rms in (W3 - W2 - median(W3-W2)) vs W2 after excluding 209 sources more than 3σ away from them median (these outliers likely include sources with excess emission in W3 from debris disks around hot stars). At coverage depth 11, SNR 5 is at W2=11.29, which with the 0.035 median offset here corresponds to W3=11.32, or a flux density of 0.86 mJy.
 |
 |
| Figure 13 - WISE W3 - 2MASS Ks photometry vs. Ks for W3 coverage depth 10 sources. | Figure 14 - rms W3 - Ks error vs Ks for W3 coverage depth 10 sources. |
The Source Catalog includes the estimated error for every source based on the noise model. The third column of Table 1 shows the median W1 (and W2, W3, W4) magnitude for sources with SNR 5 (i.e. (w1sigmpro (and w2sigmpro, w3sigmpro, w4sigmpro) = 0.217 in the Image Atlas tile containing the COSMOS field which are not extended (ext_flg = 0 and xscprox is null) and have cc_flags = 0 in the relevant band. The values are somewhat lower than those found from the external checks, particularly for W1. The flux density for the noise model SNR 5 magnitude has not been corrected for the photometric bias described in Section VI.3.c, which would increase the flux density at the noise model SNR 5 W1 magnitude by approximately 40%. The noise model magnitudes are also somewhat lower than the values found from the rms in repeated WISE measurements of the same source as reported in Wright et al 2010. Those repeatability measurements were measured using the first pass processing of the WISE Preliminary Data Release and have not been recalculated with second pass data, which might be expected to lead to higher noise when compared to the improved algorithms used in the All-Sky Release. However, the repeatability measurements do not include the impact of confusion, because the error due to flux from unresolved sources is the same for the repeated WISE measurements. The external checks use photometry from higher resolution data and should therefore include the contribution of the WISE confusion noise relative to Spitzer in W1, W2 and W4. Although the noise model should include contributions from confusion noise because of the fluctuations in the background caused by unresolved sources, the fact that the noise model values are closer to the repeatability measurements than to the external checks suggests that confusion noise may not be fully captured by the model.
The Source Catalog includes sources with SNR >5 based on the noise model. To provide users with a sense of how the Source Catalog sensitivity varies over the sky, the same procedure described for the COSMOS tile was carried for sources with SNR 5, 7 and 10 (i.e. w1sigmpro etc. = 0.217, 0.155, and 0.108)) in every tile which had enough sources satisfying the constraints to provide a meaningful estimate in the appropriate WISE band. The results are listed in Table 2 and shown graphically for SNR 5 in Figure 1. The noise model WISE magnitudes for which 95% of tiles with |b| > 20°, more than 30° from the Galactic center, and avoiding the Large and Small Magellanic clouds, have SNR 5 or higher is listed in Table 1.
Last update: 2012 October 8