


VII. 3-Band Cryo Data Release
2. 3-Band Cryo Data Products
a. Source Working Database
Contents
- Column Descriptions
- Contents and Usage of the WDB
- General Properties
- Photometric Properties
- Astrometric Properties
The WISE 3-Band Cryo Source Working Database (WDB) contains astrometry and
photometry for 261,418,479 sources detected on the
3-Band Cryo Atlas Intensity Images. Positions, magnitudes,
astrometric and photometric uncertainties, flags indicating the
quality of the source characterizations, and associations with the
WISE All-Sky Release Catalog and the
2MASS Point and Extended Source Catalog sources are presented for each source.
A summary of the properties of the 3-Band Cryo WDB and detailed
column descriptions
are presented below. More detailed descriptions of photometric
and astrometric characteristics of the WDB are presented in section
VII.5. Descriptions of processing algorithms
used to generate the WDB can be found in sections
IV and VII.3.
Users are strongly encouraged to read the
Cautionary Notes before using the 3-Band Cryo Source WDB.
ii. Contents and Usage of the WDB
The 3-Band Cryo Source WDB contains measurements of all
detections made on the coadded Atlas Images
during second-pass
Multiframe Pipeline processing.
The database is analogous to the one generated from the
Multiframe processing of the full cryogenic mission data.
However, the 3-Band Cryo WDB has not been split into
a separate Catalog and
Reject Table, as was done for the All-Sky Data
Release.
Consequently, the 3-Band Cryo WDB is not a well-vetted list of
reliable mid-infrared source detections like the WISE All-Sky Release
Catalog. The WDB contains detections of real astrophysical
sources, along with low SNR noise excursions, spurious detections of
image artifacts and transient pixel events, and duplicate, redundant
entries of source detections in Atlas Tile overlap regions.
The general reliability of the 3-Band Cryo WDB is described in
VII.5.e. Tips for selecting reliable
and unique detections the the WDB are given in
VII.1.d.iii.
As is the case with the All-Sky Release Catalog, the reliable detections
in the 3-Band Cryo WDB are not restricted to point sources such as
stars and unresolved galaxies. The WDB contains point-like objects,
close multiple sources, detections on the disks and spiral arms of
resolved galaxies and clumps or filaments in Galactic nebulosity.
Many of the objects that are well-resolved with respect to the WISE PSF are
identified by having extended source flag values of
ext_flg=1.
The 3-Band Cryo WDB is best used as as a source of supplemental
information for objects that are found in the WISE All-Sky Release Source
Catalog. Because the 3-Band Cryo observations provide independent,
second-epoch of measurements of approximately 30% of the sky, the WDB
can be used to search for potential proper motions and flux variability
of All-Sky Catalog sources. The reliability of a faint source from the
All-Sky Catalog can be verified if it appears in the 3-Band Cryo WDB,
particularly for those with detections in W1 and W2 where the
sensitivity is close to the full-cryo mission phase. Finally,
the 3-Band Cryo WDB provides potential source information for regions
with low or even no-coverage in the
All-Sky Catalog. To facilitate such comparisons, the 3-Band Cryo
WDB and All-Sky Release Catalog have been
positionally cross-correlated,
and the the identification, position offsets and
4-band magnitudes of the closest Catalog entry within 3 arcseconds
are included in each 3-Band Cryo WDB source record.
iii. General Properties
- Total Number of Entries in the 3-Band Cryo WDB: 261,418,479
- Band-detection Statistics for the 3-Band Cryo WDB
The number of sources in the 3-Band Cryo WDB with >2σ flux
measurements
in each of WISE W1, W2 and W3 bands, and with measurement in the
different combinations of bands, are listed in Tables 1 and 2, respectively.
Compare these with the same statistics for the All-Sky Release
Catalog given in Tables 2 and 3 in II.2.c.
4.4% (11,479,336) of the entries in the 3-Band Cryo WDB were nominally
detected on the Atlas Images, but do not have >2σ flux measurements
in any band (det_bit=0).
These are most likely spurious detections of artifacts
and noise. Such objects were filtered out of the All-Sky Release Catalog.
As for the All-Sky Catalog, the majority of objects in the 3-Band Cryo WDB
have detections in the W1 band because that band has the best flux sensitivity
(see VI.3.a) and because the spectral
energy distributions of most objects on the sky favors detection
at the shorter wavelengths.
Because WISE source detection and characterization
is done on all bands simultaneously, and because the majority of objects
are detected in W1, detections of real objects in W1
often pull along faint extractions in the other bands that may
not otherwise have been detected on their own.
Because of the greatly reduced W3 sensitivity during 3-Band Cryo
observations, sources detected only in W3 are largely unreliable
extractions of artifacts, scattered moonlight features and noise events.
See VII.5.e.v for more details.
Table 1 - Number of 3-Band Cryo WDB Entries With >2σ Detections in Each Band
| Band | Number of Objects | Percentage of Total |
|---|
| W1 | 241,344,895 | 92.3 |
| W2 | 188,299,808 | 72.0 |
| W3 | 25,149,893 | 9.6 |
Table 2 -Band-Detection Combinations (>2σ per Band) in the Source Working Database
| Band-Combination | det_bit | Number | Percentage of Total |
|---|
| W1-W2-W3 | 7 | 18,236,409 | 7.0 |
| W2-W3 | 6 | 421,017 | 0.2 |
| W1-W3 | 5 | 2,772,582 | 1.1 |
| W3 | 4 | 3,719,885 | 1.4 |
| W1-W2 | 3 | 165,189,036 | 63.2 |
| W2 | 2 | 4,453,346 | 1.7 |
| W1 | 1 | 55,146,868 | 21.1 |
| -- | 0 | 11,479,336 | 4.4 |
- Sky Coverage
The WISE 3-Band Cryo observations covered
approximately 30.3%
of the sky in two broad ecliptic longitude ranges:
42.2°<λ<98.0° and 228.5°<λ<281.7°.
The 3-Band Cryo Atlas Images and Source Working Database were constructed
by combining the Single-exposure images that fall within
5,649 Atlas Tiles and that meet
minimum quality criteria, and extracting sources from the coadded images.
These Tiles were not required to be completely filled by the
Single-exposure images.
Figures 1 below shows the realized 3-Band Cryo Atlas depth-of-coverage
around the sky in W1, W2 and W3 after all static and dynamic filtering of
Single-exposure images during the Multiframe
Pipeline processing. Depth-of-coverage ranges from ~12 along
the ecliptic plane, and increases to several hundred near the
ecliptic poles. The median coverage depth in the 3-Band Cryo
survey area is 13.7, 13.9 and 13.8 in W1, W2 and W3, respectively. The
strip of missing coverage in the W3 map
is caused by the saturation in
that band during the 4.4 sec exposure
observations.
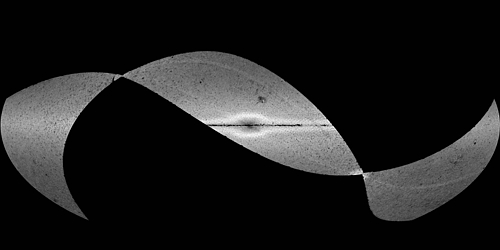
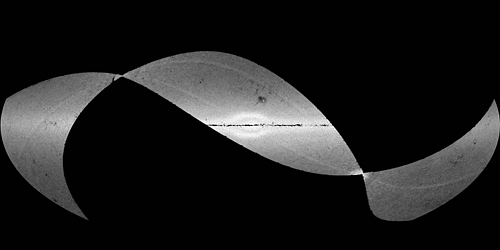
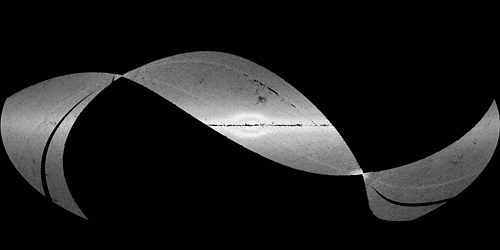
Figure 2 contains sky maps that show the
number of 3-Band Cryo WDB
sources in 12'x12' spatial bins in W1, W2 and W3. 3-Band Cryo WDB sources
are concentrated towards the Galactic plane. The gap in the W3 count
maps corresponding to the period of W3
saturation is clearly visible. Density enhancements are visible
along "spokes" running between the Ecliptic poles that correspond to
regions that were scanned twice as many times as normal during
moon avoidance maneuvers.
Note that the W3 saturation coverage gap on one side of the sky was
partially filled in by the extra scans in a moon avoidance maneuver.
The surface density enhancement near the south Ecliptic pole is
the Large Magellanic Cloud.
| W1 | 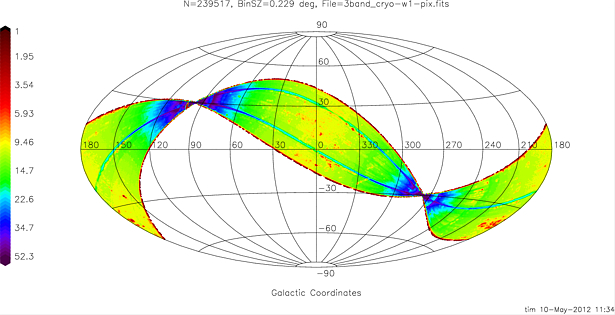 |
 |
| W2 | 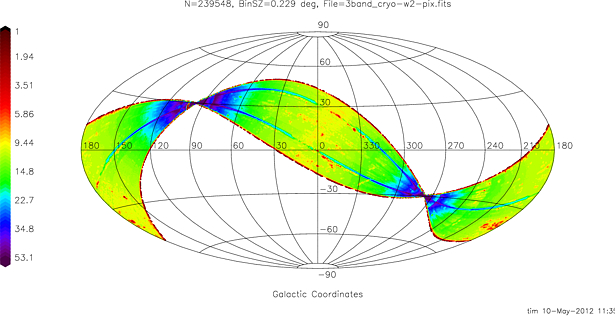 |
 |
| W3 | 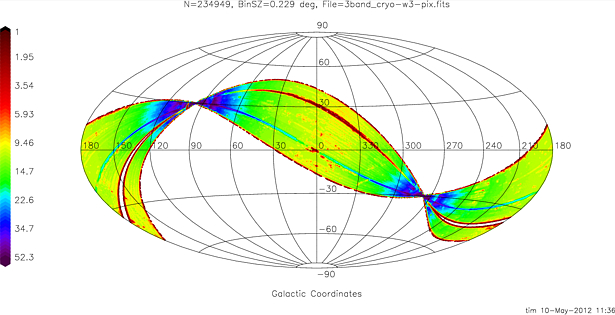 |
 |
| Figure 1 - Hammer galaction projection sky maps showing the realized Single-exposure depth-of-coverage in the W1, W2 and W3 bands for the WISE 3-Band Cryo Release Atlas and Source Working Database. Colors encode the average frame depth-of-coverage in 14'x14' spatial bins as indicated by the legends on the left. |
Figure 2 - Hammer galactic projection grey-scale maps showing the total counts of >2-σ detections computed in 12'x12' spatial bins, in the WISE 3-Band Cryo Release WDB, by band. These maps have the same projection and orientation as the depth-of-coverage maps in Figure 1. |
iv. Photometric Properties
- Photometric Sensitivity
The photometric sensitivity of the 3-Band Cryo Source WDB is discussed in more detail in VII.5.b.ii. In general, the sensitivity of W1 and W2 measurements during the 3-Band Cryo phase is similar to that during the full cryogenic mission phase. W3 sensitivity is 0.5 to 4 magnitudes poorer relative to the full cryogenic survey, and varies in a complex way because of the increasing telescope thermal emission and reduced exposure times.
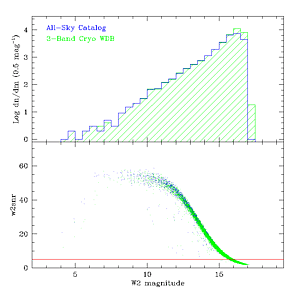
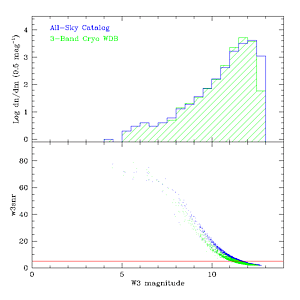
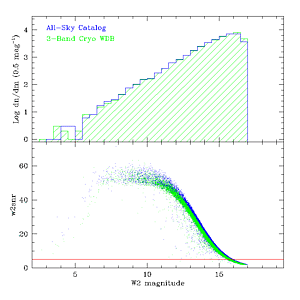
The depth of the 3-Band Cryo Release Source WDB relative to the All-Sky Release Source Catalog is illustrated by the diagrams in Figure 3. These diagrams show the 3-Band Cryo WDB and All-Sky Catalog differential source counts and profile-fit photometry signal-to-noise ratios plotted as a function of source magnitude in two different 2°x2° regions selected to have been observed at the beginning and near the end of the 3-Band Cryo survey operations.
In W1 and W2, the 3-Band Cryo WDB source count curves extend to fainter magnitudes than the All-Sky Catalog because sources were required to have an SNR>5 in at least one band to be included in the All-Sky Catalog. The 3-Band Cryo WDB contains all extractions down to the detection limit near SNR~3.5, so no SNR filtering has been applied. The W3 source counts from the 8.8 sec 3-Band Cryo observations
begin to roll off approximately one magnitude brighter than the counts in the All-Sky Catalog because of the higher thermal background emission during the 3-Band Cryo period. In the 1.1 sec W3 3-Band Cryo observations, the 3-Band Cryo WDB counts roll off 3-4 magnitudes brighter than the All-Sky Catalog because of both the shorter exposure times and higher backgrounds. The excess of sources in the 3-Band Cryo WDB fainter at W3>8 mag relative to the All-Sky Catalog indicates the presence significant
numbers of of spurious W3 noise detections at SNR≤10 in that band.
The SNR curves illustrate that the sensitivity of the W1 and W2 photometric measurements early in the 3-Band Cryo phase is very similar to those represented in the All-Sky Catalog. Near the end of the 3-Band Cryo phase when temperatures had risen to approximately 44 K, the W1 and W2 observations are at most a few tenths of a magnitude less sensitive than those from the full cryogenic survey phase. The sensitivity of the 3-Band Cryo W3 measurements ranges from ~0.5 mag below the full cryo phase at the beginning of the 3-Band Cryo survey, to 3.5-4 mag near the end of the 3-Band Cryo period.
| Position | W1 | W2 | W3 |
l=171.5°
b=-43.1° | 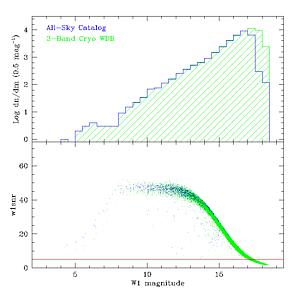 |
 |
 |
l=186.5°
b=-14.0° | 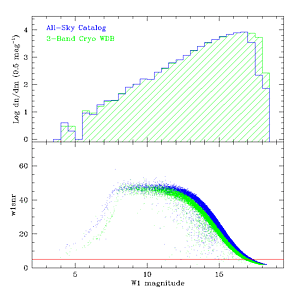 |
 |
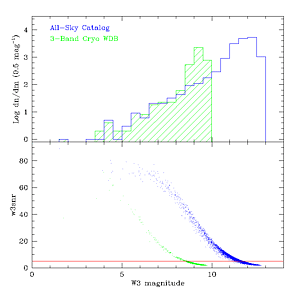 |
| Figure 3 - The top panels in each diagram show the
W1, W2 and W3 source count curves in 4 deg2 regions in the
WISE All-Sky Release Catalog (blue lines) and the 3-Band Cryo
Source Working Database (hashed green lines). The bottom panels
show the profile-fit photometry measurement signal-to-noise ratio
(w?snr)
plotted as a function of profile-fit magnitude for the All-Sky
Release Catalog (blue points) and 3-Band Cryo Working Database (green points).
The red horizontal lines indicate SNR=5. The top row of plots
show the counts and SNR for a region at l,b=171.5°,-43.1°
in which the 3-Band Cryo W3 exposure time was 8.8 sec. The
bottom row represents a region at l,b=186.5°,-14.0°
in which the W3 exposure time was 1.1 sec. |
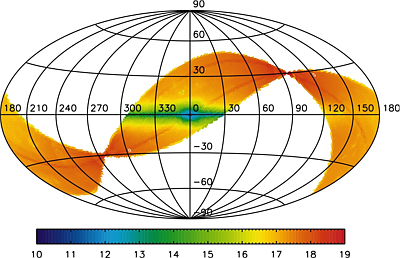
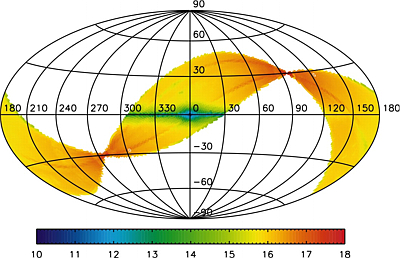
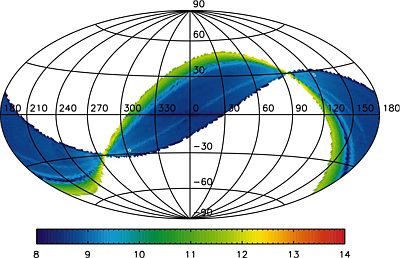
The spatial variation of 3-Band Cryo WDB photometric sensitivity is
illustrated in Figures 4a-c which contain sky maps
that show the magnitude at which the mean profile-fit photometric measurement
uncertainty in each band is equal to 0.217 mag, corresponding to 5σ.
In W1 and W2, the variations are similar to those seen in the
All-Sky Release Catalog shown in
Figure 1 in VI.3.a.
Source confusion drives down sensitivity in the high density regions
near the Galactic plane. Sensitivity increases away from the Galactic plane,
and as the Single-exposure depth-of-coverage increases towards the Ecliptic
poles. In W3, the sensitivity variations are dominated
by the decreasing exposure times and increasing telescope temperature
at the beginning of the 3-Band Cryo observations. The W3 sensitivity
stabilized approximately 40% of the way into the 3-Band Cryo period
when the telescope temperature settled near 44 K.
 |
 |
| Figure 4a - W1 | Figure 4b - W2 |
 |
| Figure 4c - W3 |
| False-color galactic projection sky maps showing the spatial
variation of average magnitude at which the flux SNR=5
in the 3-Band Cryo WDB
(see VII.5.b.ii). The colors denote the mean
SNR=5 magnitude per Tile, according to the color bars in each Figure.
The longitude axes are reversed in these figures relative to those
in Figures 1 and 2. |
- Photometric Biases
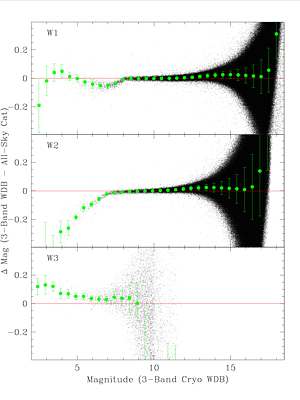
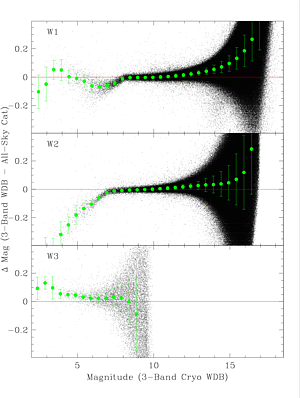
Figures 5a-c show differences between the
profile-fit photometry of the same sources in the 3-Band Cryo WDB and
All-Sky Release Catalog in three ~100 deg2 regions with
different source surface densities.
In the lowest density region, shown in Figure 5a, the 3-Band Cryo W1 and W2
measurements for non-saturated sources (W1>8 mag and W2>7 mag) are
approximately 0.01-0.02 mag fainter than in the All-Sky Release
Catalog. Roughly half of this offset is caused by
the photometric
zero point that was applied as part of the photometric
calibration. In the higher source density regions shown in Figures
5b and 5c, a systematic, flux-dependent bias between 3-Band Cryo WDB and
All-Sky Catalog becomes apparent. In the high density regions,
3-Band Cryo WDB measurements become increasingly fainter
than those in the All-Sky Catalog towards fainter flux levels.
The amplitude of this bias strengthens with increasing source surface density.
For example, at a fiducial magnitude of W1=15 mag,
3-Band Cryo photometry is 0.02, 0.10 and 0.30 mag fainter than
that in the All-Sky Catalog in the fields with 1,900, 7,200 and 24,200
sources deg-2, respectively.
This behavior is similar to the bias observed between
photometry from the WISE All-Sky Release Catalog and
from Spitzer Space Telescope Observations in selected regions (see
VI.3.c.i.2). That bias is
believed to result from slight overestimation of the background levels
during WISE measurements because of the effects of source crowding
and a small bias introduced in the pixel distributions during the
Single-exposure image calibration step. The origin of the
3-Band Cryo vs. All-Sky Catalog bias likely has a similar origin.
3-Band Cryo WDB measurements of non-saturated sources in W3
are typically ~3% fainter than those in the All-Sky Release Catalog.
At least a part of this offset is also attributable to
difficulty in determining the photometric
zero point for calibration. The time-variable zero point residuals in
the W3 Single-exposures were corrected during 3-Band Cryo
Atlas Image Generation, but
it is likely a small net offset remained.
Photometry of saturated sources in the 3-Band Cryo WDB and the
All-Sky Catalog show significant discrepancies in all bands
(W1<8, W2<7 and W3<4 mag). As described in
VII.1.a.iii, on-board saturated pixel
encoding
during the 3-Band Cryo phase was intermittent in W1 and W2, and inactive
in W3 following the first exposure time reduction, so the identification
and handling of saturated sources by the pipeline photometry modules
was degraded. Therefore, photometry
of very bright sources in the 3-Band Cryo WDB should be used with
caution.
 |
 |
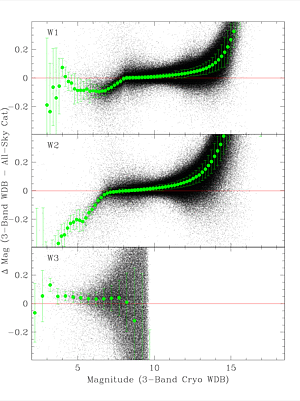 |
Figure 5a - l,b=63.7°,+34.3°
n(W1<15)=1,959 deg-2 |
Figure 5b - l,b=162.1°,-4.3°
n(W1<15)=7,230 deg-2 |
Figure 5c - l,b=338.3°,-0.7°
n(W1<15)=24,168 deg-2 |
| Profile-fit photometric residuals between
the 3-Band Cryo WDB and the All-Sky Release Source Catalog. The
small black dots represent individual sources. The larger green
points and error bars are the trimmed average and RMS differences between
3-Band Cryo WDB and All-Sky Release Catalog magnitudes computed in
0.5 magnitude bins (0.2 magnitude bins in W3). |
v. Astrometric Properties
The astrometric quality of the
3-Band Cryo WDB is described in VII.5.c. Because position reconstruction is based primarily on W1 detections that have similar sensitivity in the 3-Band Cryo observations, the absolute accuracy of 3-Band Cryo WDB astrometry is comparable to that of the All-Sky Release Catalog
(VI.4). Bright, non-saturated sources in the 3-Band Cryo WDB have position residuals <0.2 arcsec with respect to the 2MASS Point Source Catalog, and the residual increases to approximately 0.4 arcsec for SNR~20 sources.
The relative agreement between astrometry in the 3-Band Cryo WDB and All-Sky Release Catalog is slightly better than the absolute accuracy which makes the WDB a resources for searching for candidate high proper motion objects. An example of this is illustrated in Figure 6 that shows the RA and Dec position differences in the 3-Band Cryo WDB and All-Sky Release Catalog plotted as function of 3-Band Cryo W1 magnitude for isolated, point-like sources in a 4 deg2 region centered on the position of Teegarden's star (α,δ=43.2643°+16.8701°). The green curves show ±5 times the RMS of the average position residuals. Teegarden's star RA and Dec residuals, as derived from the 3-Band Cryo WDB r_allsky and
pa_allsky values, are indicated by the large blue points.
The WISE-measured proper motion is 5.36 arcsec/year measured over the 195 days separating the All-Sky Release Catalog and 3-Band Cryo WDB observations, slightly larger than the published motion of
5.05 arcsec/year (Lepine and Shara, 2005, AJ, 129, 1483).
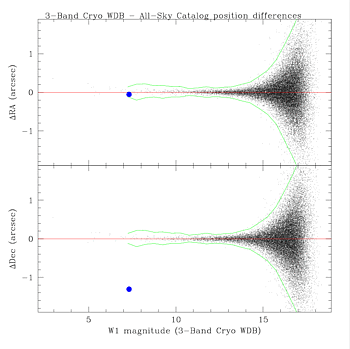 |
| Figure 6 - RA and Dec differences reported for the same
sources in the WISE 3-Band Cryo WDB and All-Sky Release Catalog
in the 4 deg2 region centered on Teegarden's star.
Black points are non-blended sources
(nb=1) that are not flagged as
extended (ext_flg=0),
The green lines show ±5 times the RMS of the average position
residuals. The position residuals for Teegarden's star from the
3-Band Cryo WDB are the large blue points. |
Last Updated: 2012 July 26


