


Atlas Images in the 3-band cryo data release were generated using the same methodology as for the 4-band (All-Sky) cryo release as outlined in section IV.4.f. The significant updates specific to 3-band cryo processing are (i) the inclusion of more metadata keywords in the FITS headers of Atlas Image products; (ii) additional pixel-masking in the single-exposures prior to reprojection; and (iii) a dynamic correction to the input W3 single-exposure photometric zero-points as a function of time.
Since the W3 exposure time was gradually decreased over the 3-band cryo period (see Table 2 in section VII.3.b.i.1) to mitigate the onset of severe saturation from rising temperatures, it is possible for a W3 Atlas Image to have been made from a mixture of frames with different exposure-time. We have computed the fraction of input frames contributing to each of the four distinct exposure times (8.8s, 4.4s, 2.2s, 1.1s), and listed these as additional keywords in the FITS headers of the W3 Atlas Image products (i.e., the intensity, coverage, and uncertainty maps). Here's an example:
FRC8P8ET=          0    / fraction of NUMFRMS with exptime=8.8 sec
FRC4P4ET=          0    / fraction of NUMFRMS with exptime=4.4 sec
FRC2P2ET=          0.17 / fraction of NUMFRMS with exptime=2.2 sec
FRC1P1ET=          0.83 / fraction of NUMFRMS with exptime=1.1 sec
An issue that was discovered after 3-band cryo single-exposure processing (specifically after instrumental calibration) was the presence of a persistent split-droop residual in the bottom right quadrant of all W3 frames. This residual (consisting of a strip of bad pixels a few pixels wide) was masked in the accompanying input frame masks as bit #23 during Atlas Image generation and then omitted from co-addition.
Another fix related to the single-exposure frame inputs prior to generating an Atlas Image was the internal correction of the W3 raw photometric zero-points (MAGZPs). The single-exposure MAGZPs normally would have been assigned earlier in frame processing, however, after a thorough photometric analysis given the large amount of data available after 3-band frame processing, we discovered inaccuracies in the W3 single-exposure ZPs. The W1 and W2 ZPs were deemed accurate enough to proceed without any further tweaking.
The corrections to the 3-band cryo W3 MAGZPs were calibrated by comparing the W3 photometry from 4-band cryo (All-Sky) processing to the single-exposure W3 photometry obtained from the just-completed 3-band single frame processing. Figure 1a shows the trends in these magnitude differences (from profile-fit photometry) as a function of time for each exposure-time interval over the 3-band cryo period. The blue crosses represent trimmed averages of photometric measurements within bins of width one-half of a survey scan, with ~1000 (for the shorted exposures) to >15,000 extractions per bin. These points where then locally smoothed using the loess method (a local regression fitting method using splines) and the result is shown by the solid black curves. The fit residuals from the binned data are shown in Figure 1b and exhibit an RMS of ~0.0035 mag. This smoothed result was our prediction for the MAGP correction (dMAGZP) at any MJD. This prediction was computed across the range of 3-band cryo MJDs in steps of 0.1 (i.e., every 2.4 hours) and tabulated. Given an input frame's observation time in MJD, this was then used as a look-up table during Atlas Image generation with linear interpolation.
The incoming (old) W3 frame MAGZPs were then corrected according to:
new_MAGZP = old_MAGZP + dMAGZP,with dMAGZP obtained from the interpolated look-up table described above. Note that the actual W3 FITS file frames did not have their headers updated with the new MAGZP values. The values you will see in the single-exposure FITS headers are erroneous (at the levels indidated in Figure 1a when compared to 4-band cryo counterparts). The corrected MAGZPs were only propagated internally during multiframe processing to the throughput-matching step where the frames were rescaled to a common global zero-point for insertion into the FITS headers of Atlas Image products. These global MAGZP values and their uncertainties are summarized in Table 1 of section II.3.f.
 |
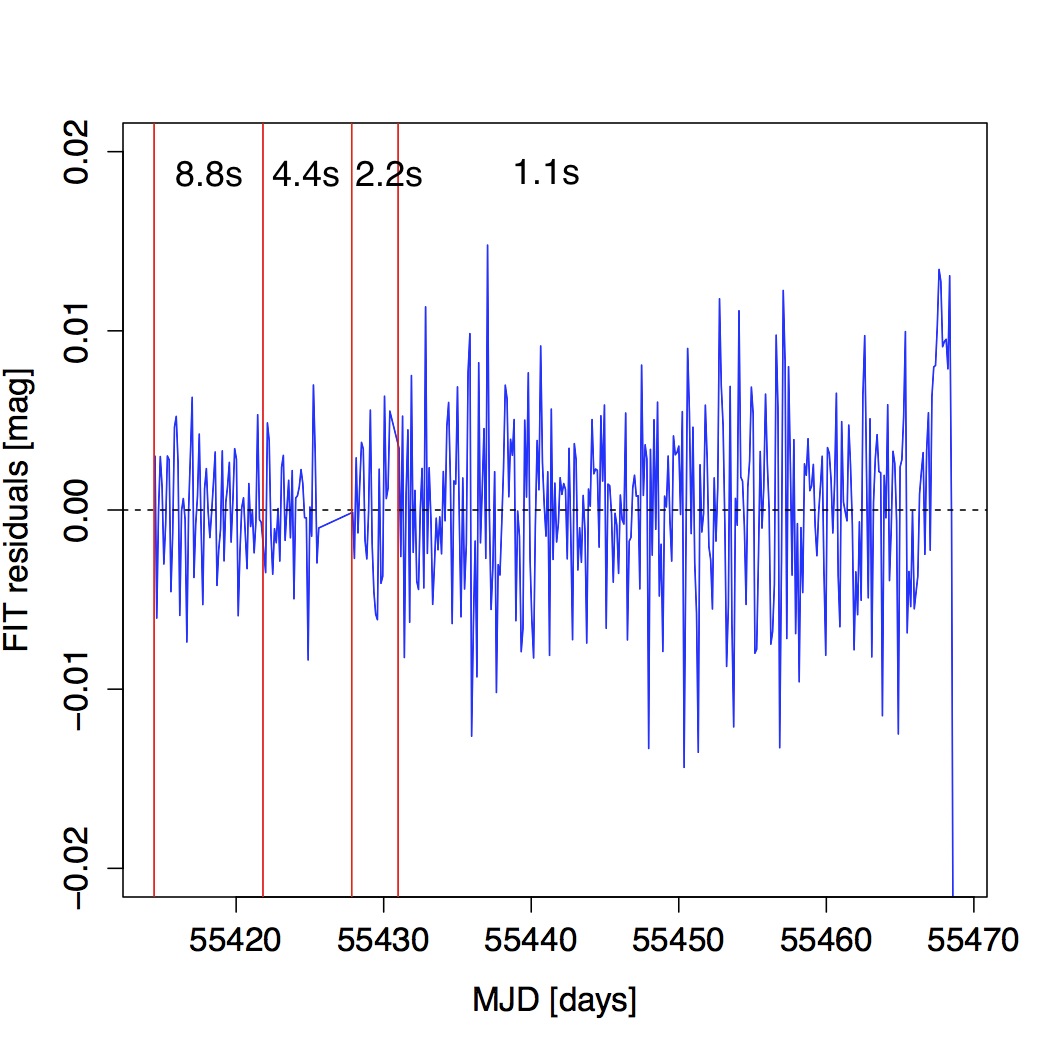 |
| Figure 1a - Difference in W3 photometry from 4-band (All-Sky Release) and 3-band (single-exposure processing) versus Modified Julian Date. Specific exposure-time intervals are also shown. See text for details. | Figure 1b - Residuals in the fit relative to the data in Figure 1a. |
All the cautionary notes listed in section I.4.c apply to the 3-band Atlas Image products. Here are some additional items to be aware of.
Last update: 2012 May 14