


Another ancillary Atlas Image product is the pixel-uncertainty map, generically named: COADDID-wBAND-unc-3.fits, where BAND = 1, 2, 3, or 4 and COADDID is a unique identification string pertaining to the sky footprint. The uncertainty map includes FITS metadata matching that in the primary intensity Atlas Image and depth-of-coverage map, and has the same dimensions and pixel-scale as these products.
The uncertainty map stores the 1-σ uncertainty per pixel corresponding to the co-added intensity values in the primary Atlas Image, in the same units of DN. It accounts for all "good" input frame pixels, i.e., the same used to create the intensity and depth-of-coverage maps after rejection of bad and saturated pixels, and outliers. By design, the uncertainty for co-add pixel j will scale as: σj ∝ 1/√Nj, where Nj is the effective depth-of-coverage. This is because the co-add uncertainties are based on propagating a prior detector pixel noise model for each input pixel through all instrumental calibration steps, then appropriately weighting them in co-addition using the Point Response Function (PRF) as described in section IV.4.f.vii. This accounts for the implicit smoothing of intensity image pixels by the PRF-interpolation process, i.e., the redistribution of pixel noise power from high to low spatial frequencies. The uncertainty maps are useful if you intend to perform photometry off the Atlas Images (see section II.3.f), in particular, if interested in estimating photometric uncertainties or upper limits.
The uncertainty map values therefore are not a-posteriori (data-derived) estimates, and no attempt is made to include systematics above and beyond that captured by the detector noise model plus random statistical errors from instrumental calibrations. I.e., it does not include possible gain and/or bias variations from unforeseen instrumental transients, although our photometric analyses show such variations to be minimal. Furthermore, the uncertainty maps do not include any component of confusion noise, which may be significant in regions with high source density and/or complex background emission. This component however (along with the prior uncertainties described here) is handled appropriately in the source extraction process.
Three uncertainty-related metrics are written to the FITS headers of Atlas Image products. These can be used to judge the accuracy of the uncertainty map values, with some limitations (see below). These metrics are represented by the FITS keywords: ROBSIG, PIXCHIS1, and PIXCHIS2, and are defined in section II.3.b. PIXCHIS1 and PIXCHIS2 in particular measure the degree to which the pixel uncertainties are statistically compatible with RMS-noise fluctuations in the background of the intensity image at ~fixed depth-of-coverage. Values of ~1 (analogous to the traditional reduced χ2 metric) indicate plausible uncertainties.
PIXCHIS values that significantly
deviate from 1 however, may not be problematic.
This is because the robust sigma
(ROBSIG)
used in their computation
could be biased by the presence of a fast-varying background
and/or high source confusion, and thus not reflect the underlying pixel noise.
In this case, if interested in validating the uncertainties,
we recommend measuring the local RMS fluctuation
in a region of the intensity image with ~uniform background,
low source density, and ~constant depth-of-coverage, then comparing this to the
median pixel value in the same region of the uncertainty map.
If they differ significantly, say by >40%, a manual rescaling of the
uncertainty map may be necessary before use. In general,
we don't expect this operation will be needed. It is mentioned here
only as a caution.
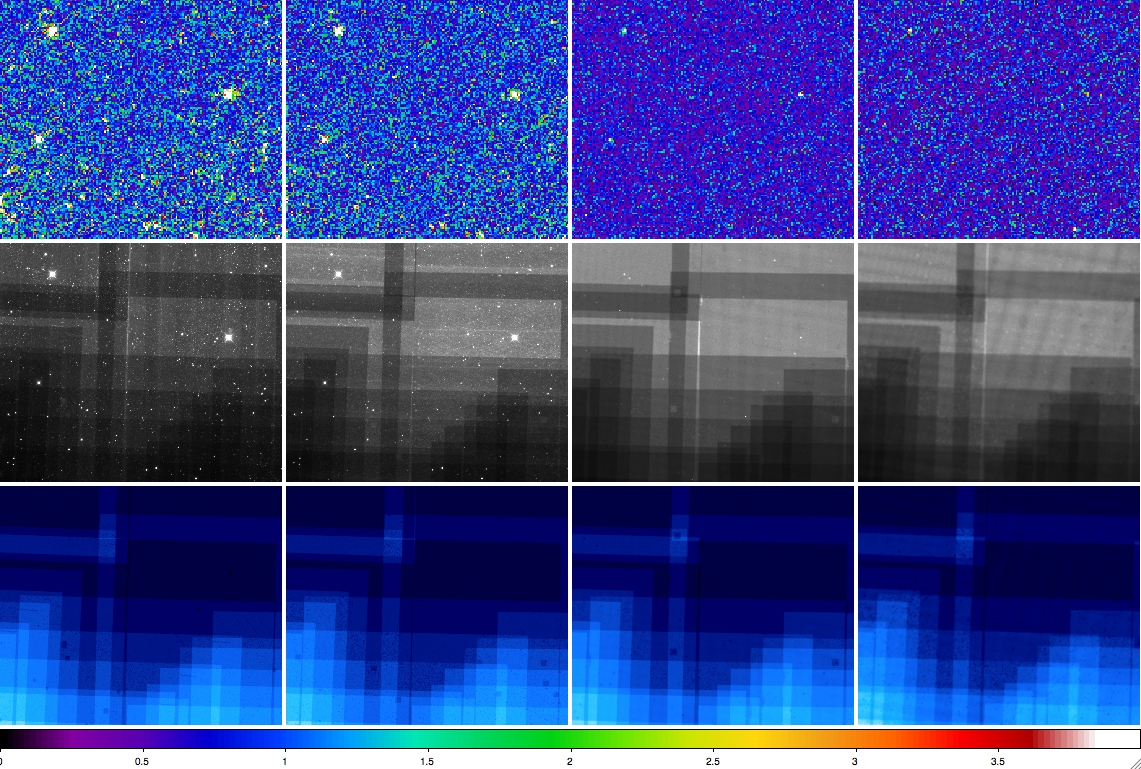 |
| Figure 1 - top row: images of the ratio R = "local robust pixel-RMS in intensity / local modal pixel-uncertainty" for bands 1, 2, 3, 4 (left - right) for a relatively unconfused region in an Atlas tile [see color bar for scale]; middle row: corresponding uncertainty images; bottom row: corresponding depth-of-coverage images, where frame depth varies from ~1 (dark) - 12 (bright). As expected, the uncertainty is higher in regions with low depth-of-coverage. |
Last update: 2012 February 20