


As noted in section IV.4.c, one may find a systematic difference between the equatorial (J2000) positions of sources determined off Atlas Images, e.g., via a flux-weighted centroid or peak-finding algorithm, and astrometrically calibrated positions from the AllWISE Source Catalog. For reasons not yet understood, these biases don't always exist, but when they do, their magnitude and direction vary with location on the sky (e.g., see Figures 1 and 2) as well as across bands. The biases are generally (and considerably) larger for W3 and W4 than for W1 and W2 (see below). We describe below how to check for these biases and correct the image-derived source positions and/or Atlas Image WCS in general.
Source-peak to astrometric biases are also present in the single-exposure images but at a much lower level. These biases are fixed in the single-exposure x,y coordinate frame and like the Atlas Images, are also relatively larger in W3 and W4. After testing and eliminating numerous hypotheses, one explanation remains. This is the presence of non-negligible systematic errors in the distortion and/or astrometric calibration for the longer wavelength single-exposures that get amplified by the distortion correction and reprojection routines in the co-adder. Evidence suggesting this is that first, the same (long wavelength) astrometric biases are seen from at least three different image co-adders that recognize the "SIP-distortion" representation: AWAIC; Montage; and MOPEX. This is independent of the interpolation method used. Second, the fact that the W1 and W2 Atlas Images exhibit negligible biases from all co-adders (e.g., Figures 1 and 2) implies that the distortion and astrometry is well calibrated for these bands and appropriately handled by all software. What's not yet understood is why the co-adding software amplifies the single-exposure biases for the longer wavelength bands. It appears that if the single-exposure inputs are "perfect" going in, the co-adder outputs are also.
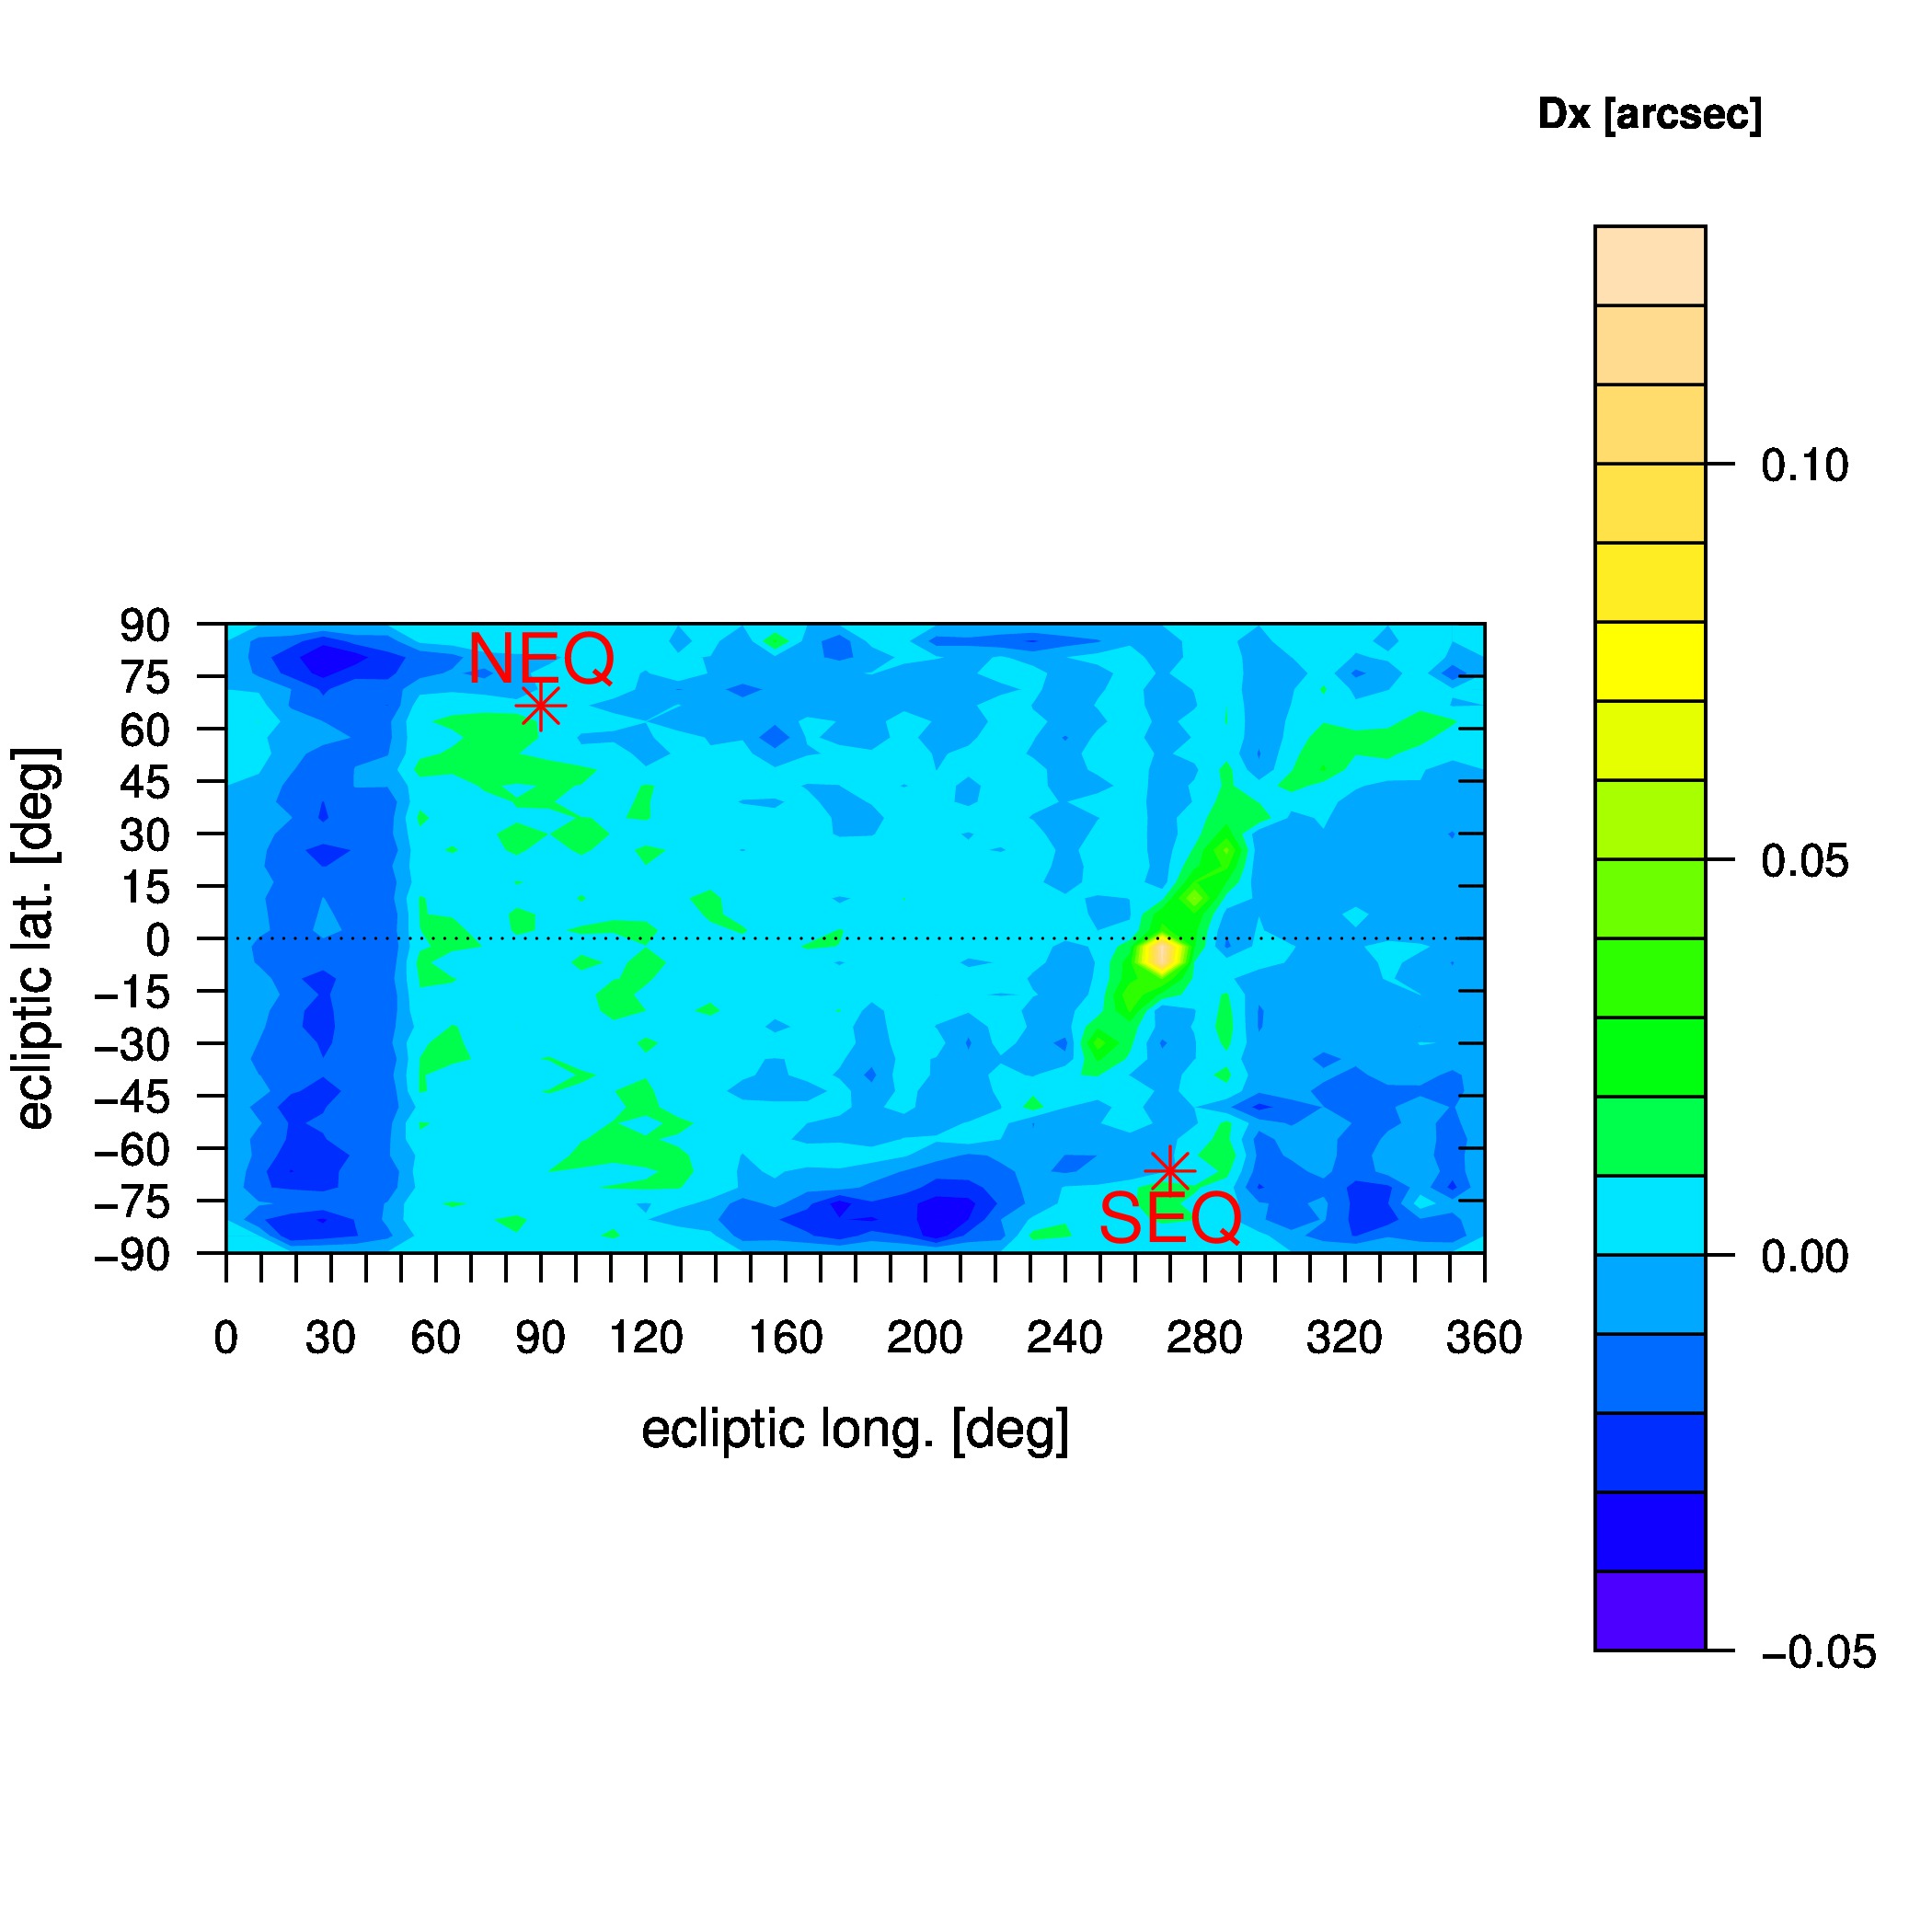
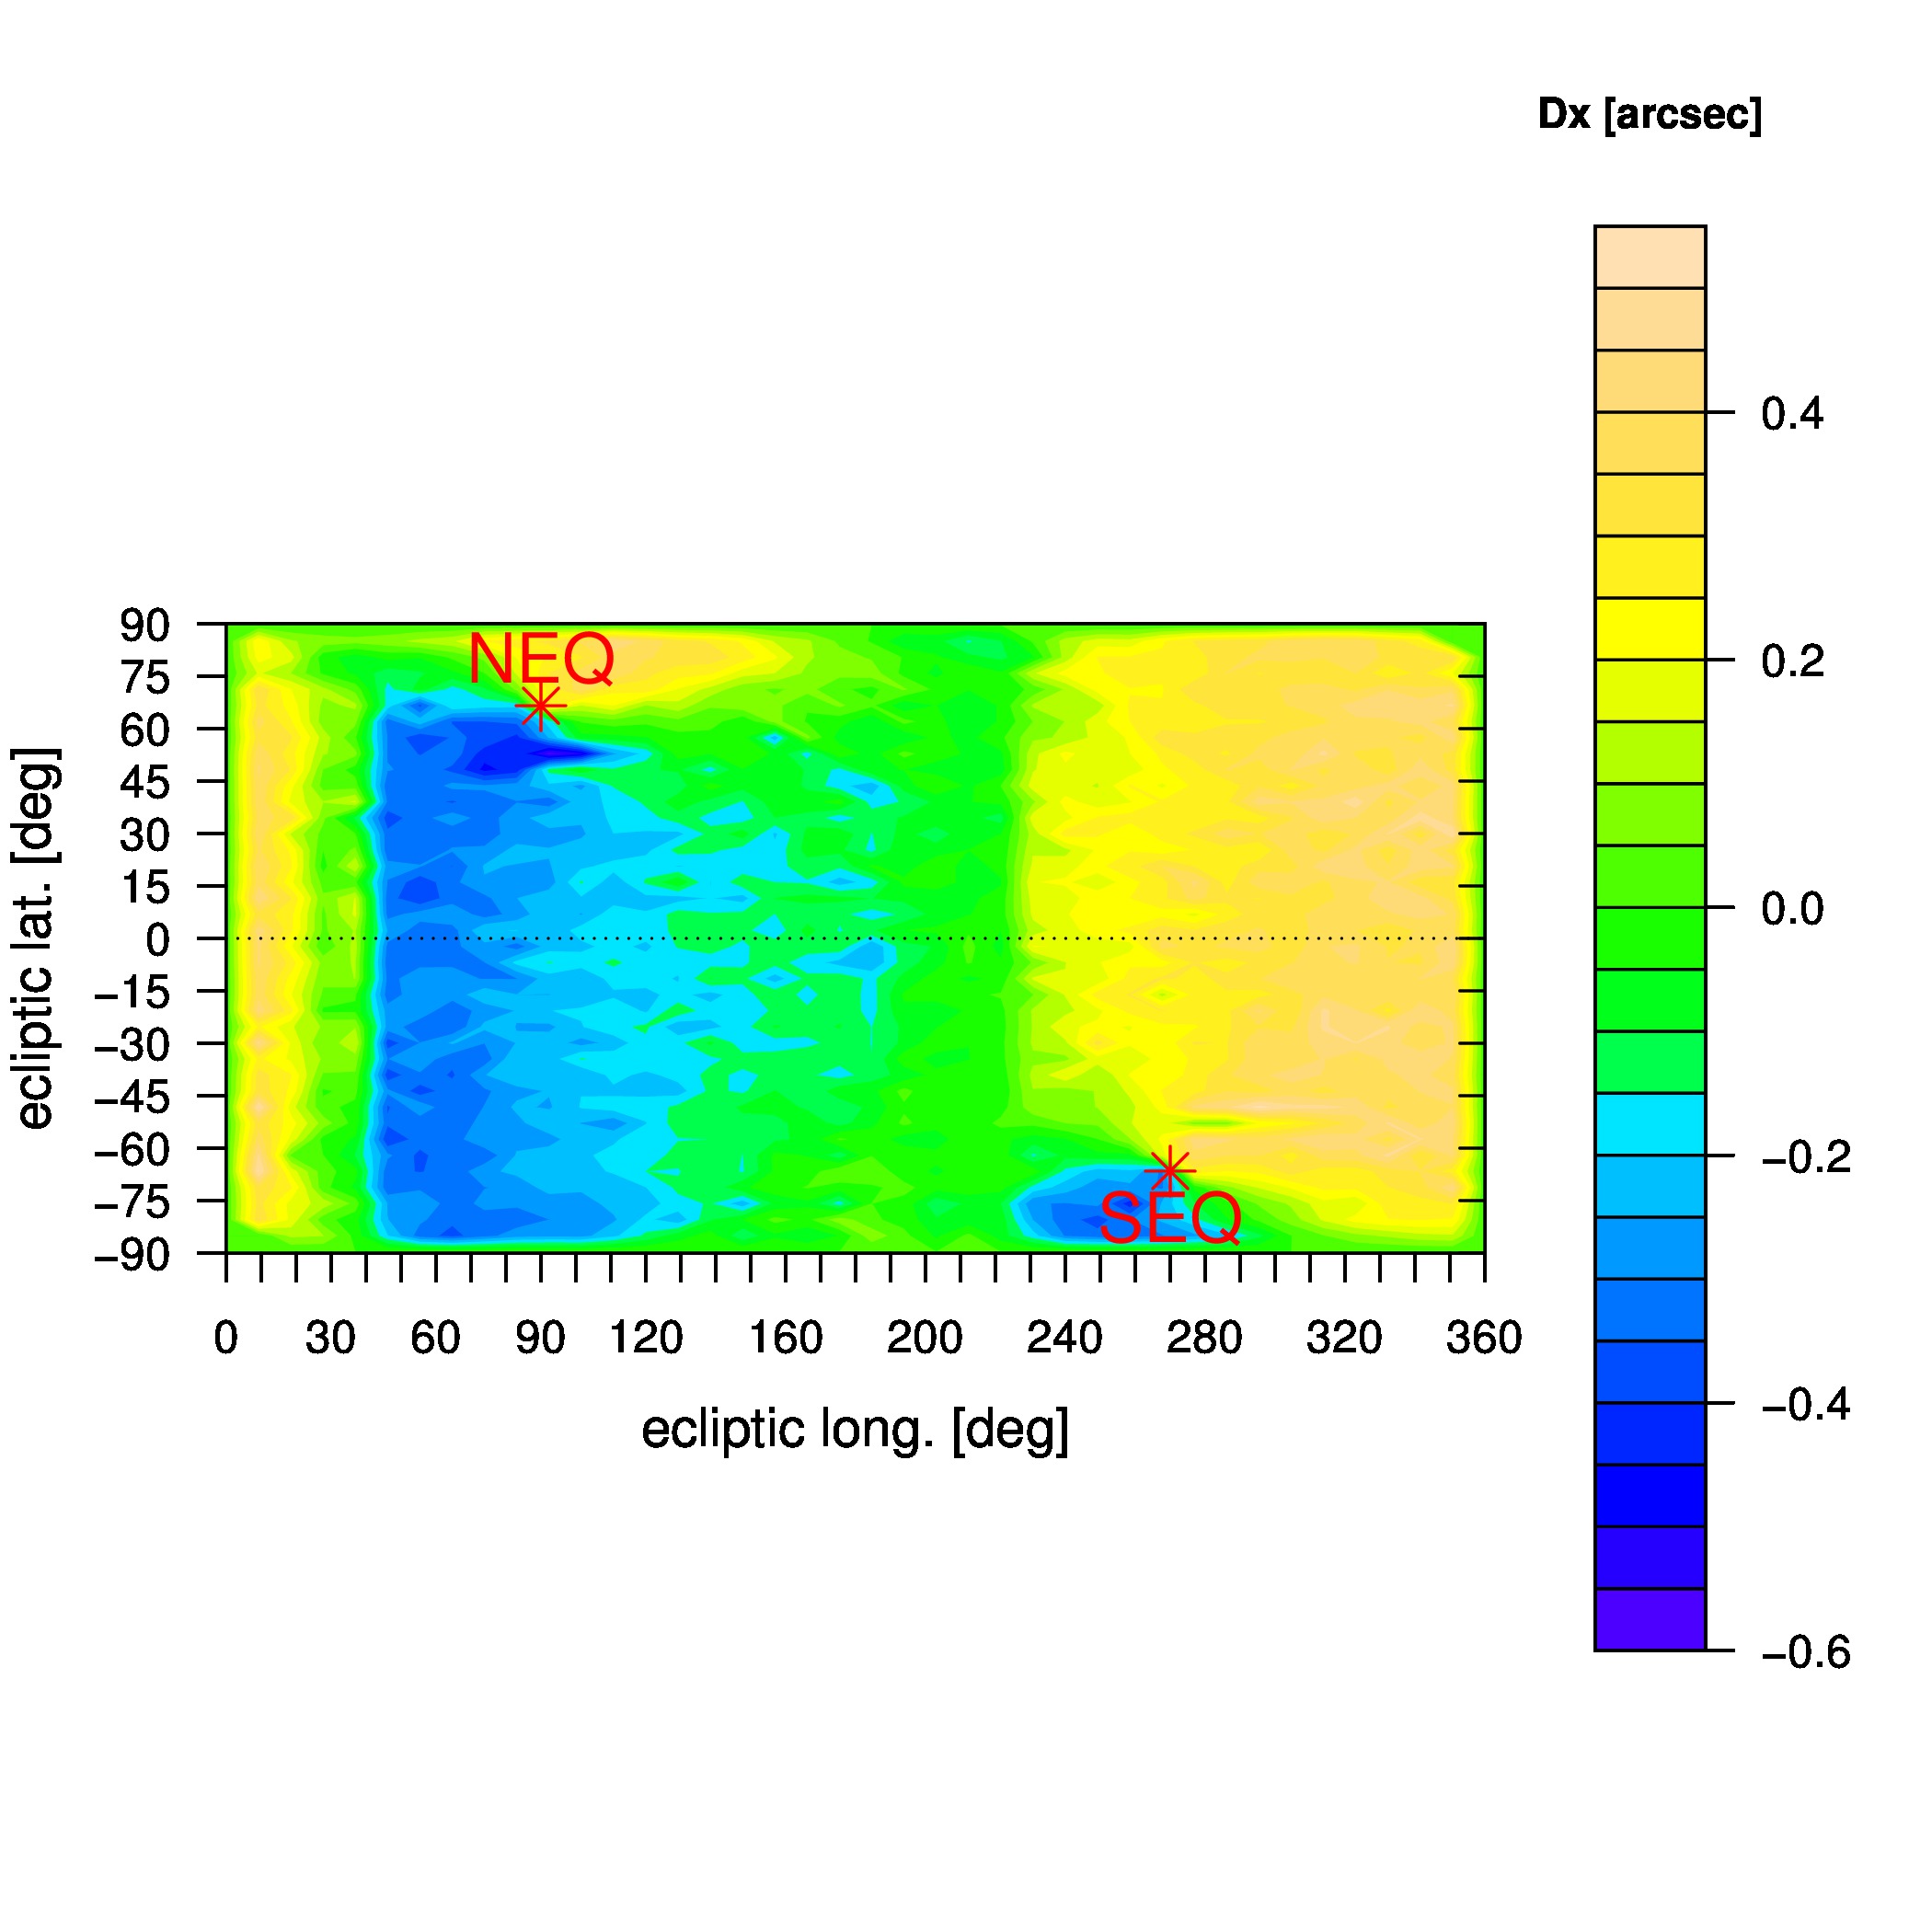
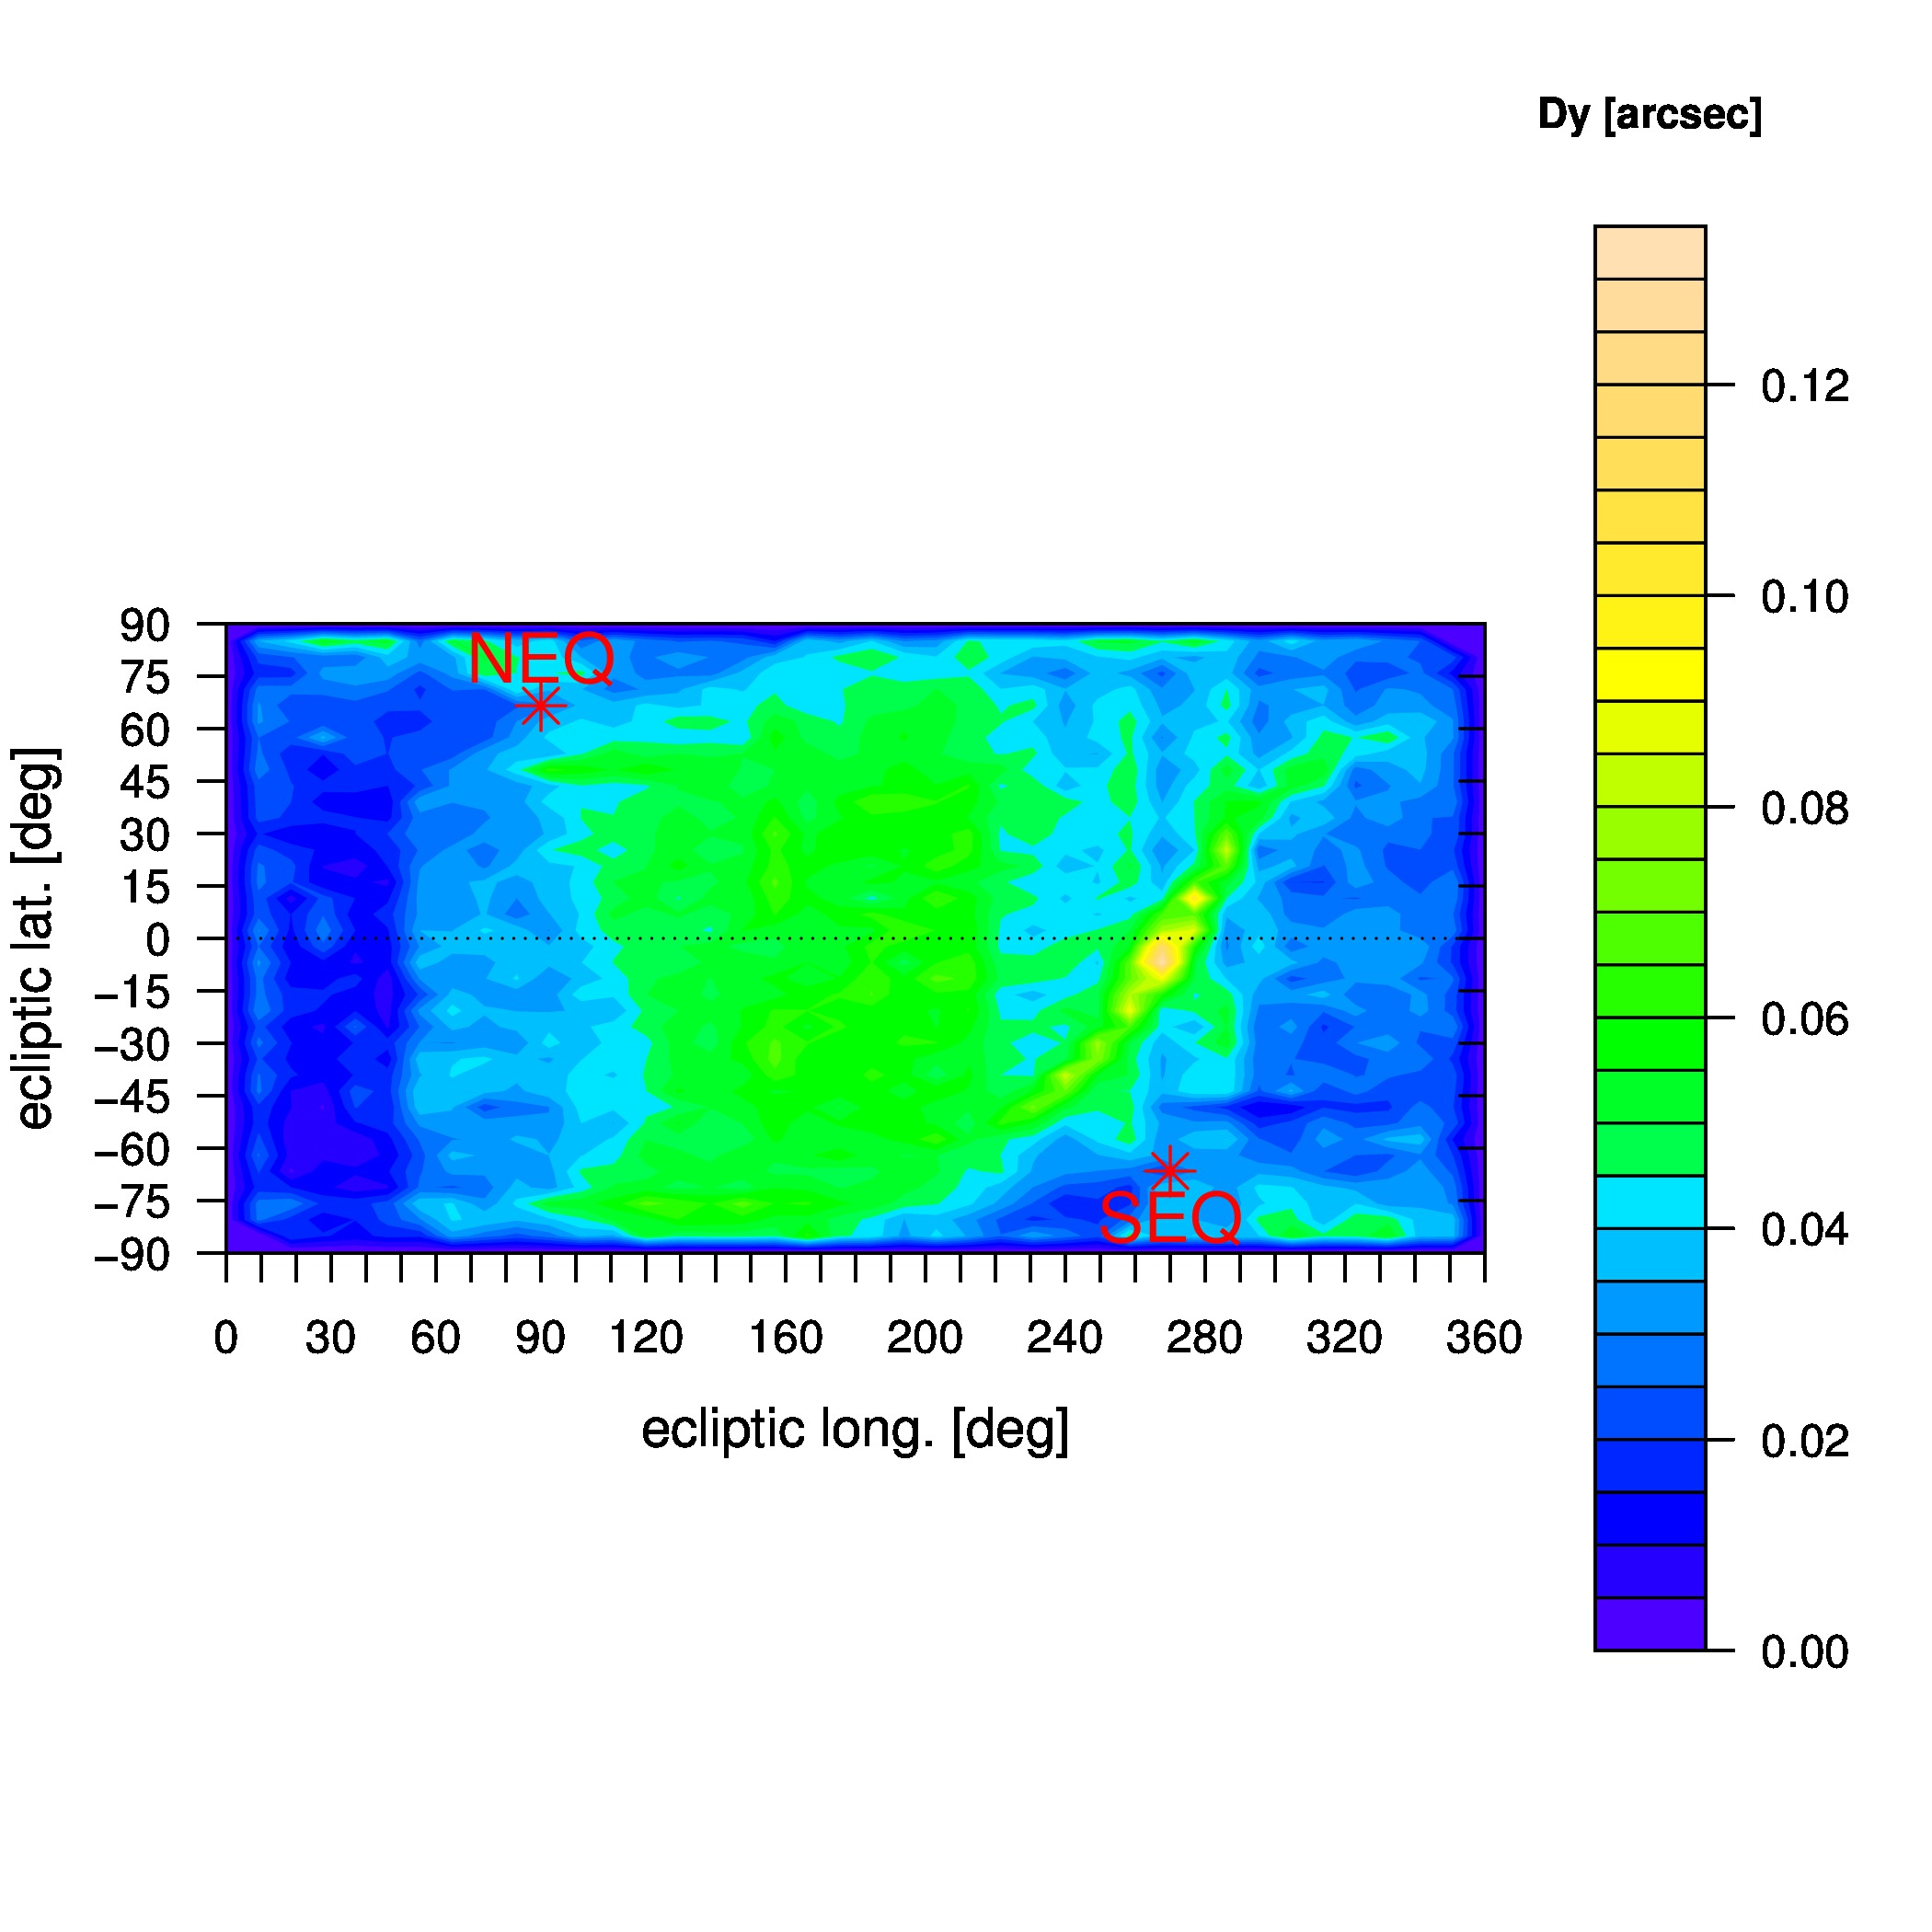
From the distribution in differences between image-derived source peak positions and "true" Source Catalog astrometric positions over the sky (Figures 1 and 2), we find 95th percentile upper limits (in the radial separation) of <~ 0.075″ in W1 and W2, <~ 0.43″ in W3, and <~ 1.1″ in W4. The contour-density plots in Figures 1 and 2 show the astrometric offsets per axis, in the Atlas Image coordinate frame. These plots were contructed using the Atlas Image FITS-header keywords FLXWTDX and FLXWTDY as input, described in section V.3.a.iii.5. Only values with a measured signal-to-noise ratios of > 3 on either axis (header keywords FLXWTSDX and FLXWTSDY respectively) were used. Missing data in the ecliptic latitude versus longitude Mercator plane were interpolated. Therefore, estimates around the periphery of these maps is probably innacurate, particularly at the poles.
We strongly advise using the catalogued source position if available, otherwise, if you would like the equatorial coordinates of a source in an Atlas Image not in the catalog, e.g., because it didn't satisfy the catalog selection criteria, we recommend first checking the significance of the FLXWTDX and FLXWTDY FITS-header keyword values. The significance is reported by the correspnding signal-to-noise keywords FLXWTSDX and FLXWTSDY respectively. If any of these values are >~ 3, then there's reason to correct the Atlas Image WCS. This is accomplished by correcting the reference-pixel WCS keywords CRPIX1,CRPIX2 (always = 2048, 2048) in the Atlas Image FITS-headers:
CRPIX1new = 2048 - (δx/1.375)
CRPIX2new = 2048 - (δy/1.375),
where δx, δy are the values of FLXWTDX and FLXWTDY respectively, and 1.375 is the Atlas Image pixel scale in arcsec/pixel.
After correcting the CRPIX1,CRPIX2 values in your Atlas Image FITS header, you can re-extract sources and they will be astrometricaly calibrated.
As a word of caution, the values of FLXWTDX and
FLXWTDY may not be accurate enough since
they were computed using sources based on stringent selection
criteria as described in section
V.3.a.iii.5.
The absence of sufficiently good souces may have rendered
the values of FLXWTDX,
FLXWTDY unusable.
If so, we suggest following the method described in section
II.3.g.i.
of the All-Sky Explanatory Supplement.
 |
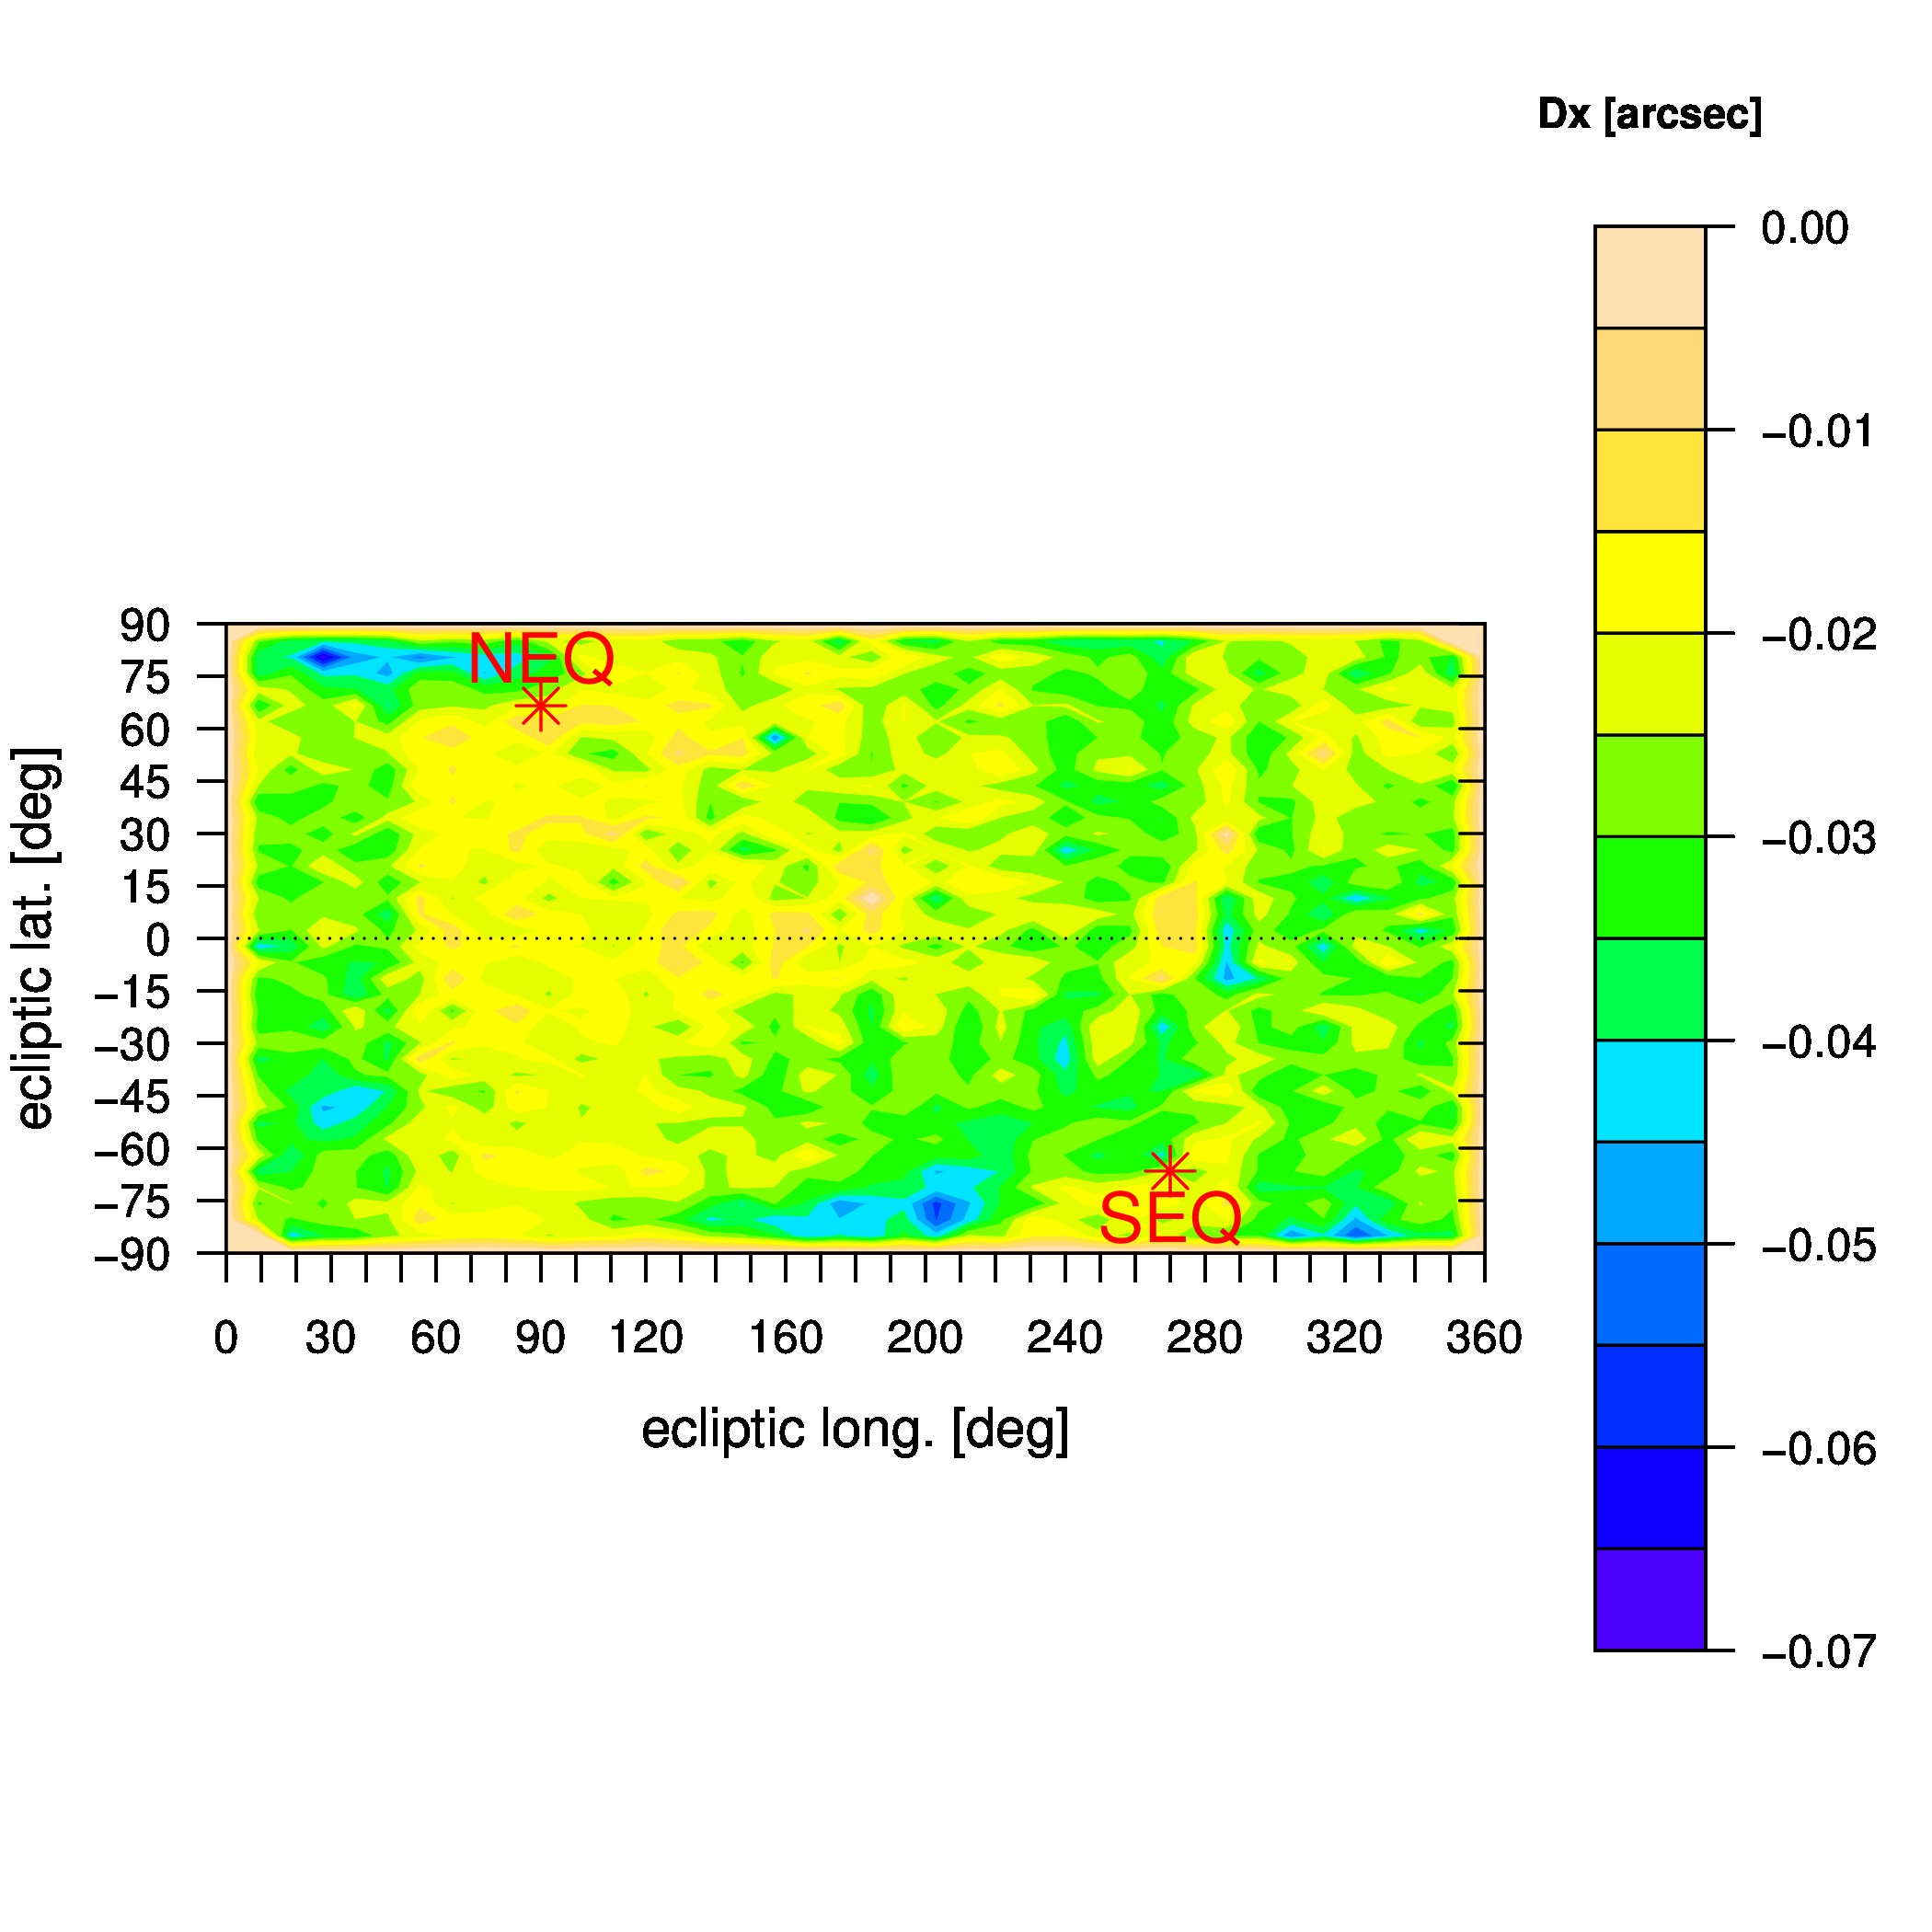 |
| Figure 1a - Sky distribution of differences in band 1 AllWISE Catalog and Atlas Image derived (intensity-weighted) positions along the image X-axis. The red asterisks mark the North and South Equatorial Poles. Click to enlarge. | Figure 1b - Sky distribution of differences in band 2 AllWISE Catalog and Atlas Image derived (intensity-weighted) positions along the image X-axis. The red asterisks mark the North and South Equatorial Poles. Click to enlarge. |
 |
 |
| Figure 1c - Sky distribution of differences in band 3 AllWISE Catalog and Atlas Image derived (intensity-weighted) positions along the image X-axis. The red asterisks mark the North and South Equatorial Poles. Click to enlarge. | Figure 1d - Sky distribution of differences in band 4 AllWISE Catalog and Atlas Image derived (intensity-weighted) positions along the image X-axis. The red asterisks mark the North and South Equatorial Poles. Click to enlarge. |
 |
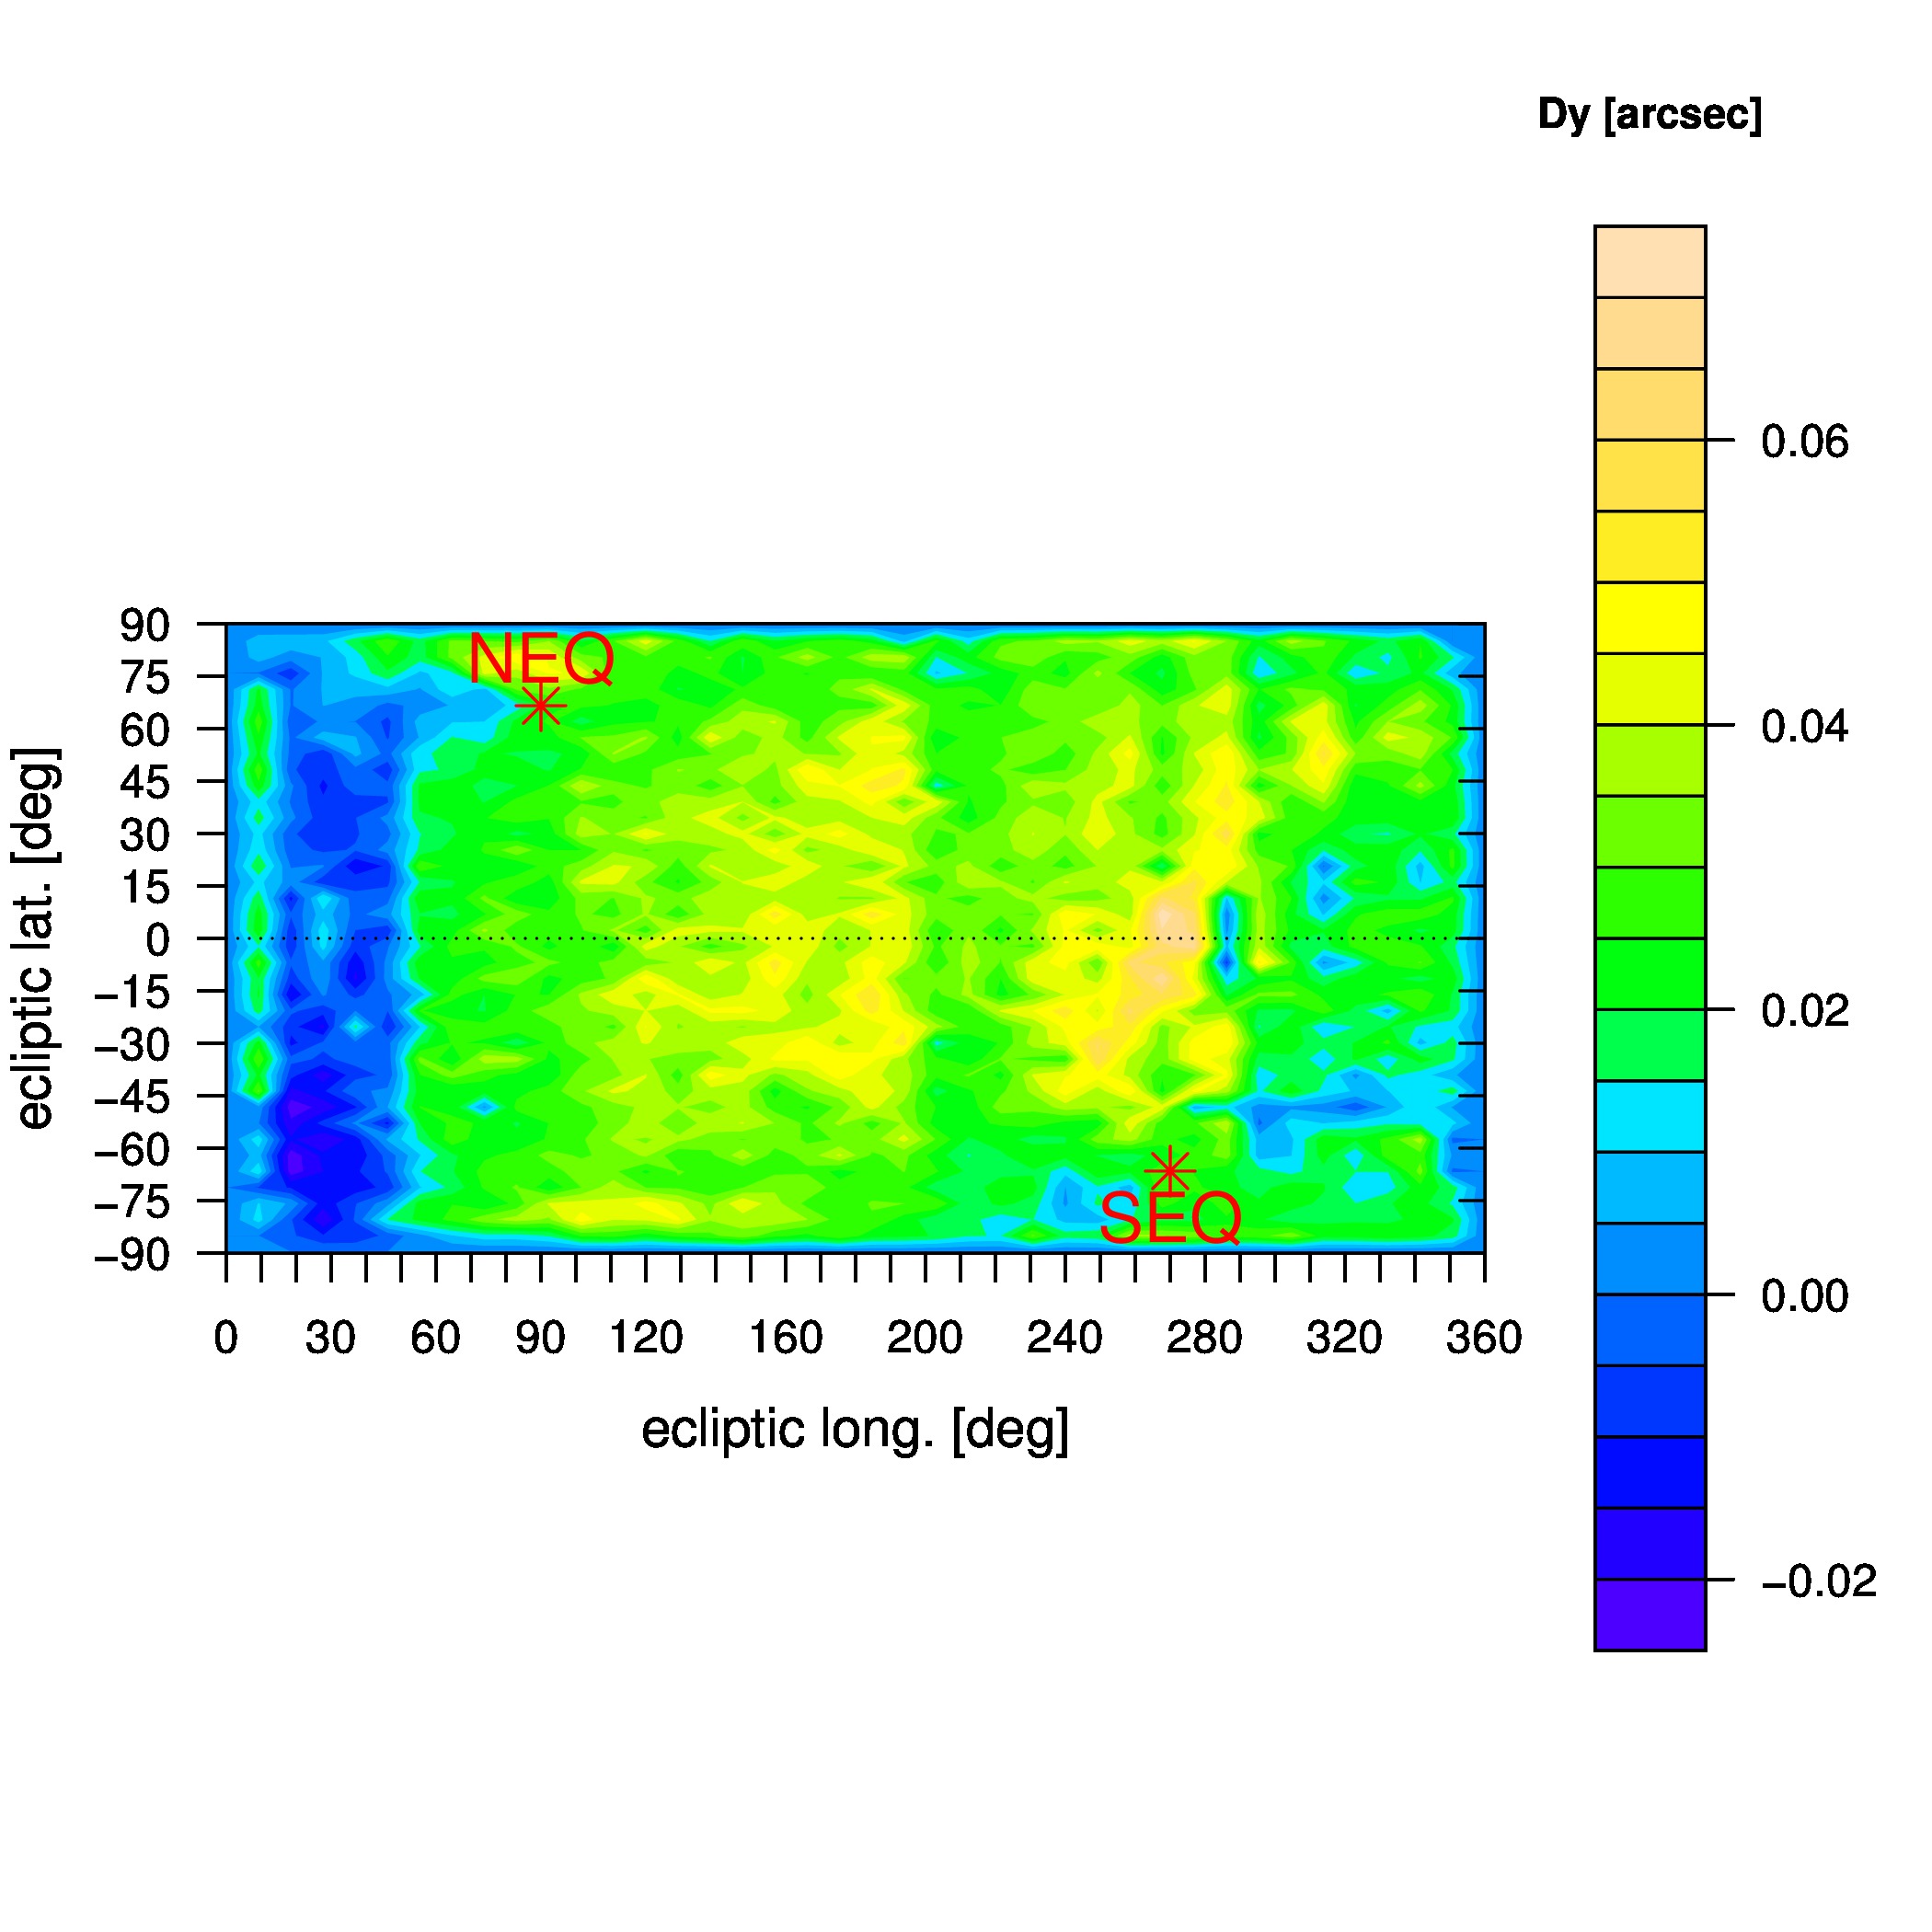 |
| Figure 2a - Sky distribution of differences in band 1 AllWISE Catalog and Atlas Image derived (intensity-weighted) positions along the image Y-axis. The red asterisks mark the North and South Equatorial Poles. Click to enlarge. | Figure 2b - Sky distribution of differences in band 2 AllWISE Catalog and Atlas Image derived (intensity-weighted) positions along the image Y-axis. The red asterisks mark the North and South Equatorial Poles. Click to enlarge. |
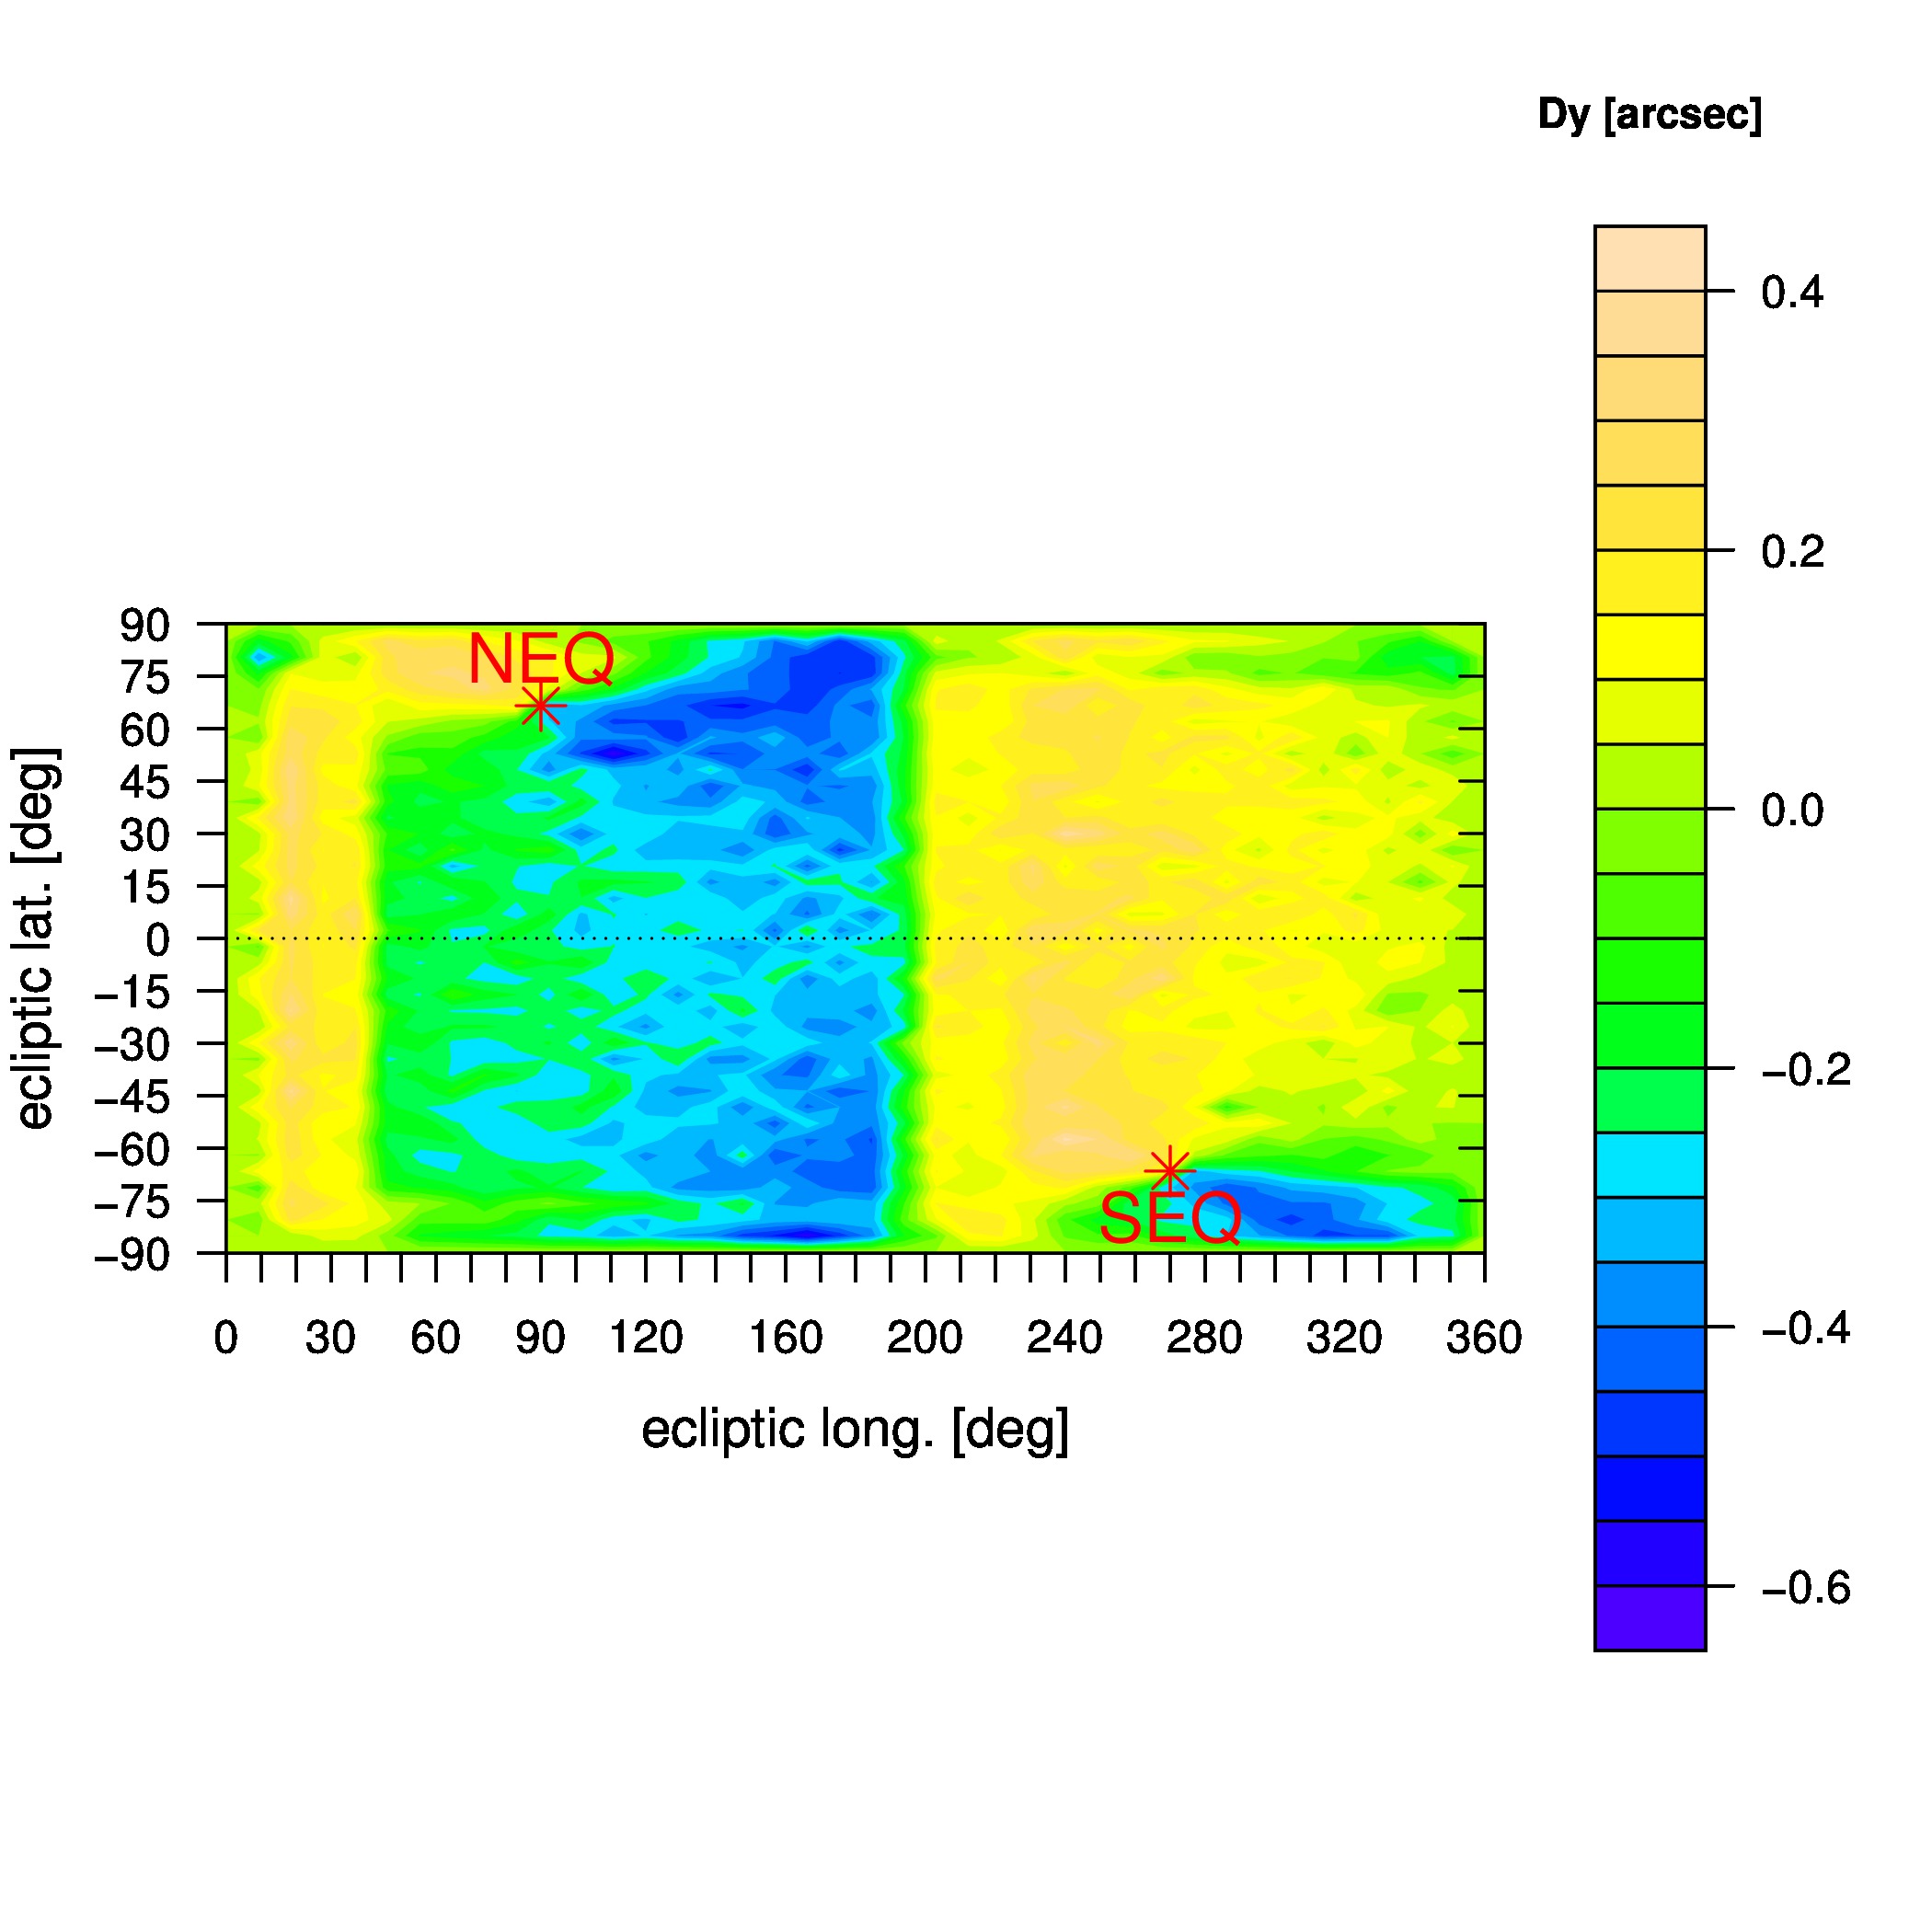 |
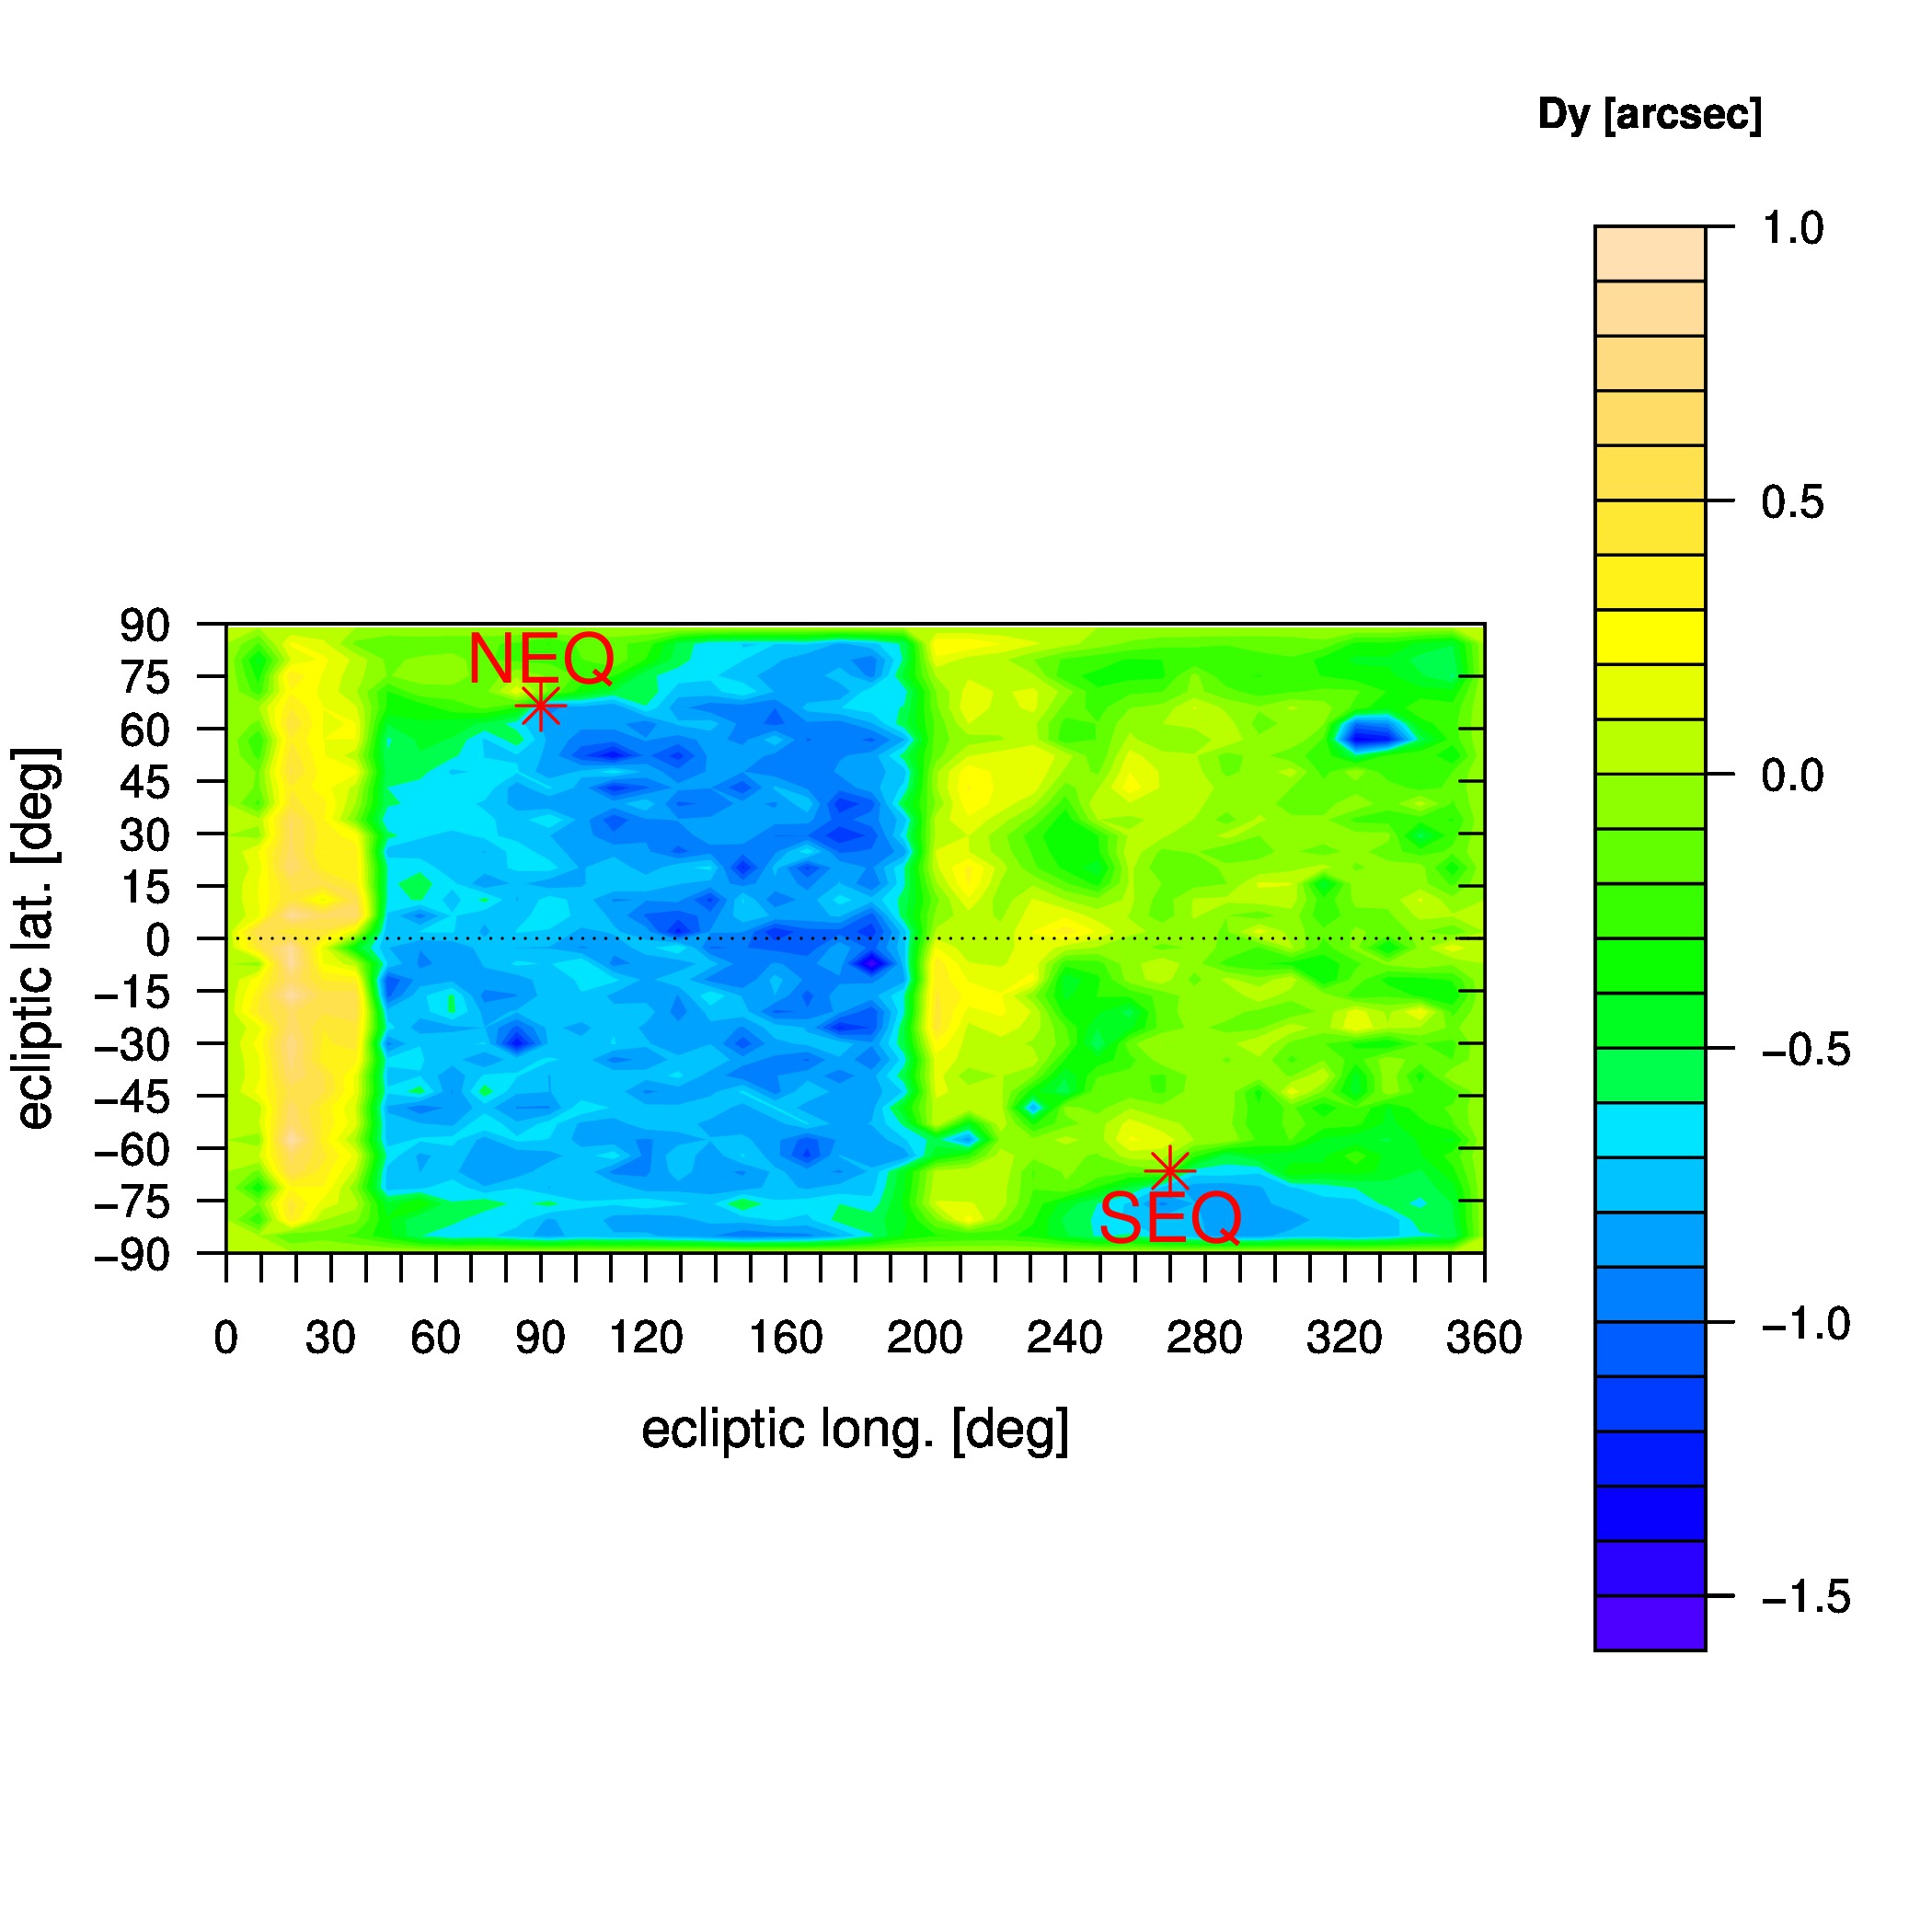 |
| Figure 2c - Sky distribution of differences in band 3 AllWISE Catalog and Atlas Image derived (intensity-weighted) positions along the image Y-axis. The red asterisks mark the North and South Equatorial Poles. Click to enlarge. | Figure 2d - Sky distribution of differences in band 4 AllWISE Catalog and Atlas Image derived (intensity-weighted) positions along the image Y-axis. The red asterisks mark the North and South Equatorial Poles. Click to enlarge. |
Last update: 19 Novembe 2013