


As noted in section I.4.c.iii, one may find a systematic difference between the equatorial (J2000) positions of sources determined off Atlas Images, e.g., via a flux-weighted centroid or peak-finding algorithm, and astrometrically calibrated positions from the WISE Source Catalog. For reasons not yet understood, these biases don't always exist, but when they do, their magnitude and direction vary with location on the sky (e.g., see Figure 3) and between bands (Figure 1). The biases are generally (and considerably) larger for W3 and W4 than for W1 and W2 (see below). We outline below a procedure on how to check for biases and correct the image-derived source positions and/or Atlas Image WCS in general.
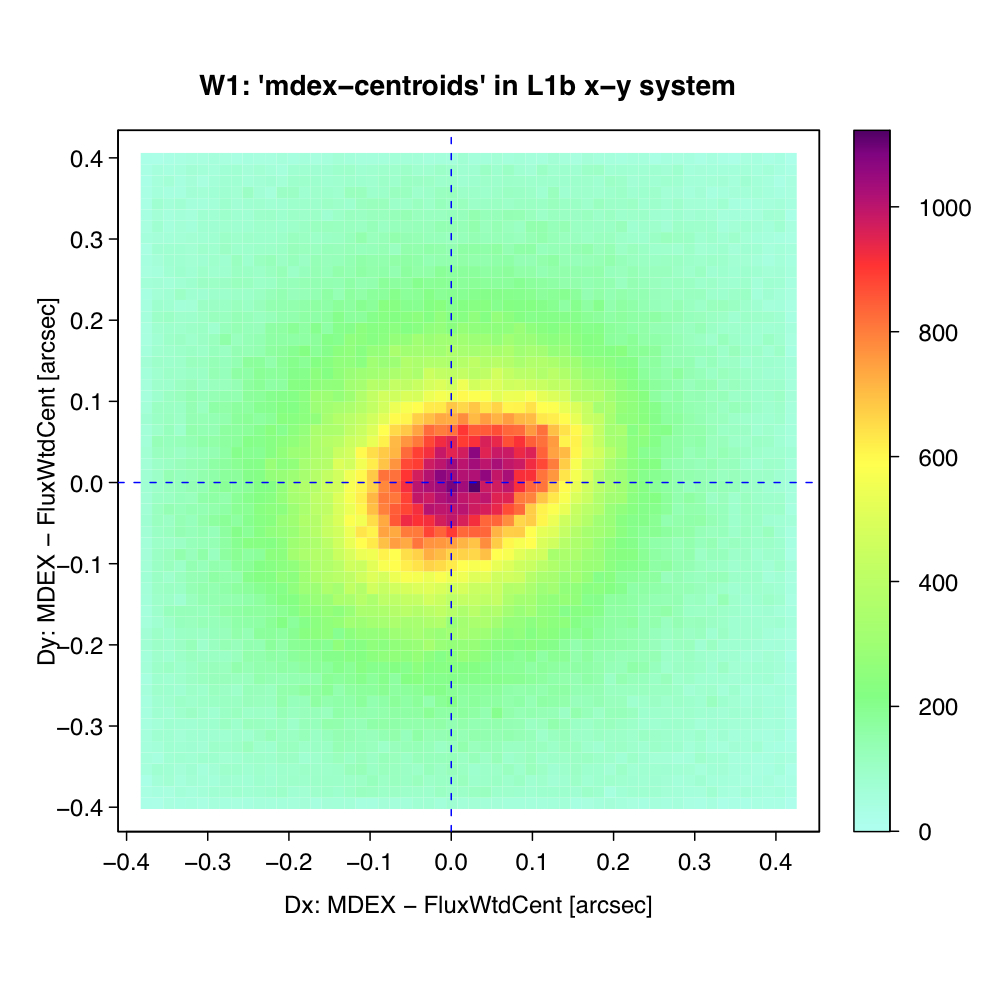
Source-peak to astrometric biases are also present in the single-exposure images but at a much lower level (Table 1 and Figure 4). These biases are fixed in the single-exposure x,y coordinate frame and like the Atlas Images, are also relatively larger in W3 and W4. After testing and eliminating numerous hypotheses, one explanation remains. This is the presence of non-negligible systematic errors in the distortion and/or astrometric calibration for the longer wavelength single-exposures relative to W1 that get amplified by the distortion correction and reprojection routines in the co-adder. Evidence suggesting this is that first, the same (long wavelength) astrometric biases are seen from at least three different image co-adders that recognize the "SIP-distortion" representation: AWAIC; Montage; and MOPEX. This is independent of the interpolation method used. Second, the fact that the W1 Atlas Images exhibit negligible biases from all co-adders (e.g., as shown in Figure 2a) implies the W1 distortion and astrometry is well calibrated and appropriately handled by all software. What's not yet understood is why the co-adding software amplifies the single-exposure biases for the long wavelength bands, becoming progressively worse in W2, W3, and W4. Therefore, it appears that if the single-exposure inputs are "perfect" going in, the co-adder outputs are also.
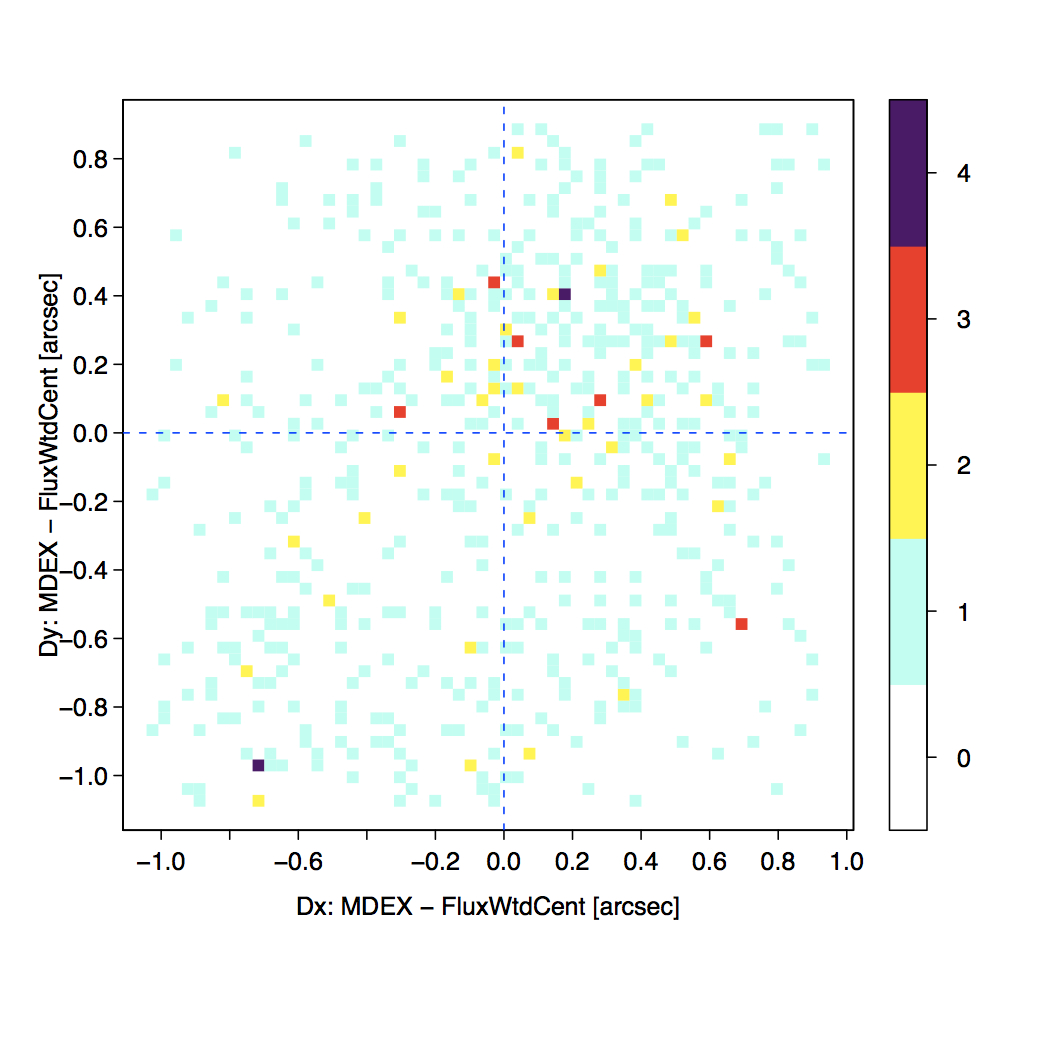
From a set of 50 Atlas Images widely distributed over the sky, we find that the absolute (radial) differences between image-derived source peaks and "true" astrometric positions are typically <~ 0.25 arcsec in bands 1 and 2, and <~ 1.2 arcsec in bands 3 and 4. These are 90th percentile upper limits in the radial distributions determined from the x-y scatter plots in Figure 2. While generating the all-sky atlas, we attempted to compensate for the incoming single-exposure source centroid position biases by dynamically recentering the co-adder's convolution kernels. This simply made the 2D distributions in "astrometric - image derived" offsets have an overall median of ~ 0 on each axis. However, a bimodal pattern still remains, particularly in bands 3 and 4 (see Figures 2c and 2d).
We strongly advise using the catalogued source position if available, otherwise, if you would like the equatorial coordinates of a source in an Atlas Image not in the catalog, e.g., because it didn't satisfy the catalog selection criteria, we recommend using the procedure below to check and correct for any significant biases.
δRA = RAt - RAp,
(Eq. 1)
δDec = Dect - Decp,
then use these to estimate your unknown astrometric positions:
RAu = RAp - δRA,
(Eq. 2)
Decu = Decp - δDec.
Caution must be exercised near an equatorial pole due to the strong Dec dependence of the correction along RA. Here you will need to use RA corrections calibrated at approximately the same Dec as your unknown source positions (if available), otherwise we recommend using the more generic pixel-based coordinate method in step 4.
δx = xt - xp [pixels],
(Eq. 3)
δy = yt - yp [pixels],
where xp, yp are "source-peak" positions measured as either positions of the maxima of source signals, or intensity-weighted centroids measured within apertures centered on your astrometric priors xt, yt. Example scatter plots of the corrections per axis for a collection of Atlas Images are shown in Figure 2. After computing the median or trimmed-average correction along each axis, ⟨δx⟩, ⟨δy⟩, these can be applied to the reference-pixel WCS keywords CRPIX1,CRPIX2 (always = 2048, 2048) in Atlas Image headers:
CRPIX1new = 2048 - ⟨δx⟩
(Eq. 4)
CRPIX2new = 2048 - ⟨δy⟩
After replacing the CRPIX1,CRPIX2 values in your Atlas Image FITS header with those from Eq. (4), you can re-extract your sources and they will be astrometricaly calibrated. Dangers at the equatorial poles are circumvented if your source-finding/extraction software properly handles WCS transformations when converting from pixels to RA, Dec.
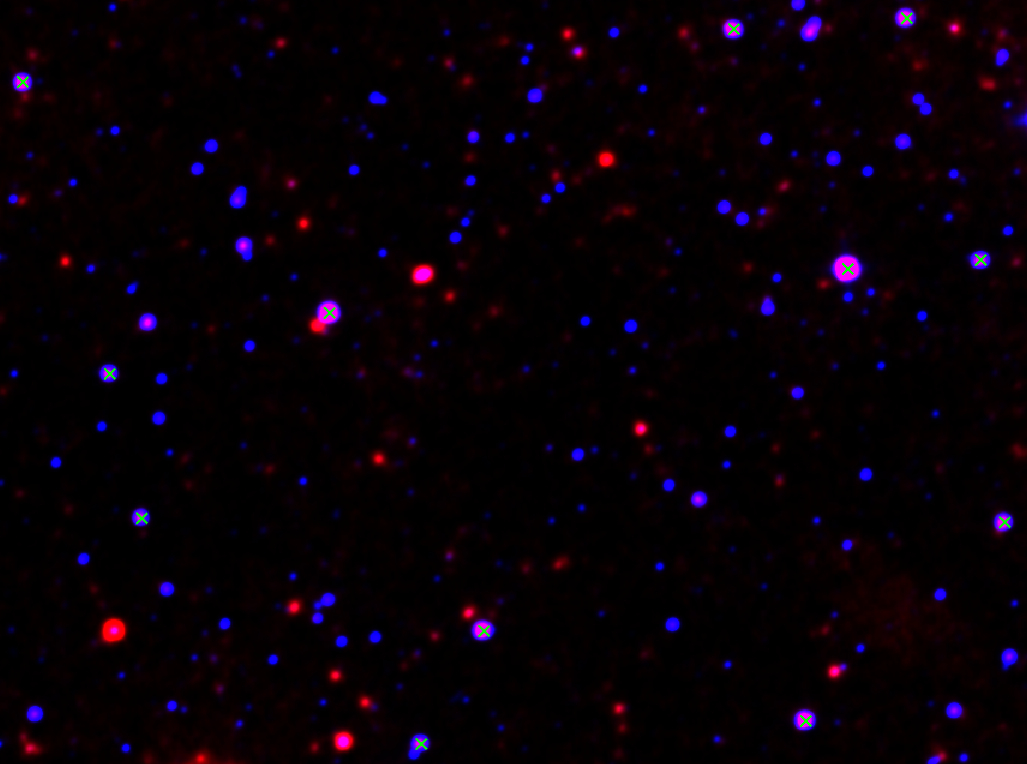 |
| Figure 1 - Section of an Atlas Image (ID 2726p651_ab41) showing an overlay of bands 1 (blue) & 3 (red). There is a ~0.6 arcsec misalignment between the band 1 and band 3 source centroids for this field with band 3 shifted to the left relative to band 1. The "true" astrometric positions (green crosses) are more in line with the band 1 centroid positions for this image [click to enlarge]. |
 |
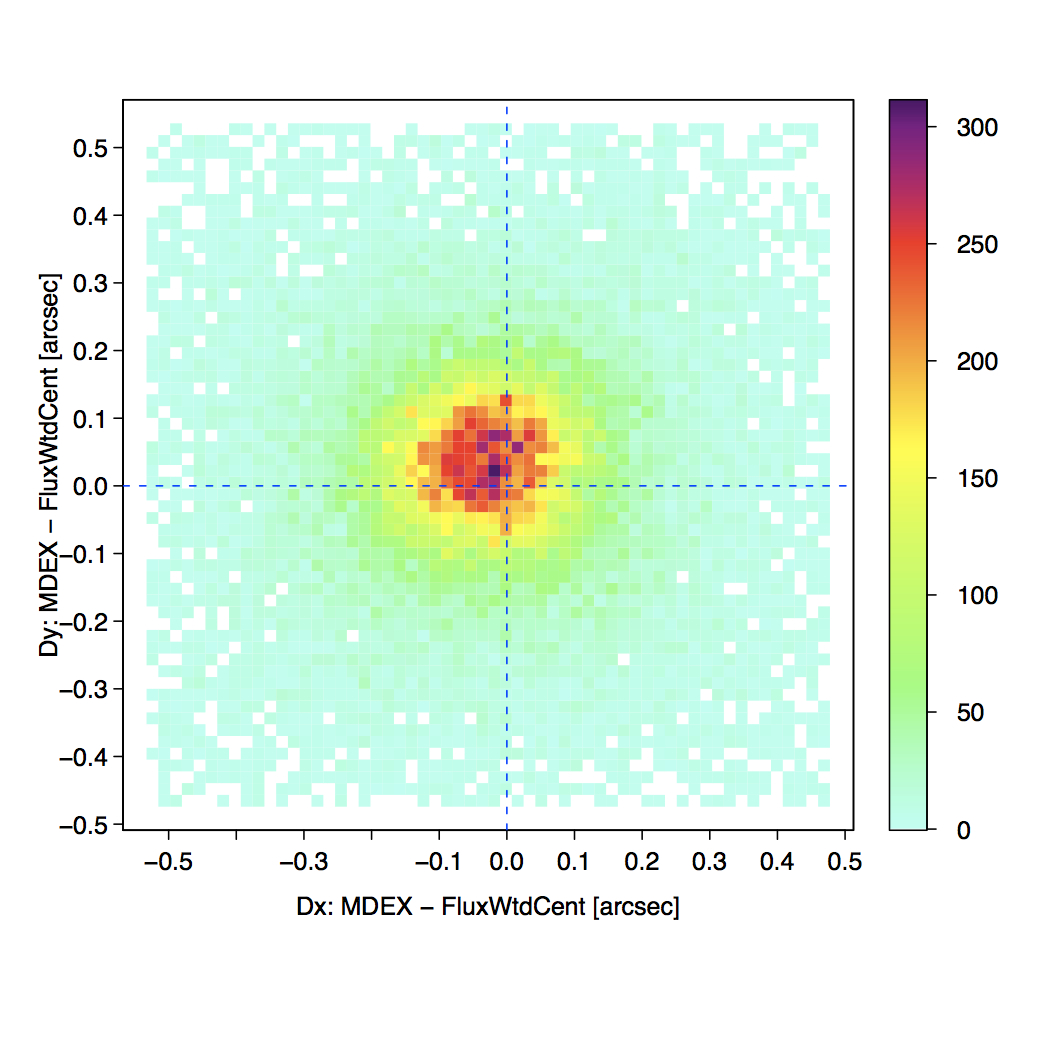 |
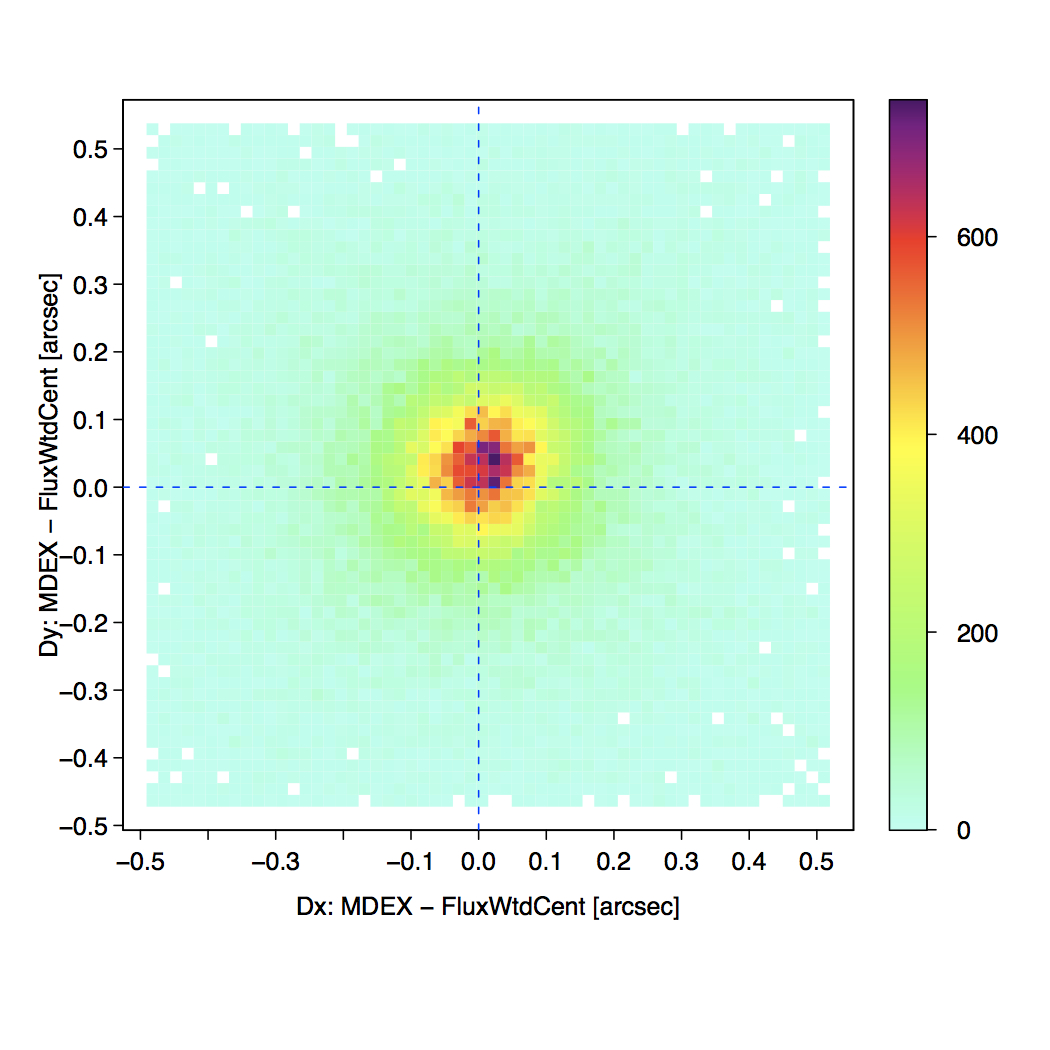
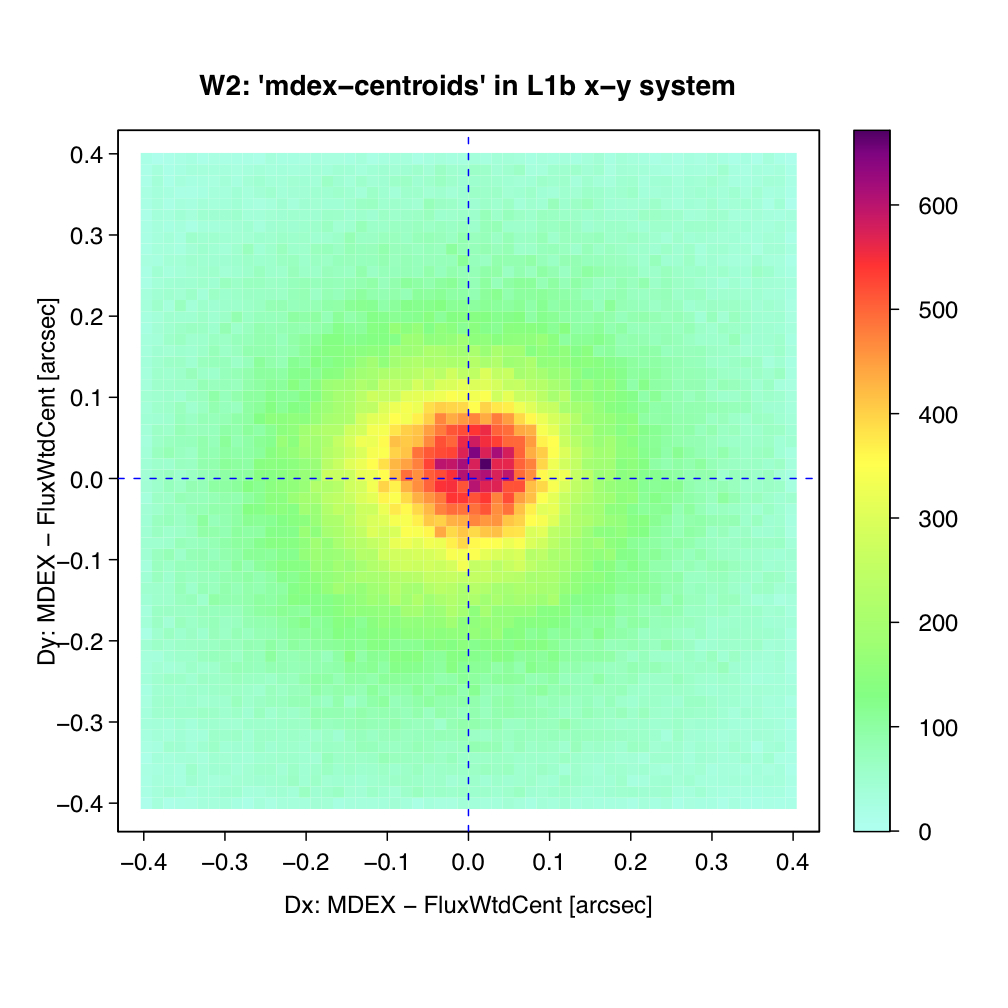
| Figure 2a - x-y density plot of 'astrometric - flux-weighted centroid' positions using extractions from several band 1 Atlas Images. | Figure 2b - x-y density plot of 'astrometric - flux-weighted centroid' positions using extractions from several band 2 Atlas Images. |
 |
 |
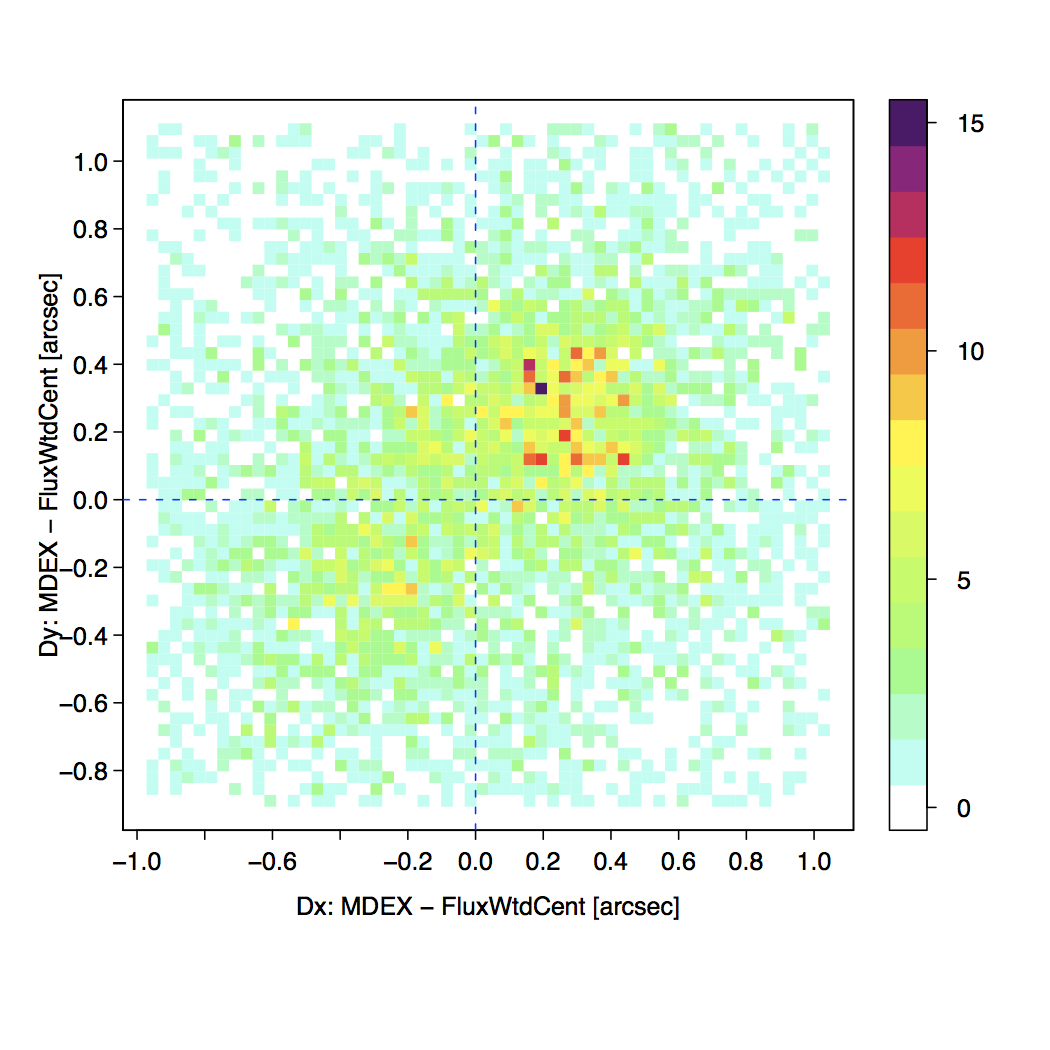
| Figure 2c - x-y density plot of 'astrometric - flux-weighted centroid' positions using extractions from several band 3 Atlas Images. | Figure 2d - x-y density plot of 'astrometric - flux-weighted centroid' positions using extractions from several band 4 Atlas Images. |
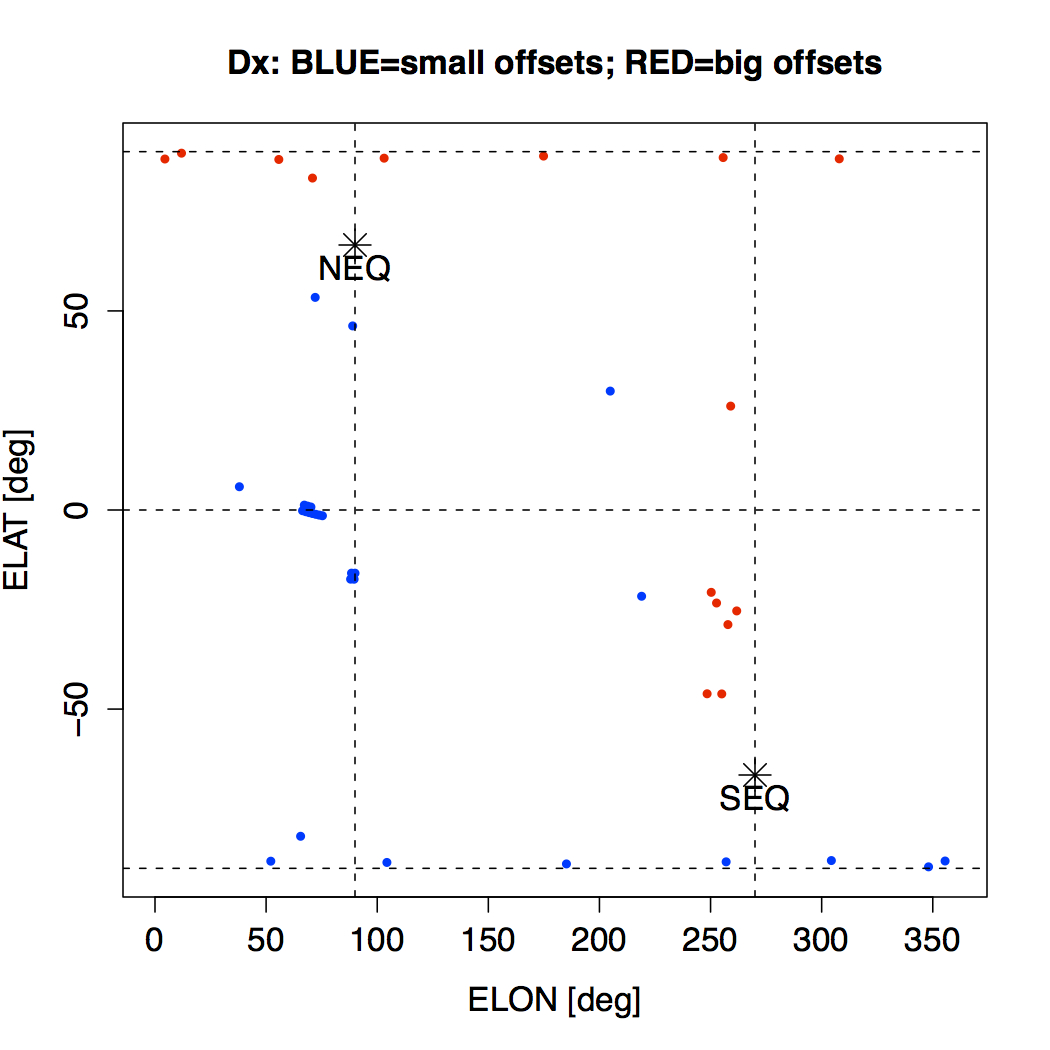 |
| Figure 3 - Ecliptic latitude vs longitude distribution of small (< 0.1 arcsec: blue) and large (> 0.3 arcsec: red) offsets in "astrometric - flux-weighted source centroid" positions for 43 band 3 Atlas Images. I.e., with extractions originating from each cloud of the bimodal distribution in Figure 2c. Only x-axis offsets are shown. The distribution in Δy is similar. This dependence with sky location is only seen for bands 3 and 4. The points labelled NEQ and SEQ refer to the North and South Equatorial poles respectively. |
For reference, Table 1 summarizes the differences between source positions derived from image-intensity-weighted centroids and astrometric ("true") positions in the x, y coordinate system of the single-exposure images. The latter are from the solutions of PSF-fit photometry off the single-exposures. The δx, δy are based on the results in Figure 4 and are computed using trimmed-medians. Uncertainties are derived from half the 84th - 16th percentile range per axis divided by √N. As mentioned above, the single-exposure offsets in Table 1 do not vary with location on the sky, but those for Atlas Images do. Therefore, do not use Table 1 to correct the Atlas Image WCS or source positions extracted therefrom. Use the procedure outlined in section II.3.g.i.
| Band | #sources used | δx [arcsec] |
σδx [arcsec] |
δy [arcsec] |
σδy [arcsec] |
δr = √(δx2+δy2) [arcsec] |
|---|---|---|---|---|---|---|
| 1 | 1609914 | 0.00712 | 0.00044 | 0.00354 | 0.00045 | 0.00795 |
| 2 | 877749 | -0.00817 | 0.00064 | -0.00625 | 0.00061 | 0.01028 |
| 3 | 949945 | 0.08649 | 0.00133 | -0.02010 | 0.00135 | 0.08879 |
| 4 | 46899 | 0.04984 | 0.01361 | -0.11834 | 0.0137 | 0.12841 |
 |
 |
| Figure 4a - x-y density plot of 'astrometric - flux-weighted centroid' positions using extractions from band 1 single-exposure images. See Table 1 for statistics. | Figure 4b - x-y density plot of 'astrometric - flux-weighted centroid' positions using extractions from band 2 single-exposure images. See Table 1 for statistics. |
 |
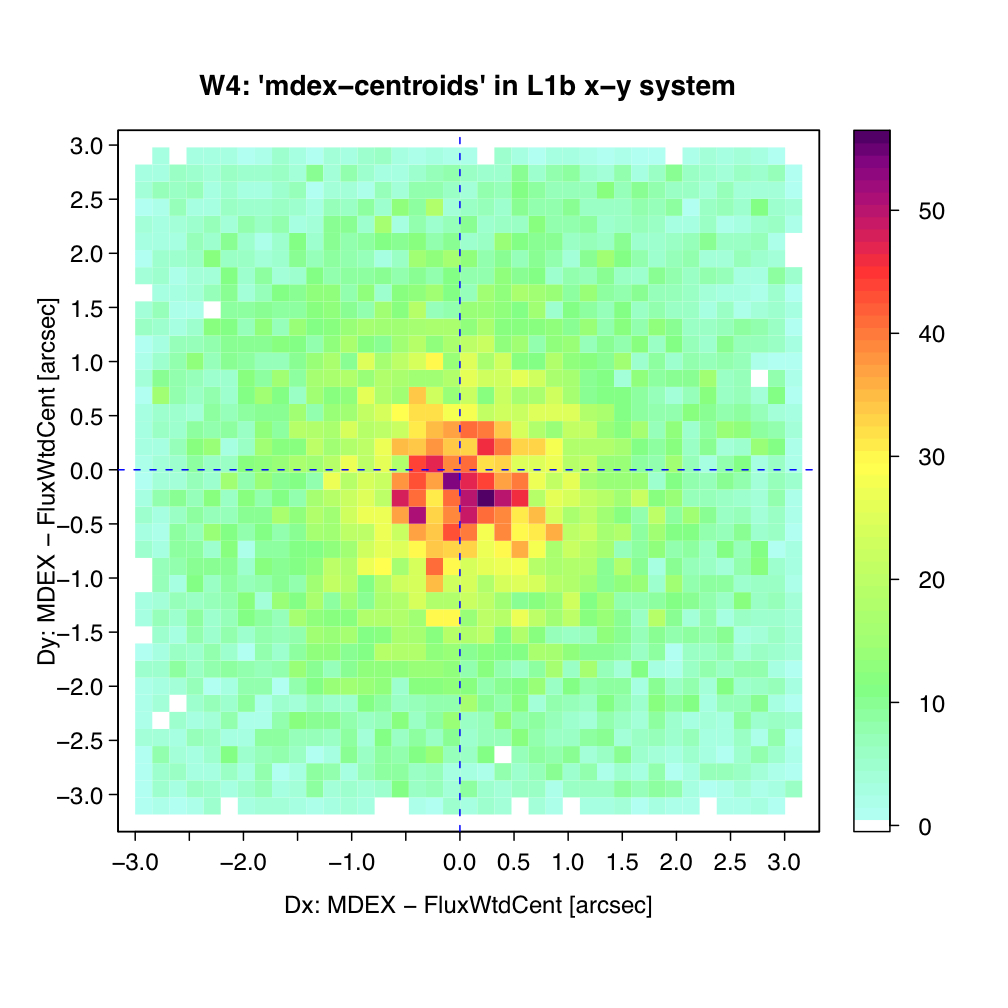 |
| Figure 4c - x-y density plot of 'astrometric - flux-weighted centroid' positions using extractions from band 3 single-exposure images. See Table 1 for statistics. | Figure 4d - x-y density plot of 'astrometric - flux-weighted centroid' positions using extractions from band 4 single-exposure images. See Table 1 for statistics. |
Last update: 2012 March 15