


With the addition of a second coverage of the sky in the short wavelength bands, AllWISE achieves significantly better sensitivity in W1 and W2 than the WISE All-Sky data release. Because of processing improvements for AllWISE, from comparison to external data, sensitivity away from the Galactic plane is also improved for W3 and W4, even though AllWISE contains no new data in these bands. The sensitivity of the All-Sky release Catalog is characterized in section VI.3.a. of the All-Sky Data Release Explanatory Supplement. WISE sensitivity varies with position on the sky due to systematic changes in the depth of coverage and the zodiacal foreground emission, both of which improve towards the ecliptic poles, and in the local source density (primarily due to Galactic sources) which limits sensitivity because of confusion.
The estimated AllWISE and All-Sky Catalog sensitivities for low coverage sky away from the Galactic plane are given in Table 1 below. Flux densities in micro-Janskies have been calculated using using the flux zero points from Wright et al 2010, also given in the right hand column of Table 1 of section IV.4.h.i in the All-Sky Release Explanatory Supplement.
| Noise Model | ||||||
| Band | External Check1 | COSMOS2 | 95%3 | |||
|---|---|---|---|---|---|---|
| AllWISE | All-Sky | AllWISE | All-Sky | AllWISE | All-Sky | |
| W1 (3.4µm) | 54 | 68 | 26 | 35 | 28 | 37 |
| W2 (4.6µm) | 71 | 111 | 56 | 70 | 62 | 79 |
| W3 (12µm) | 730 | 860 | 690 | 590 | 760 | 670 |
| W4 (22µm) | 5000 | 5700 | 5200 | 4700 | 5700 | 5100 |
Notes to Table 1
|
||||||
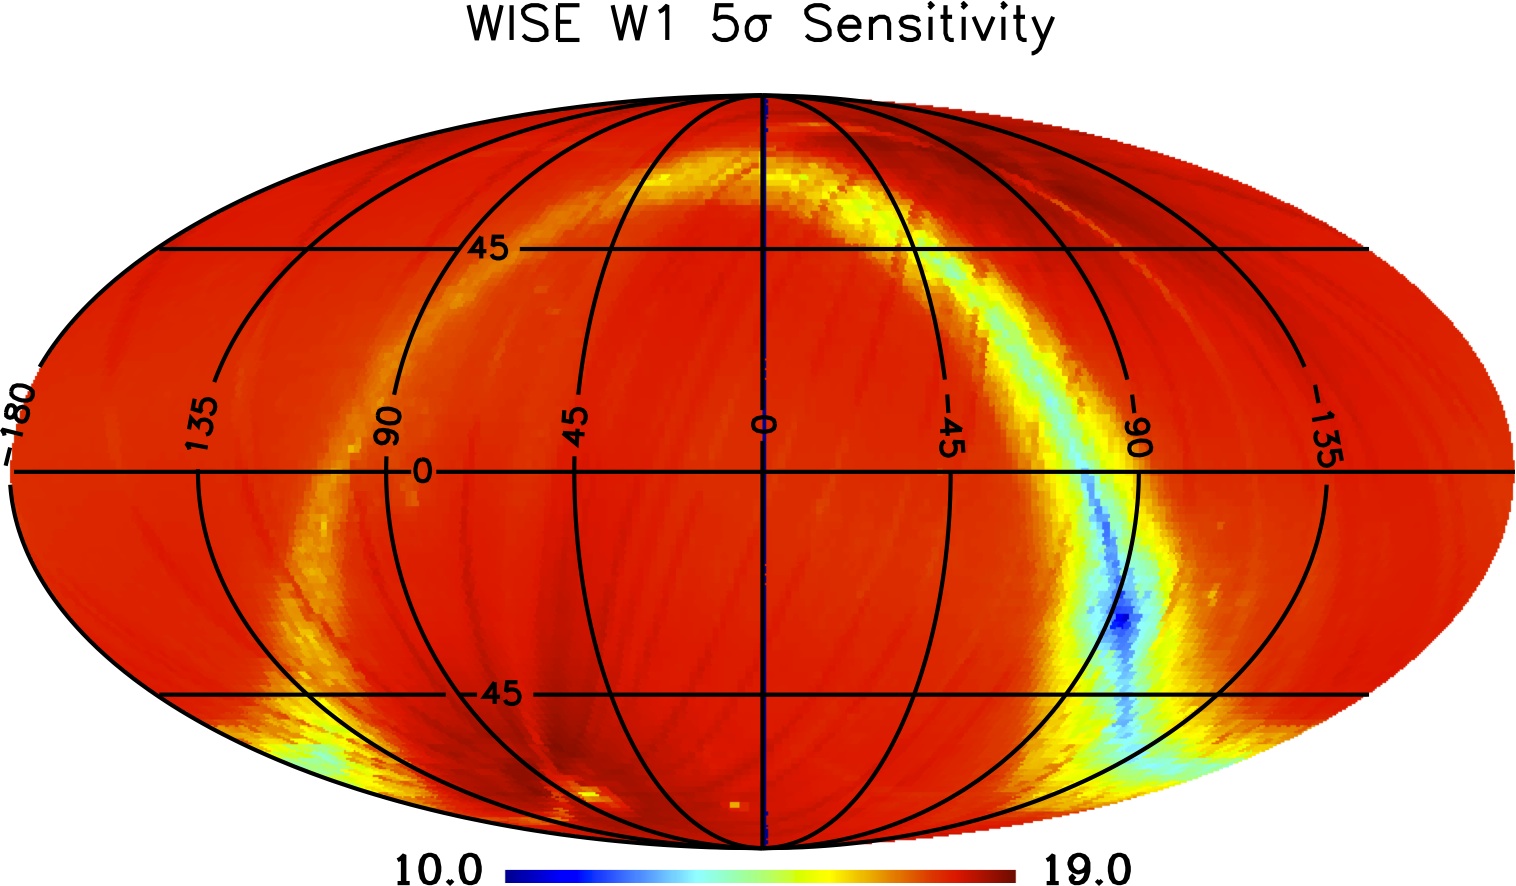
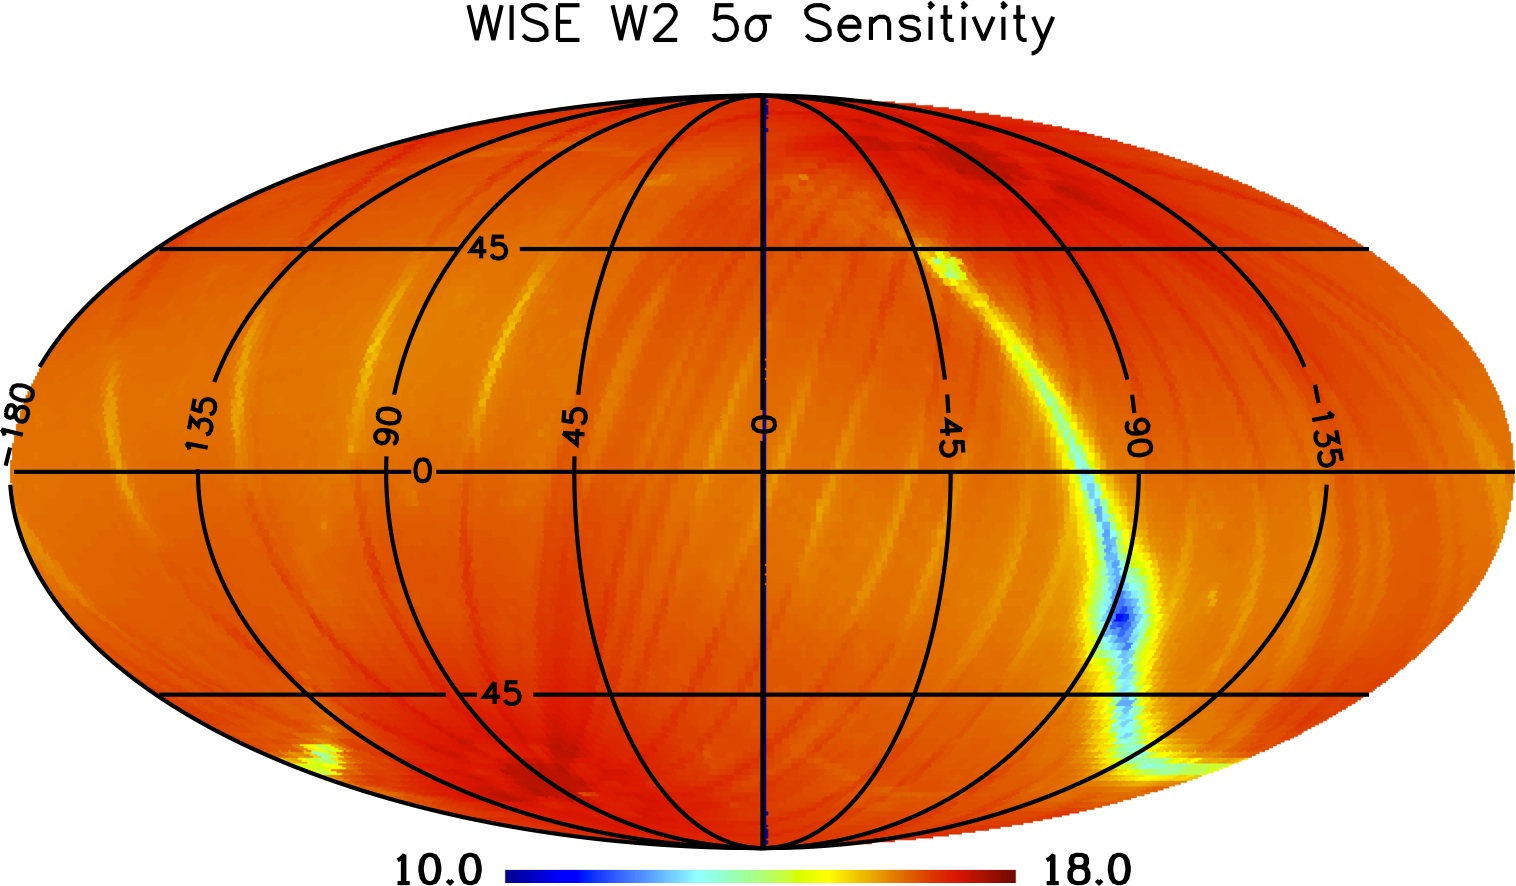
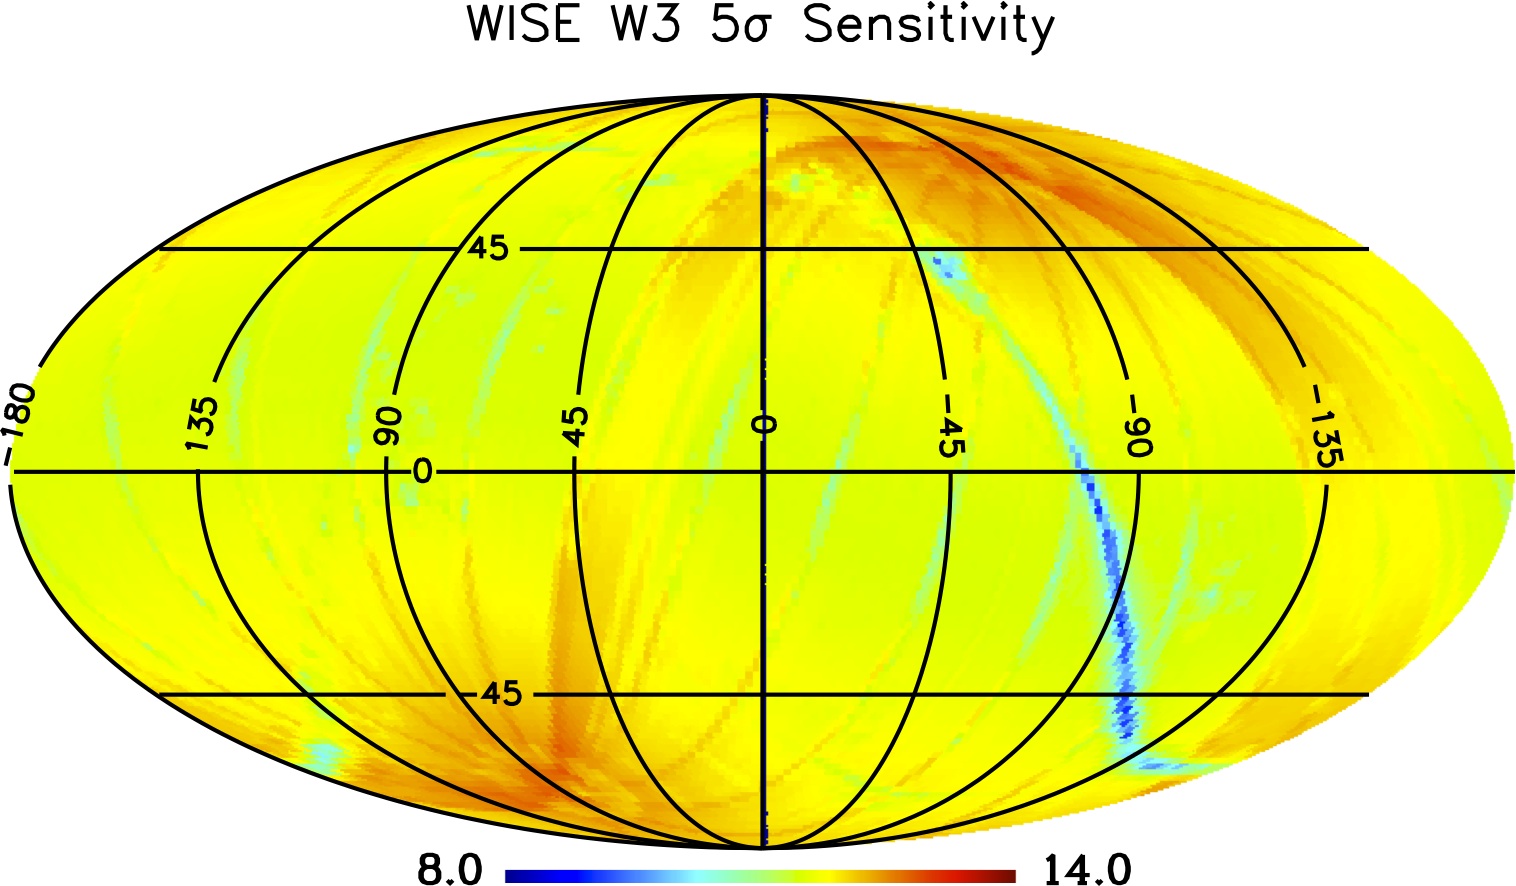
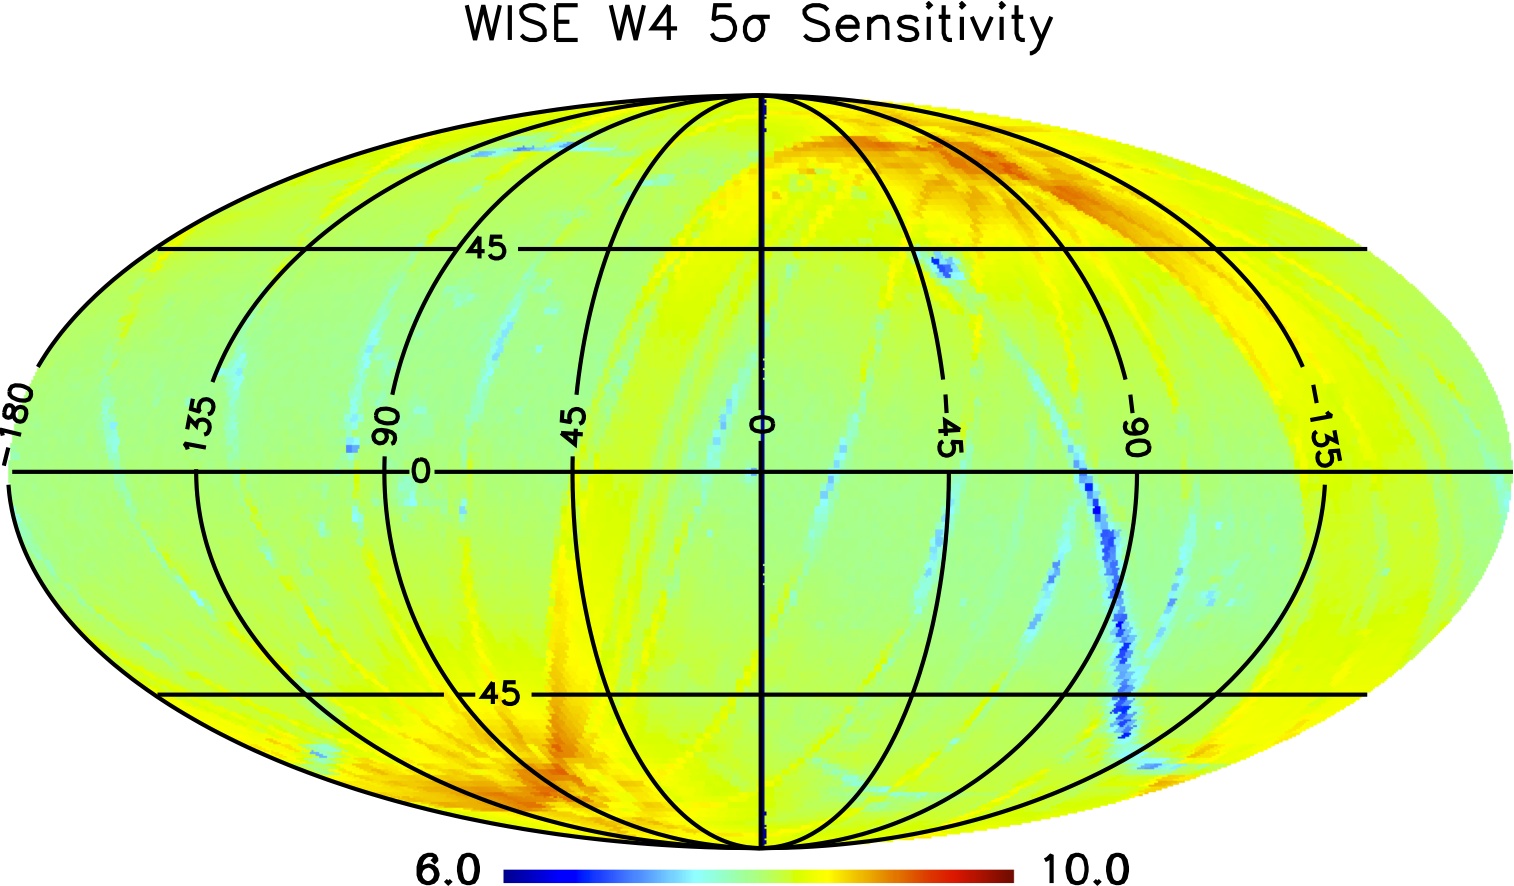
Figure 1 shows the variation over the sky of the the magnitude corresponding to SNR 5 from the profile-fit photometry noise model for the four WISE bands, plotted in equatorial coordinates. Table 2 lists the magnitudes corresponding to SNR 5, 7, and 10 from the noise model for each tile in order of declination. For convenience the tile identification (coadd_id), and equatorial, Galactic, and ecliptic coordinates are also provided.
 |
 |
| W1 | W2 |
 |
 |
| W3 | W4 |
| Figure 1 - Magnitude at SNR 5 vs. position on the sky (equatorial projection) from the profile-fit photometry noise model for AllWISE. | |
Sensitivity in the W1 and W2 bands was assessed by comparing to the much deeper measurements of sources available in the COSMOS field at 3.6 and 4.5 µm from the Infrared Array Camera (IRAC) on the Spitzer Space Telescope. While Spitzer data are only available for a small fraction of the all-sky area covered by WISE, the larger aperture, better image quality, and longer exposure time on COSMOS allow magnitudes from Spitzer in these bands (hereafter referred to as [3.6] and [4.5]) to be regarded as a "truth set" for evaluating the limiting flux sensitivity in W1 and W2.
For the 12 µm W3 band, there is no closely comparable Spitzer filter, and other data sources do not provide substantial numbers of sources with fluxes below 1 mJy. However when expressed in Vega magnitudes, the 5σ sensitivity of W3<12 corresponds to much brighter stellar photospheres than the >14 mag 2MASS limits. The < 3" FWHM of 2MASS is also better than WISE, so by selecting stars based on their 2MASS morphologies and 2MASS, W1, and W2 colors, W3 magnitudes can be predicted. Although the Spitzer MIPS 24 µm band is comparable to the WISE 22 µm W4 band, there are relatively few sources observed by Spitzer brighter than 5 mJy (the approximate SNR 5 limit for W4) at 24 µm. Therefore a similar approach to that used for W3 was applied to W4, selecting stars brighter than 9th magnitude, and predicting their W4 magnitudes based on W3 and 2MASS.
The S-COSMOS survey of the Hubble Space Telescope COSMOS field mapped this two square degree field with IRAC and MIPS to much greater depth than WISE. The COSMOS field, centered at at 10h 00m 28.6s +02d 12m 21.0s, is useful for assessing the AllWISE sensitivity because with its relatively low ecliptic latitude (-9°) it has a coverage depth of 23 exposures in AllWISE for W1 and W2, close to the 95% sky coverage depth. Together with its high galactic latitude (-60°), this makes the COSMOS field representative of the performance achieved by AllWISE in unconfused regions over the bulk of the survey.
IRAC [3.6] and [4.5] flux densities measured in a 3.8 arcsec diameter aperture were downloaded from a 1.5 by 1.5 degree box centered on the COSMOS coordinates above, using the Spitzer Enhanced Imaging Products Source List from IRSA. Sources were required to have entries of 0 in the flux and soft saturation flags, and to have 3.6 µm flux densities > 10 µJy in the 3.8" aperture. To ensure a compact source whose flux could be compared to the WISE point source fitting photometry measurements, the 3.6 µm aperture corrected flux in the 5.8" diameter aperture was required to be less than 10% larger than that in the 3.8" diameter aperture. This returned 32,405 sources.
Those sources were uploaded and matched to W1 and W2 photometry in the AllWISE Multiframe Source Table, requiring a matching radius of 2", that the WISE extended source flag (ext_flg) was 0 and the proximity to a 2MASS extended source (xscprox) was null, and that the contamination and confusion flags (cc_flags) were '0' in all four WISE bands. Note that this database includes sources found in the Reject Table which are not in the released AllWISE Source Catalog, because they have AllWISE SNR < 5. This matching process returned 18,787 sources.
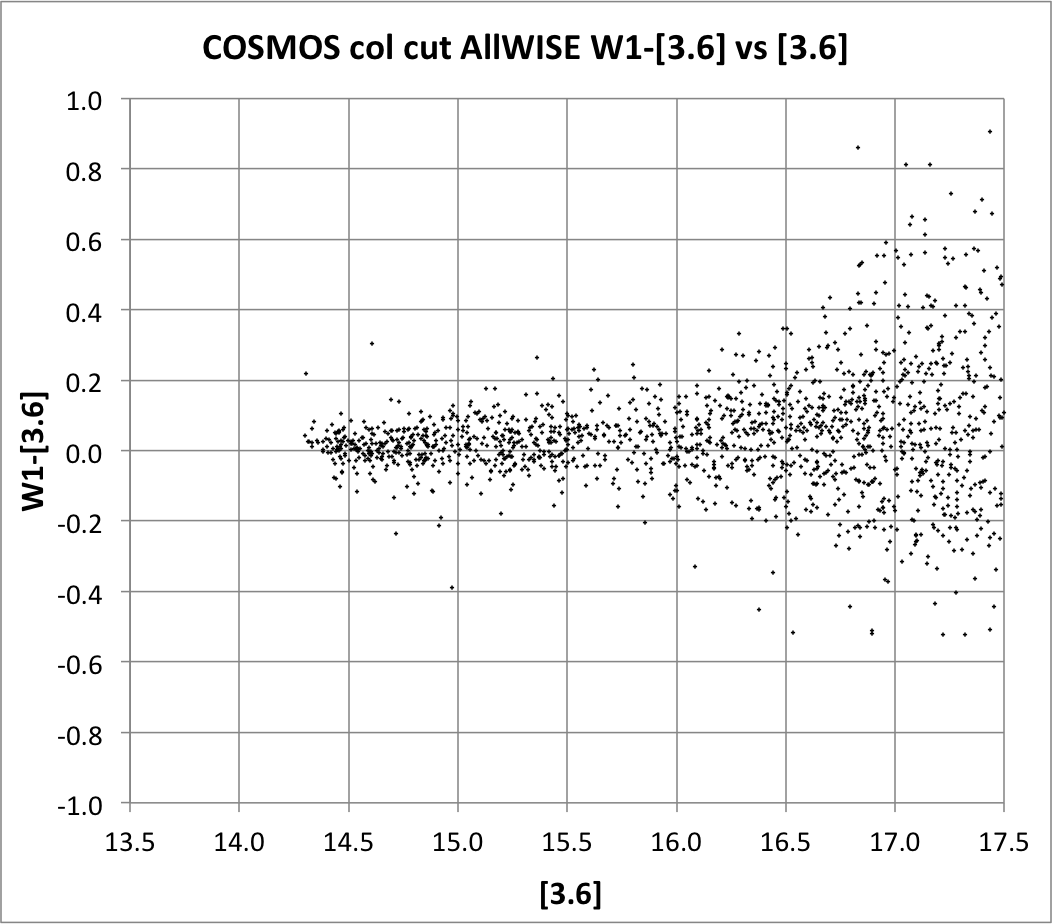
The difference between the 3.4 µm W1 band and the 3.6 µm Spitzer band is not negligible. Therefore, to minimize potential color terms and the possibility of intrinsic variations in source SEDs, the Vega-system color was required to be -0.1 < [3.6]-[4.5] < 0.0 (the equivalent limits in flux density ratios are 0.583 and 0.64 microJanskies. Adding this restriction leaves 1,845 sources which should have comparable IRAC [3.6] and AllWISE W1 photometry.
 |
 |
| Figure 2 – AllWISE W1 - Spitzer [3.6] photometry vs. [3.6] for stellar color sources in the COSMOS field. | Figure 3 –All-Sky W1 - Spitzer [3.6] photometry vs. [3.6] for stellar color sources in the COSMOS field. |
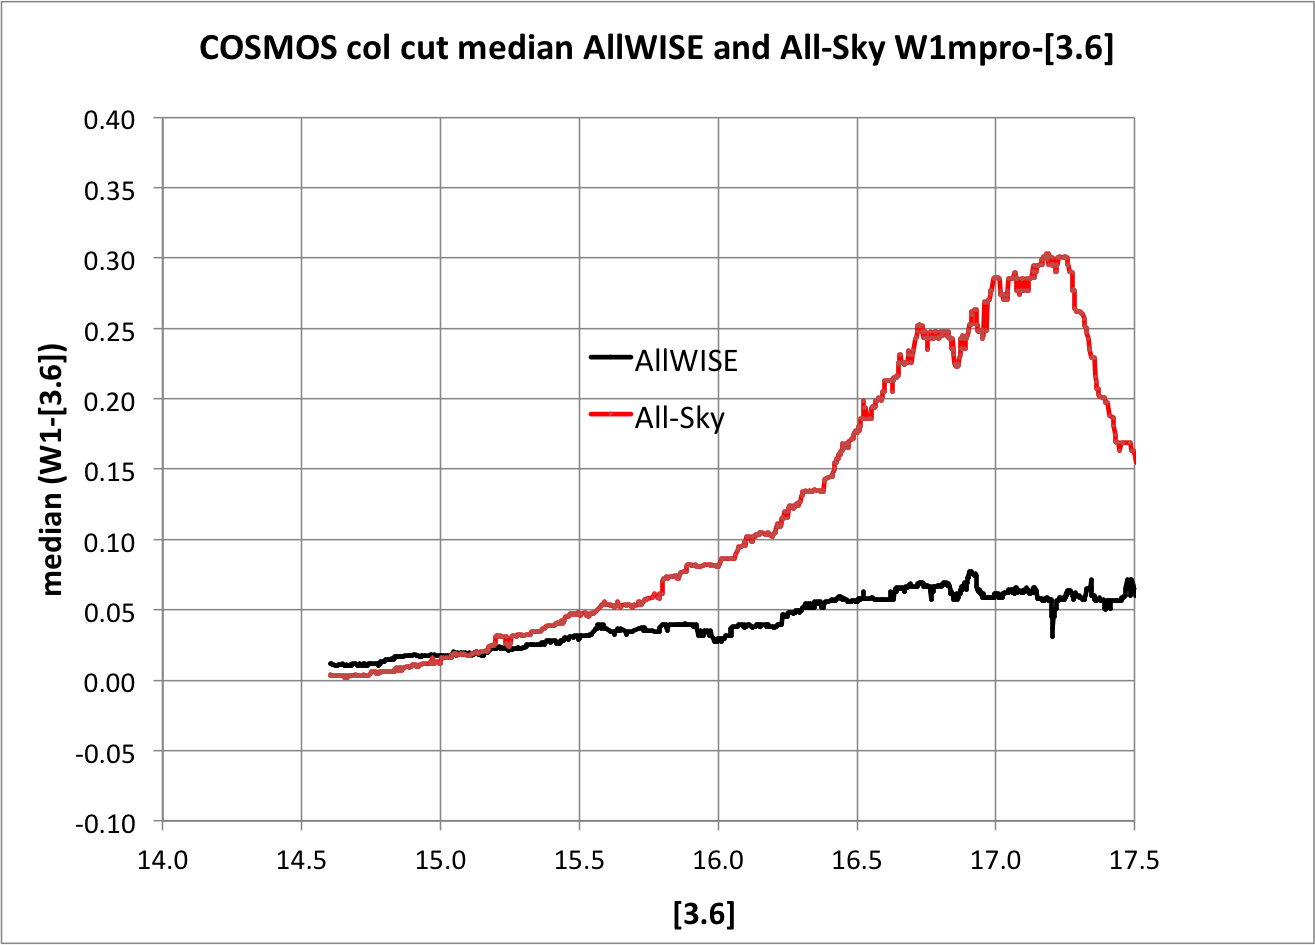 | 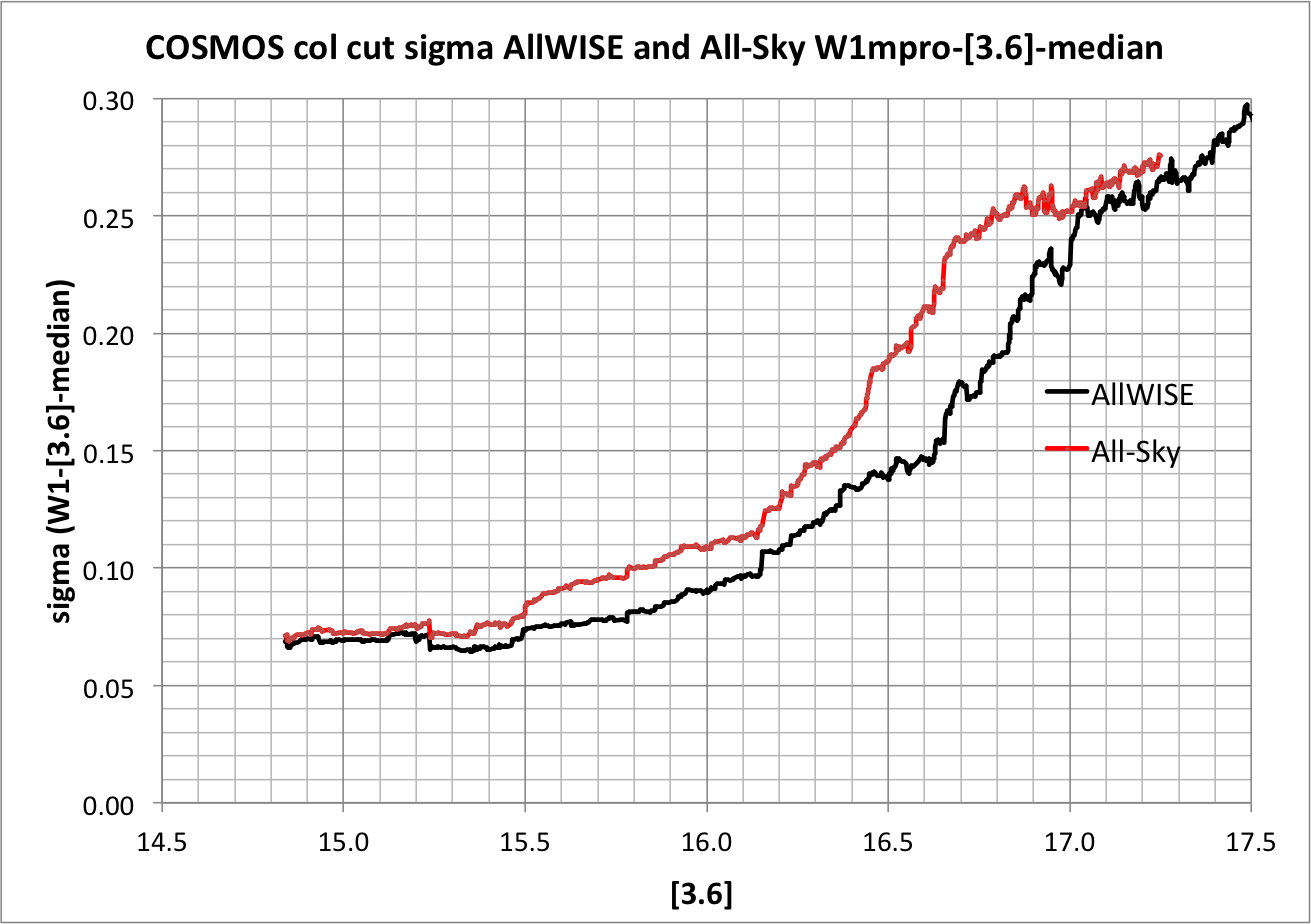 |
| Figure 4 – Median W1 - [3.6] color difference vs [3.6] for stellar color sources in the COSMOS field using AllWISE (black) and All-Sky (red) release data. | Figure 5 – rms of {W1 - [3.6] - median(W1-[3.6] from Figure 4)} vs [3.6] for stellar color sources in the COSMOS field using AllWISE (black) and All-Sky (red) release data. |
To estimate the W1 sensitivity, the sigma in W1 - [3.6] - the running median shown in Figure 4 was calculated for a moving window including 200 objects at a time and plotted against the median [3.6] in that window in Figure 5. Since mag = 2.5log10(flux) = [2.5/ln(10)]ln(flux) and thus d(mag) = [2.5/ln(10)] df/f, the rms mag error corresponding to a given SNR=f/df is just 2.5/[SNR*ln(10)] or 1.086/SNR. For SNR=5, the running median rms in AllWISE W1 - [3.6] is 0.217 mag at [3.6] = 16.90, significantly fainter than the 16.63 mag value for All-Sky W1. As noted above, All-Sky W1 magnitudes become systematically fainter than [3.6] magnitudes as [3.6] increases, so the All-Sky W1 magnitude which corresponds to a 5σ sensitivity is W1=16.84. Although this bias is largely removed in AllWISE, some flux underestimation persists, so that the AllWISE W1 magnitude which corresponds to a 5σ sensitivity is W1=16.96. However, because these magnitudes are biased too faint, the correct flux density to associate with SNR 5 is given by that for AllWISE W1 -[3.6] = 0, i.e. W1 = 16.90, or 54 µJy, vs. the 68 µJy value found for the All-Sky release.
A similar procedure to that for W1 was followed in comparing the W2 band to [4.5] COSMOS photometry, but because the W2 and [4.5] band passes are similar, no color cut was applied and all 18,787 sources could be compared. Many are too faint to be detected, even by AllWISE (Figure 6). Figure 7 shows the difference in All-Sky W2 and [4.5] photometry in red. As for W1, the trend in All-Sky photomtery for W2 magnitudes to become systematically fainter than [4.5] as a function of [4.5] magnitude is largely removed.
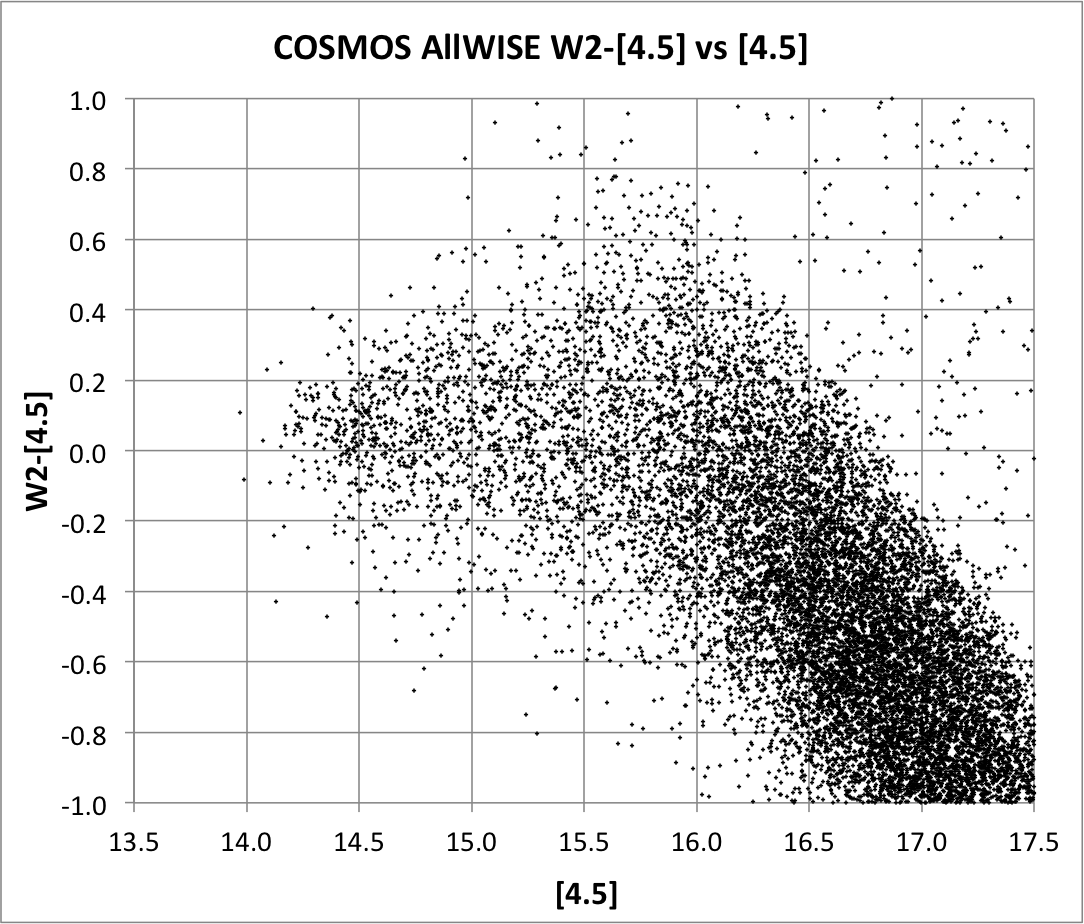 | 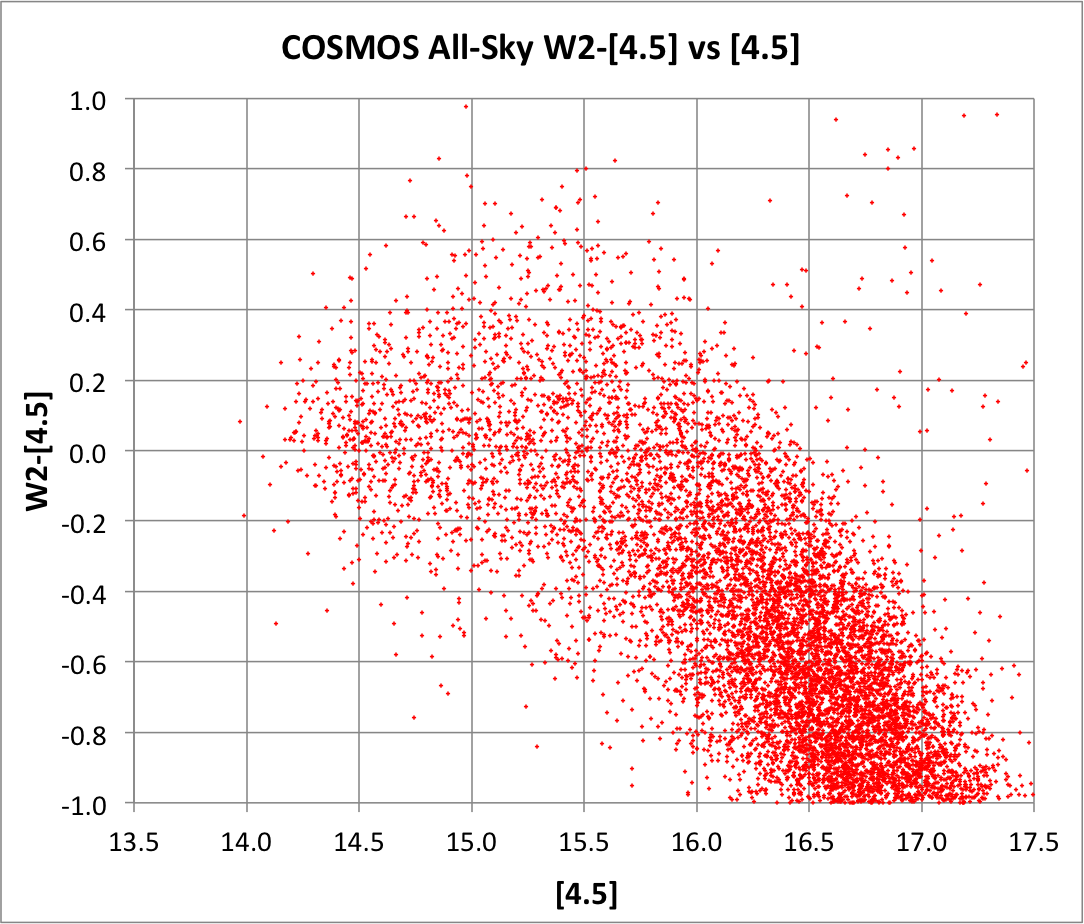 |
| Figure 6 –AllWISE W2 - [4.5] vs [4.5] for sources in the COSMOS field. | Figure 7 –All-Sky W2 - [4.5] vs [4.5] for sources in the COSMOS field. |
Figure 8 plots the running median of 400 sources in W2 - [4.5], which shows more clearly the trend for All-Sky W2 magnitudes (red) to become fainter than [4.5], and that this is largely removed in AllWISE (black). Figure 9 shows the running rms of 400 sources in W2-[4.5]-median(W2-[4.5]) vs. [4.5]. For this rms calculation 18 outlier points with W2 - [4.5] more than 3σ away from the local trend were excluded. The SNR 5 value for AllWISE W2 is at [4.5]=15.95, significantly fainter than the [4.5] = 15.47 mag value for All-Sky W2. Because of the flux underestimation bias, the AllWISE and All-Sky W2 SNR 5 magnitudes are 16.02 and 15.58, but as for W1 the correct flux density to associate with SNR 5 for W2 is given by that for AllWISE W2 -[4.5] = 0, i.e. W2 = 15.95, or 71 µJy, vs. the W2=15.47 (111 µJy) value found for the All-Sky release.
 | 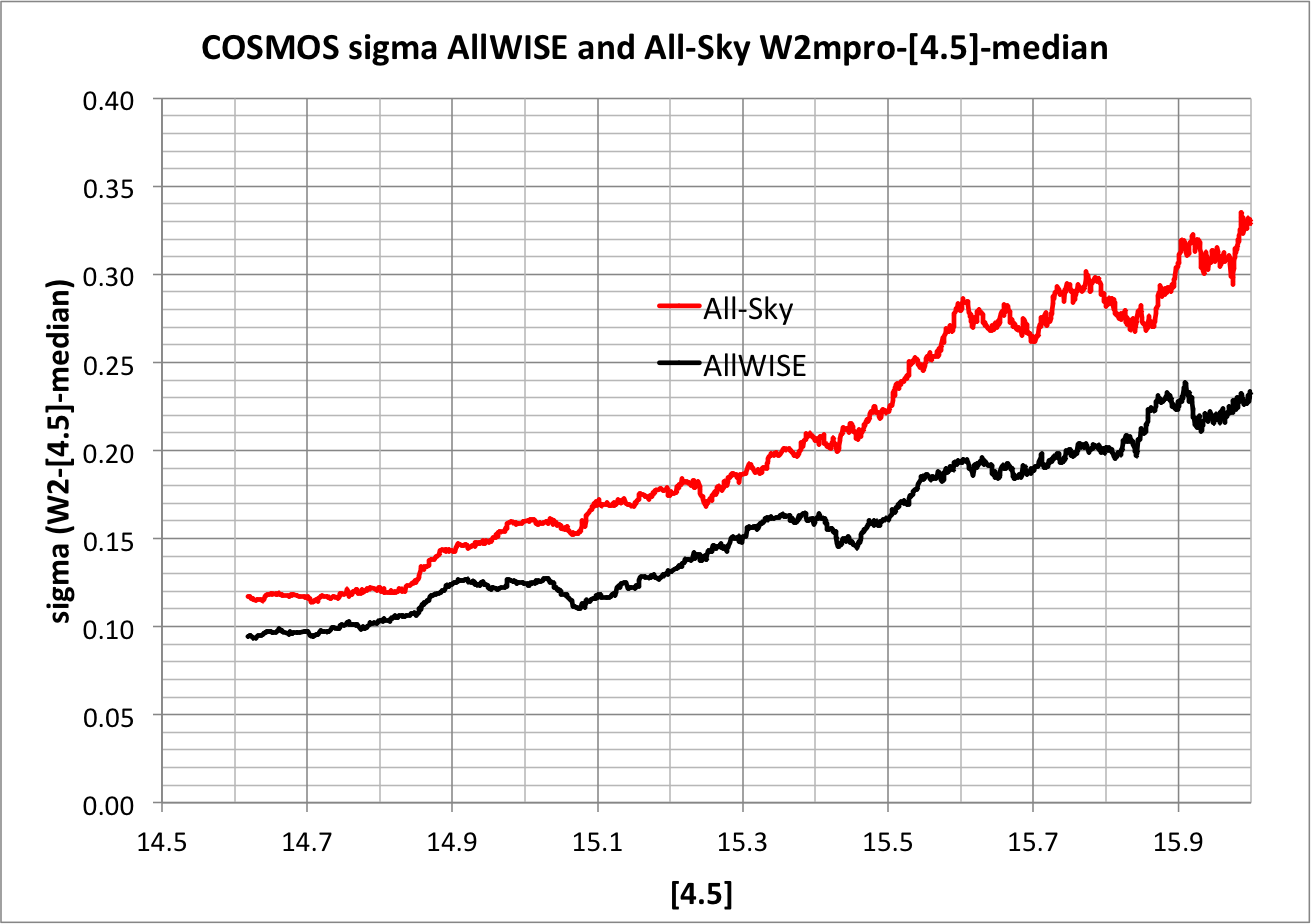 |
| Figure 8 – Median W2 - [4.5] photometry vs. [4.5] in the COSMOS field using AllWISE (black) and All-Sky (red) release data. | Figure 9 –rms of {W2 - [4.5] - median(W2-[4.5] from figure 9)} vs [4.5] in the COSMOS field using AllWISE (black) and All-Sky (red) release data. |
II.3.a.i.2. W3 and W4: 2MASS Stars
As noted above, 2MASS stars were used as an external check on W3 and W4 sensitivity. The WISE Catalog allows direct queries on cross-matched 2MASS sources. An all-sky search on the Source Catalog was carried out for sources with 11 coverages in W3 (w3m=11); a single 2MASS counterpart (n_2mass=1) within 3" (r_2mass<3); not extended or close to a 2MASS extended source (ext_flg = 0 and xscprox is null); well detected in 2MASS (k_m_2mass<12 and k_msig_2mass<0.03); and with colors appropriate for stars hotter than spectral class F7 (-0.05<j_m_2mass - k_m_2mass<0.3 and k_m_2mass - w2mpro<0.1 and -0.05<w1mpro - w2mpro<0.05).
In addition, sources were required to have no contamination or confusion in any band (cc_flags = "0000"); only a single blend component (nb = 1); SNR>10 in W1 and 2 and >2 in W3 (ph_qual at least AAC); good PSF fits especially in W3 (rchi2<1.5 and w3rchi2<1.2); to have a Galactic latitude of at least 20° and be at least 30° from the Galactic Center, and to avoid the Large and Small Magellanic Clouds. These constraints yielded a total of 25,156 sources.
Figure 10 shows a plot of W3 - W2 vs. W2 (with the running median overlaid) for these sources. The median offset is small (< 0.05 mag) and varies only slightly with magnitude. Figure 11 shows the rms in (W3 - W2 - median(W3-W2)) vs W2 after excluding 132 sources more than 3σ away from them median (these outliers likely include sources with excess emission in W3 from debris disks around hot stars). At coverage depth 11, SNR 5 is at W2=11.55, which with the -0.05 median W3 - W2 offset here corresponds to W3=11.50, or a flux density of 0.73 mJy. For the All-Sky release the corresponding value is 0.86 mJy.
 | 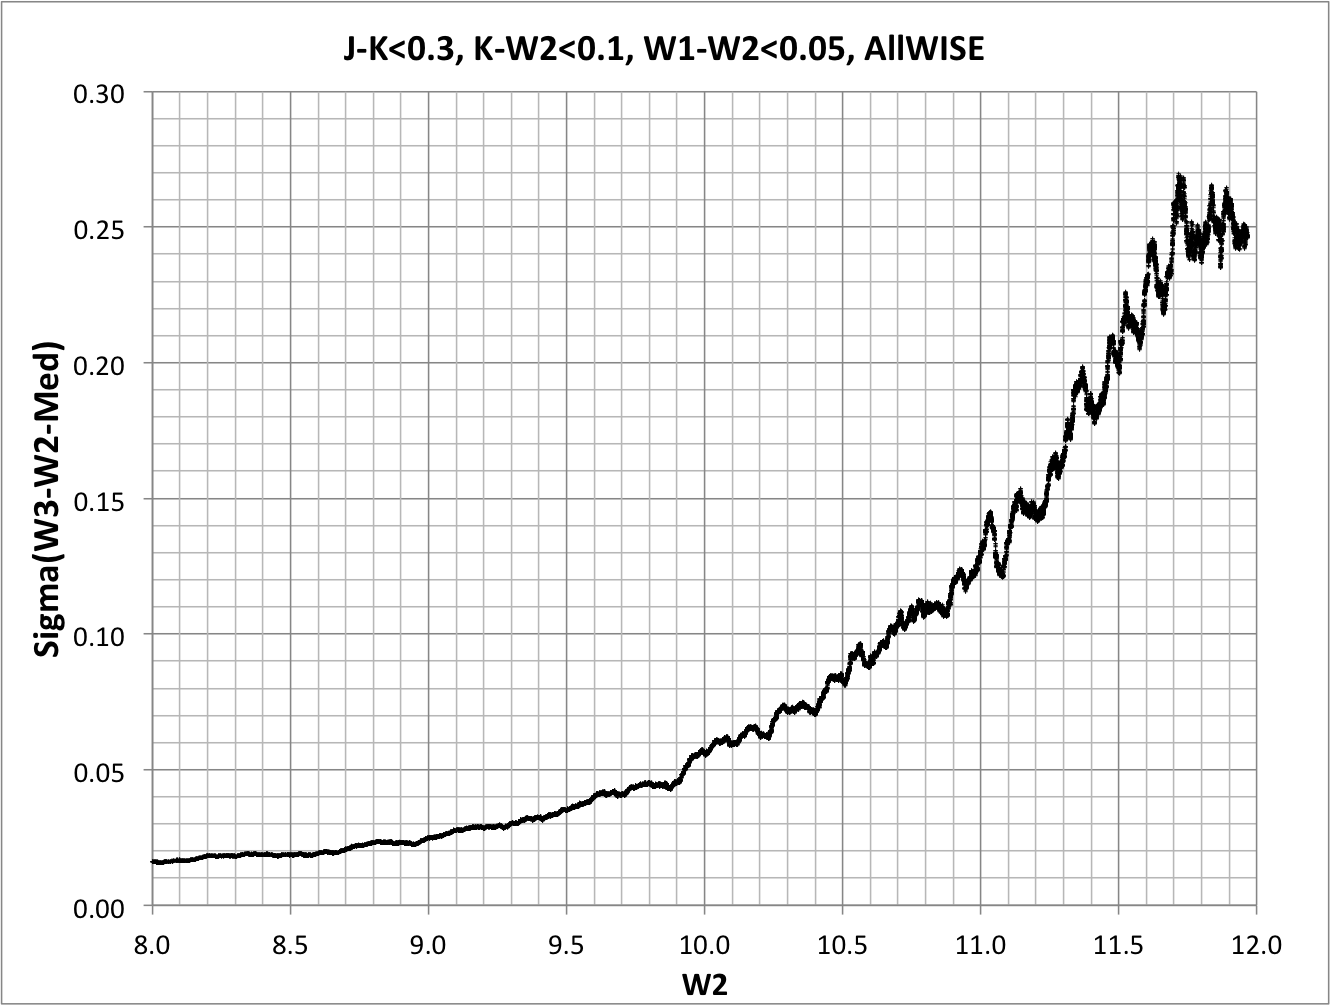 |
| Figure 10 – AllWISE W3 - W2 vs. W2 for W3 coverage depth 11 sources. | Figure 11 – rms (AllWISE W3 - W2 - median) vs. W2 for W3 coverage depth 11 sources. |
For W4 the criteria were similar: sources with 11 coverages in W4 (w4m=11); a single 2MASS counterpart (n_2mass=1) within 3" (r_2mass<3); not extended or close to a 2MASS extended source (ext_flg = 0); bright enough in 2MASS to have some chance of detection in W4 (k_m_2mass<9); and with colors appropriate for stars (k_m_2mass - w3mpro<0.2 and -0.2 < w3mpro - w2mpro < 0.1). Sources were also required to have no contamination or confusion in any band (cc_flags = "0000"); only a single blend component (nb = 1); good PSF fits (rchi2<1.5); to have a Galactic latitude of at least 20° and be at least 30° from the Galactic Center, and to avoid the Large and Small Magellanic Clouds. These constraints yielded a total of 29,985 sources.
Figure 12 shows a plot of W4 - W3 vs. W3 (with the running median overlaid) for these sources. The median offset is small (< 0.05 mag) and varies only slightly with magnitude. Figure 13 shows the rms in (W3 - W2 - median(W3-W2)) vs W2 after excluding 117 sources more than 3σ away from them median (these outliers likely include sources with excess emission in W4 from debris disks around hot stars). At coverage depth 11, SNR 5 is at W3=8.11 for AllWISE, which with the -0.06 median W4-W3 offset here corresponds to W4=8.05, or a flux density of 5.0 mJy. For the All-Sky release the corresponding value is 5.7 mJy.
 |  |
| Figure 12 – AllWISE W4-W3 vs. W3 for W3 coverage depth 11 sources. | Figure 13 – rms (AllWISE W4-W3 - median) vs. W3 for W3 coverage depth 11 sources. |
II.3.a.ii. Noise Model Estimates vs. Position
The Source Catalog includes the estimated error for every source based on the noise model. The fourth column of Table 1 shows the median W1, W2, W3, and W4 magnitudes for sources with SNR 5 (i.e. w1sigmpro, w2sigmpro, w3sigmpro, w4sigmpro) = 0.217 mag in the Image Atlas tile containing the COSMOS field which are not extended (ext_flg = 0 and xscprox is null) and have cc_flags = 0 in the relevant band. The values are somewhat lower than those found from the external checks, particularly for W1. The flux density for the noise model SNR 5 magnitude has not been corrected for any residual photometric bias, which would increase the flux density at the noise model SNR 5 W1 magnitude by approximately 10%. The noise model magnitudes probably do not fully include the impact of confusion. The external checks use photometry from higher resolution data and should therefore include the contribution of the WISE confusion noise relative to Spitzer in W1 and W2.
The Source Catalog includes sources with SNR >5 based on the noise model. To provide users with a sense of how the Source Catalog sensitivity varies over the sky, the same procedure described for the COSMOS tile was carried for sources with SNR 5, 7 and 10 (i.e. w1sigmpro etc. = 0.217, 0.155, and 0.108)) in every tile which had enough sources satisfying the constraints to provide a meaningful estimate in the appropriate WISE band. The results are listed in Table 2 and shown graphically for SNR 5 in Figure 1. The noise model WISE magnitudes for which 95% of tiles with |b| > 20°, more than 30° from the Galactic center, and avoiding the Large and Small Magellanic clouds, have SNR 5 or higher is listed in Table 1.
Last update: 19 November 2013