


Reliability is a metric used to indicate the fraction of sources listed in the All-Sky Release Source Catalog that are real astrophysical sources. In plain English:
"Reliability refers to whether a source listed in the catalog corresponds to an actual astrophysical source at that position at the time of the WISE observation(s). Reliability does not in itself ask what are the qualities of the positional and/or flux estimates listed in the catalog, but just on the existence."
There are two requirements that pertain to the reliability of the Source Catalog:
Our focus is on the phrase "at least one band". We do not distinguish between "one band" and "many bands". While we will categorize reliability by plotting sources with SNR > 20 in each of the four wavelength bands, there is a subtle bias for W3 and W4. Stars and nearby galaxies (which are the vast majority of the catalog) have relatively blue colors (nearly Rayleigh-Jeans), so any that are detected in W3 will certainly have been also detected in W1 and W2. Being detected in more than one band significantly increases the likelihood that they are real. However, very red sources that are strongly detected only in W3 and/or W4 (YSOs, ultra-luminous galaxies) do not have that same advantage. Therefore, it must be emphasized that in considering W3 (for example), that this analysis does not consider whether 99.9% of SNR > 20, W3-only sources are real, only whether 99.9% of all sources with the w3snr column > 20 are real.
The other phrase to note is "requirement shall not apply". A source that has any artifact noted is not included in this analysis (i.e. cc_flags must be "0000"). While the vast majority (well over 99%) of sources that have a lower-case letter in their cc_flags column (e.g. "h000") are reliable, by the language of the requirement, they are not considered here.
We use three methods to judge the reliability of the Catalog: a WISE-internal comparison between shallow and deep coadds of the same fields, a WISE-to-2MASS comparison, and a WISE-to-Spitzer comparison. For all three tests, the reliability is found to be at least 99.9% for objects with SNR > 20, though some caveats will be discussed, particulary for the internal comparison. In fact, 99.9% reliability is achieved at approximately SNR = 16 in the best external comparisons (2MASS deep calibration fields and Spitzer fields). The rest of this section describes each of the three tests in more detail.
Note 1: The unusual vertical scale in the following plots is a truncated logarithmic scale chosen to emphasize quantities between 99% and 100%, while still allowing insight into quantities closer to 0%. It is defined as y = log (1‐ f)-2 where f is the reliability fraction and values over 99.99% are labeled to be exactly 100%. Also, detecting zero out of zero sources can be said to be 100% reliable, so these bins have been set to 100% to be less visually distracting.
Note 2: "Differential Reliability" is defined to mean the number of sources within a particular SNR or magnitude bin that are found to have a counterpart in the truth table; e.g. the number of sources with 19 < SNR < 21, 21 < SNR < 23, etc. "Cumulative Reliability" sums all the bins that contain brighter sources; e.g. SNR > 19, SNR > 21, etc. It is the cumulative reliability that we use to verify the requirement.
Note 3: Please click on any figure in this section to view a larger version.
The first method of checking reliability compares subsets of WISE data covering the same regions of sky, but with varying depths. Seven Atlas Tiles in close proximity to the Ecliptic poles were chosen; there are more than 150 frames of coverage in these areas, whereas the median depth-of-coverage for the entire All-Sky Release area is 10–15 frames. Because of their deeper sensitivity, we use the source lists produced from the full-depth Multiframe pipeline processing for these tiles as the truth tables. Special Multiframe pipeline processing was then performed using subsets of these scans and framesets. Ten coadds and extracted source lists were generated using every 10th frame: e.g. data set 0891m637_nm10_00 used frames 1, 11, 21, ...; set 0891m637nm10_01 used frames 2, 12, 22, ..., up to 0891m637_nm10_09.
All sources (40,000 to 50,000 for each tile) in the nm10_xx sets were then checked for existence against the truth table. In this way we define the internal reliability to be (the number of nm10_xx sources in a given band with matches in the truth table) / (the total number of nm10_xx sources in that band).
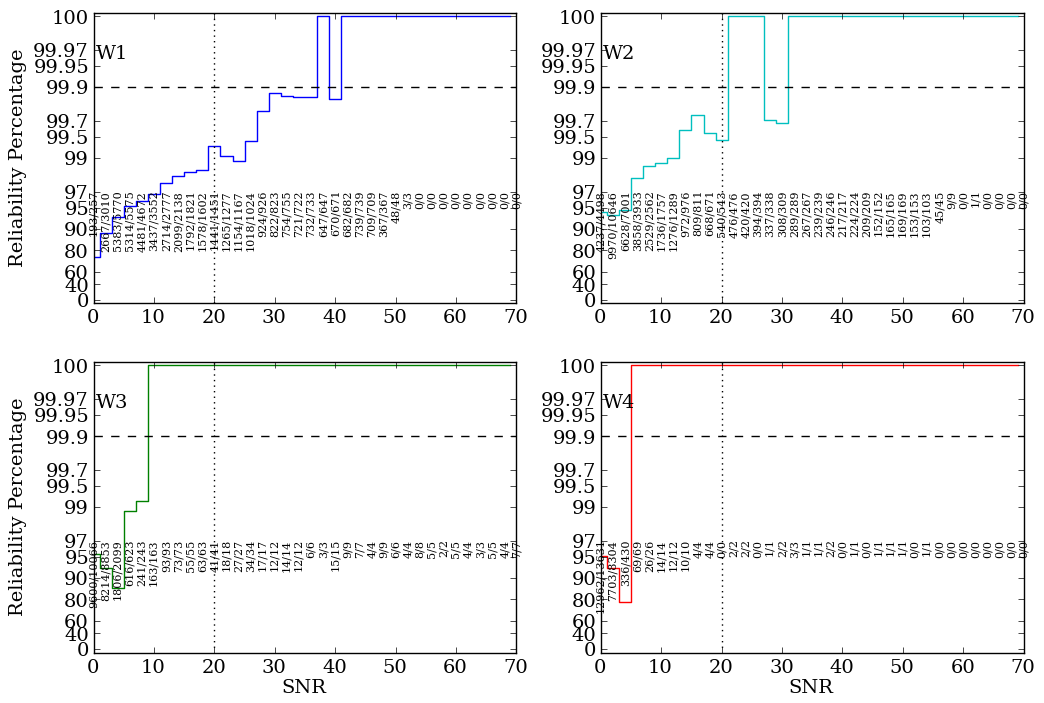
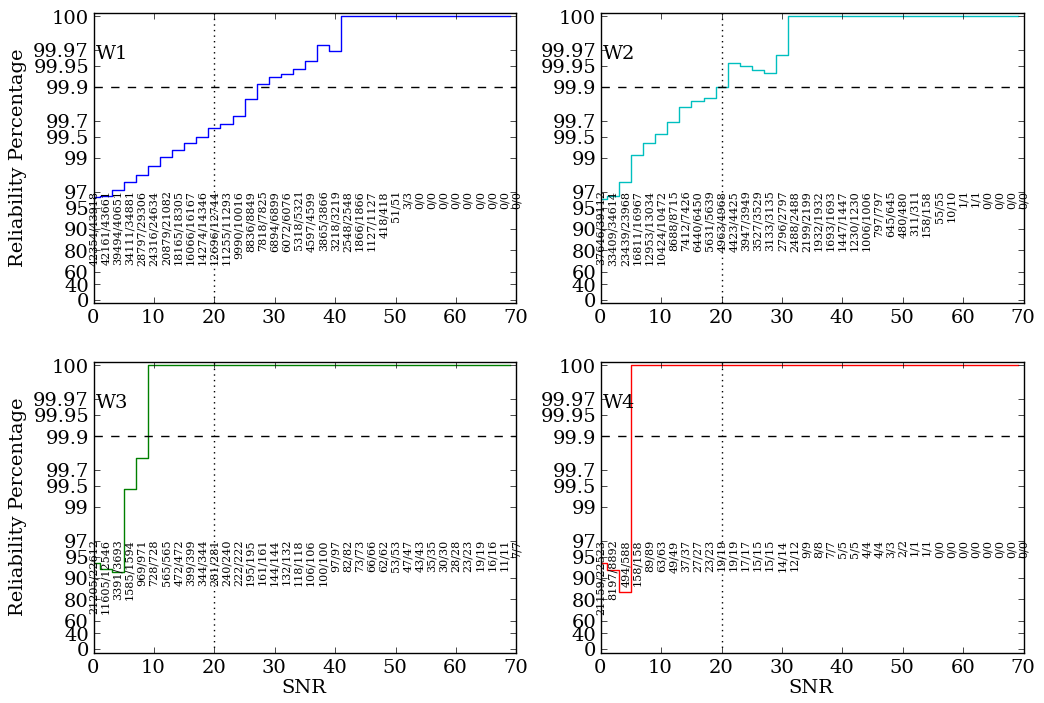
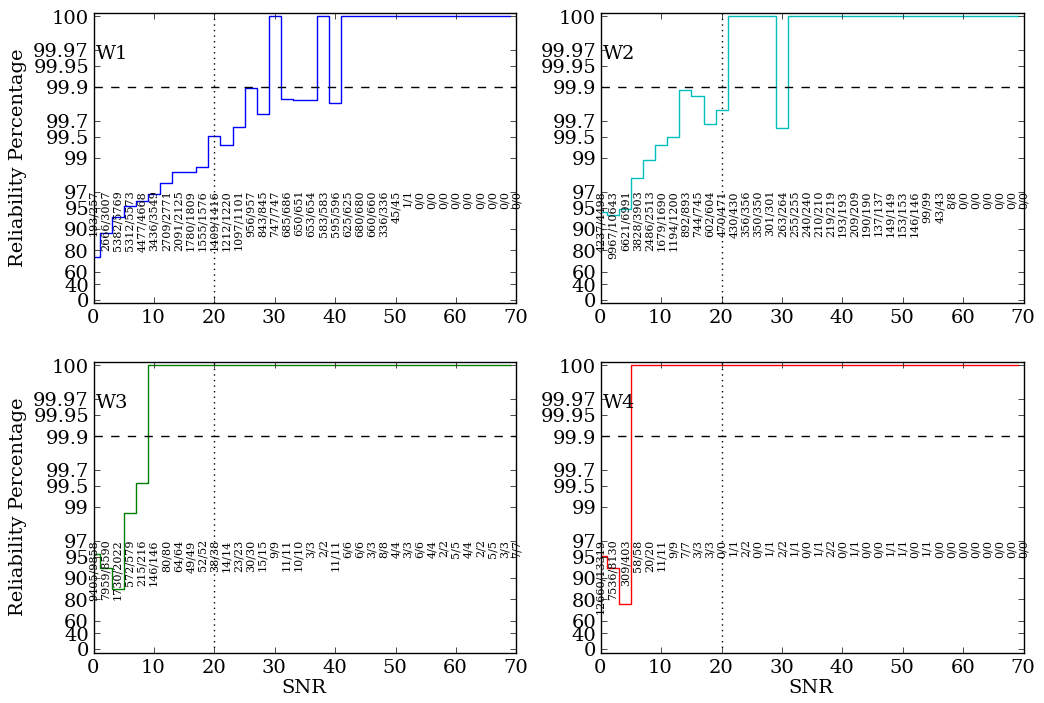
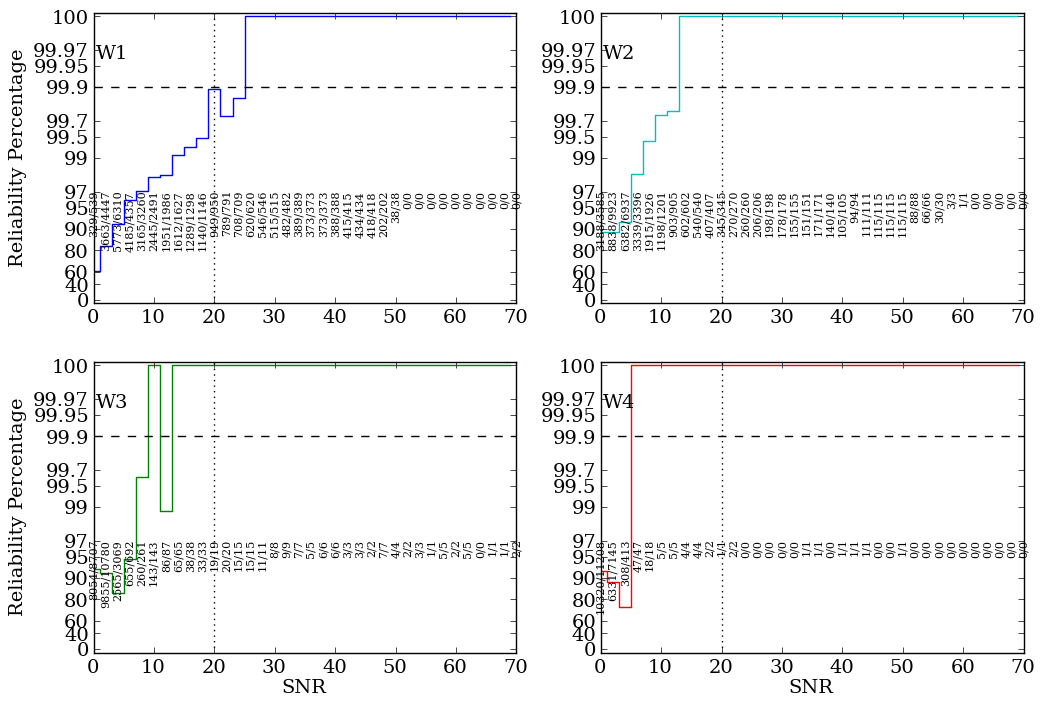
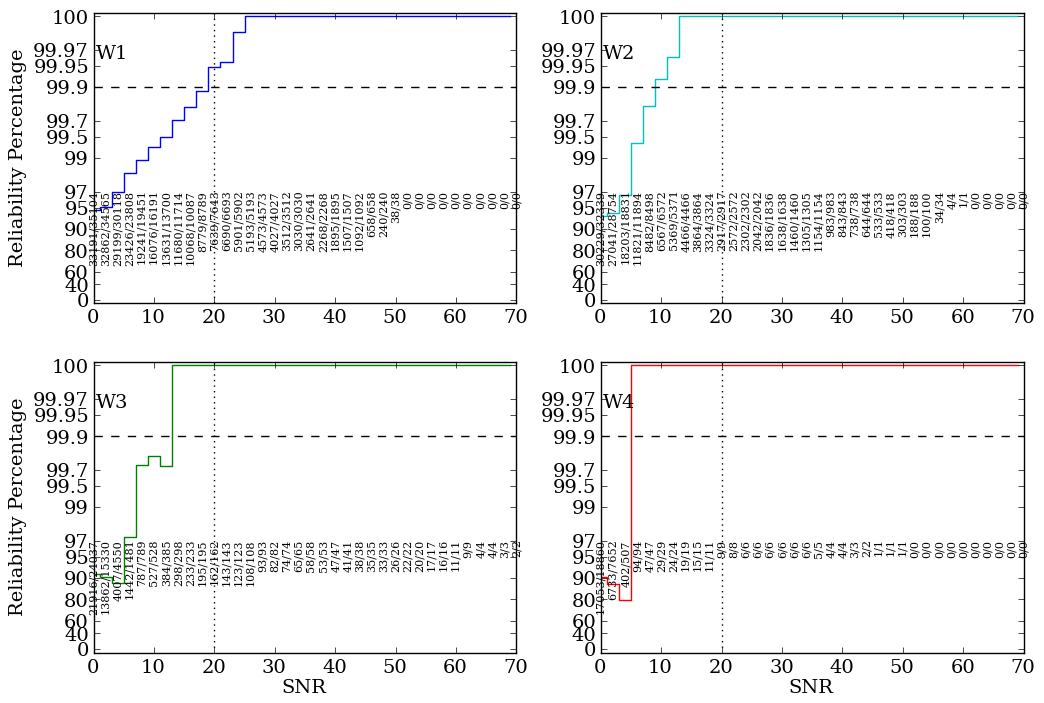
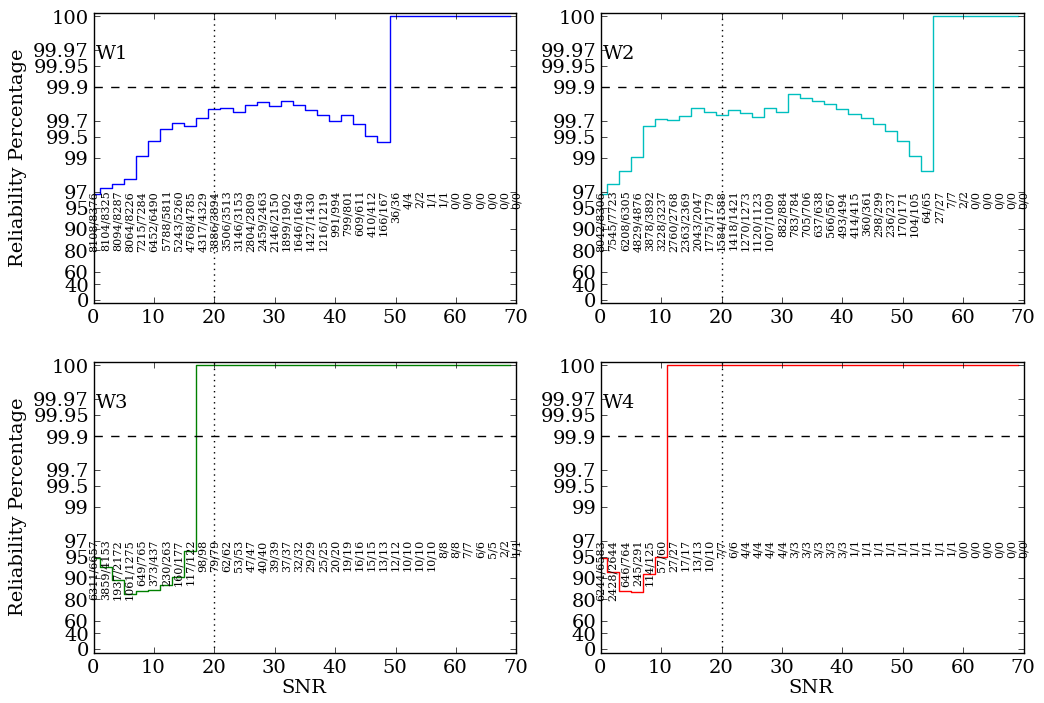
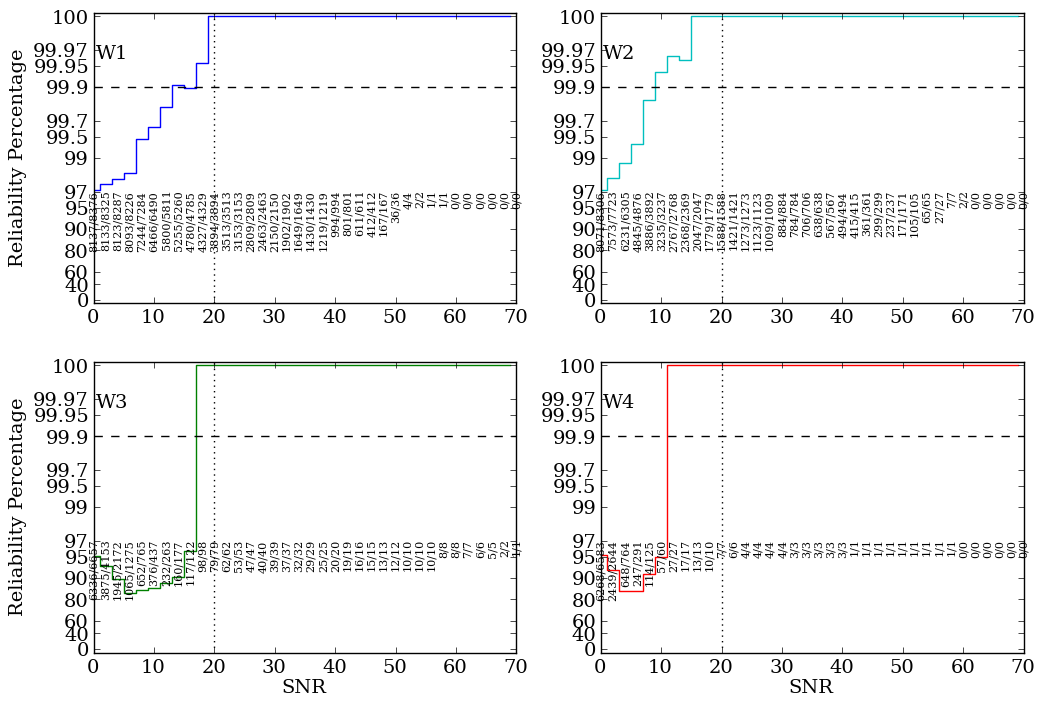
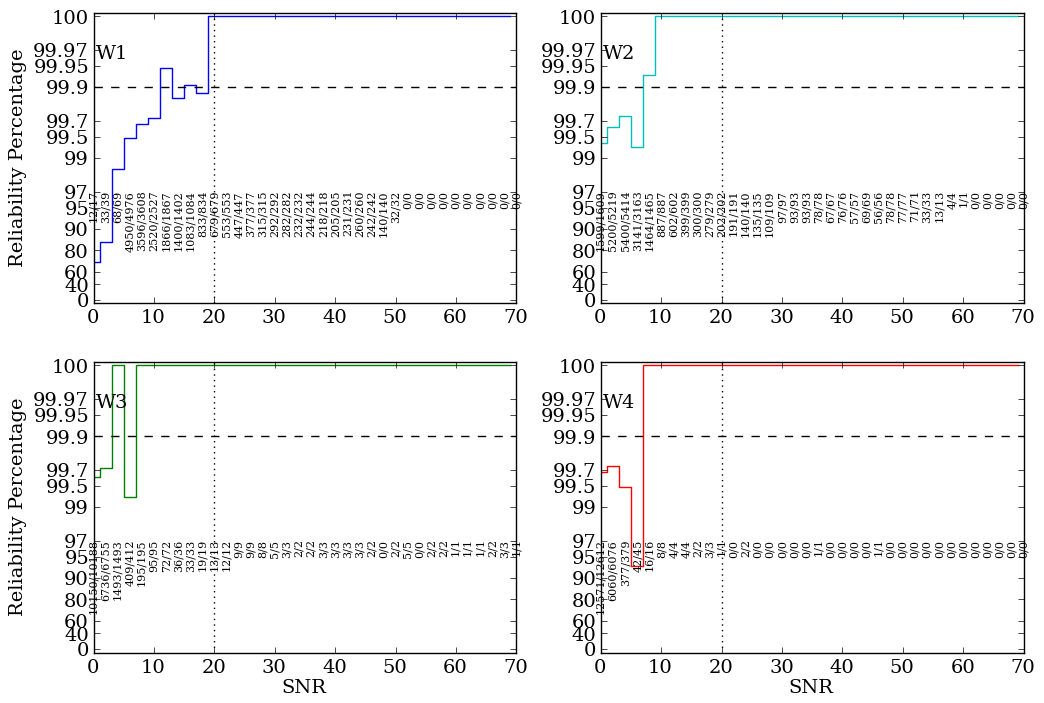
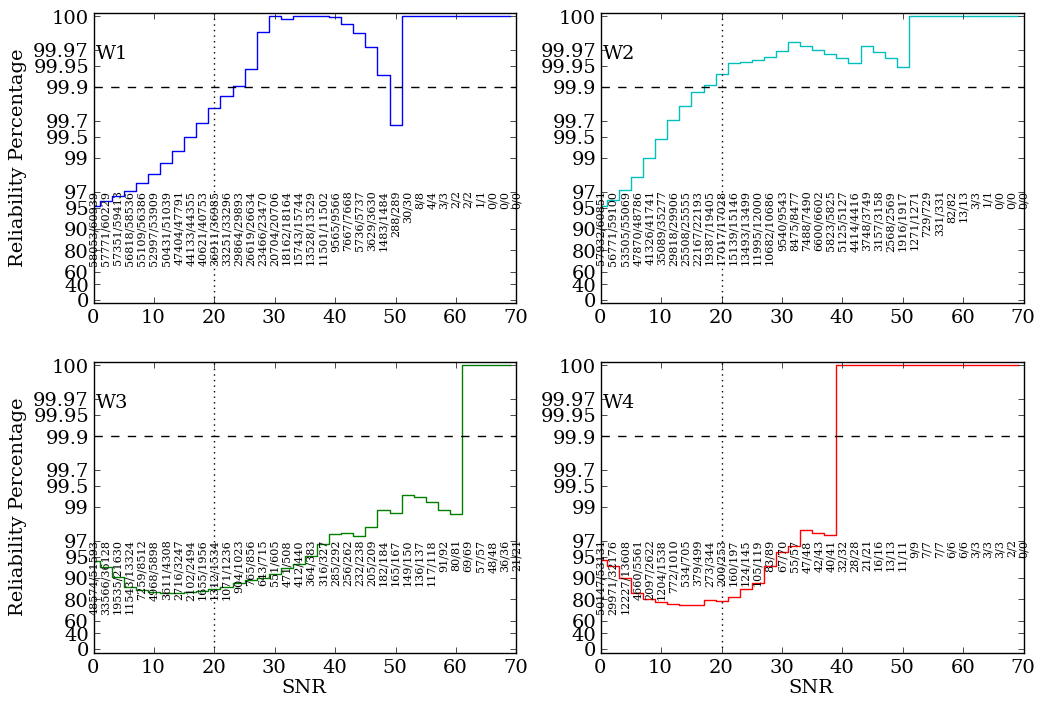
The results of this comparison are demonstrated in the following figures from one variation of two of the tiles, one from each pole; these results are typical for all nm10_xx slices in all positions. Figure 1 presents differential and cumulative reliability derived from the 0891m637 field, while Figure 2 shows the equivalent data from the 2708p636 field. (More variations for all 7 test tiles are given in the supplemental figures.)
| Differential Reliability | Cumulative Reliability |
 |
 |
| Figure 1 - Example Data for Field 0891m637_nm10_08 | |
| Differential Reliability | Cumulative Reliability |
 |
 |
| Figure 2 - Example Data for Field 2708p636_nm10_08 | |
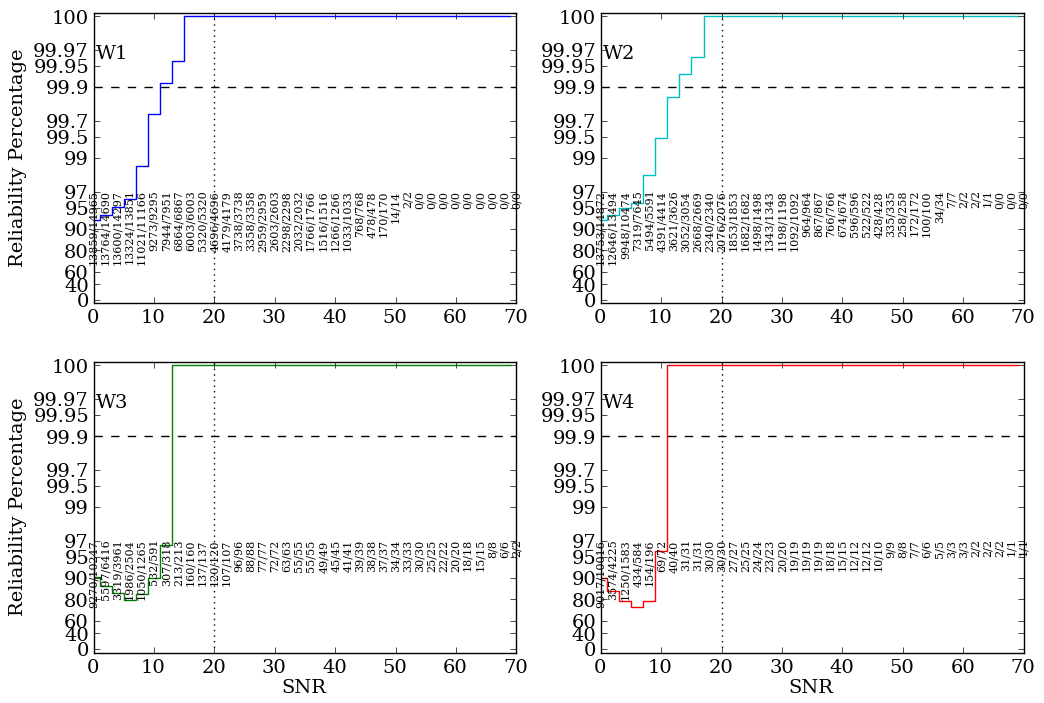
The trends in these plots are generally good with all SNR > 20 sources matched at W3 and W4 except for 2 at W3 in 2708p636_08. However, at W2 the the cumulative reliability barely meets (or even misses) the 99.9% requirement, while W1 misses by a fair margin.
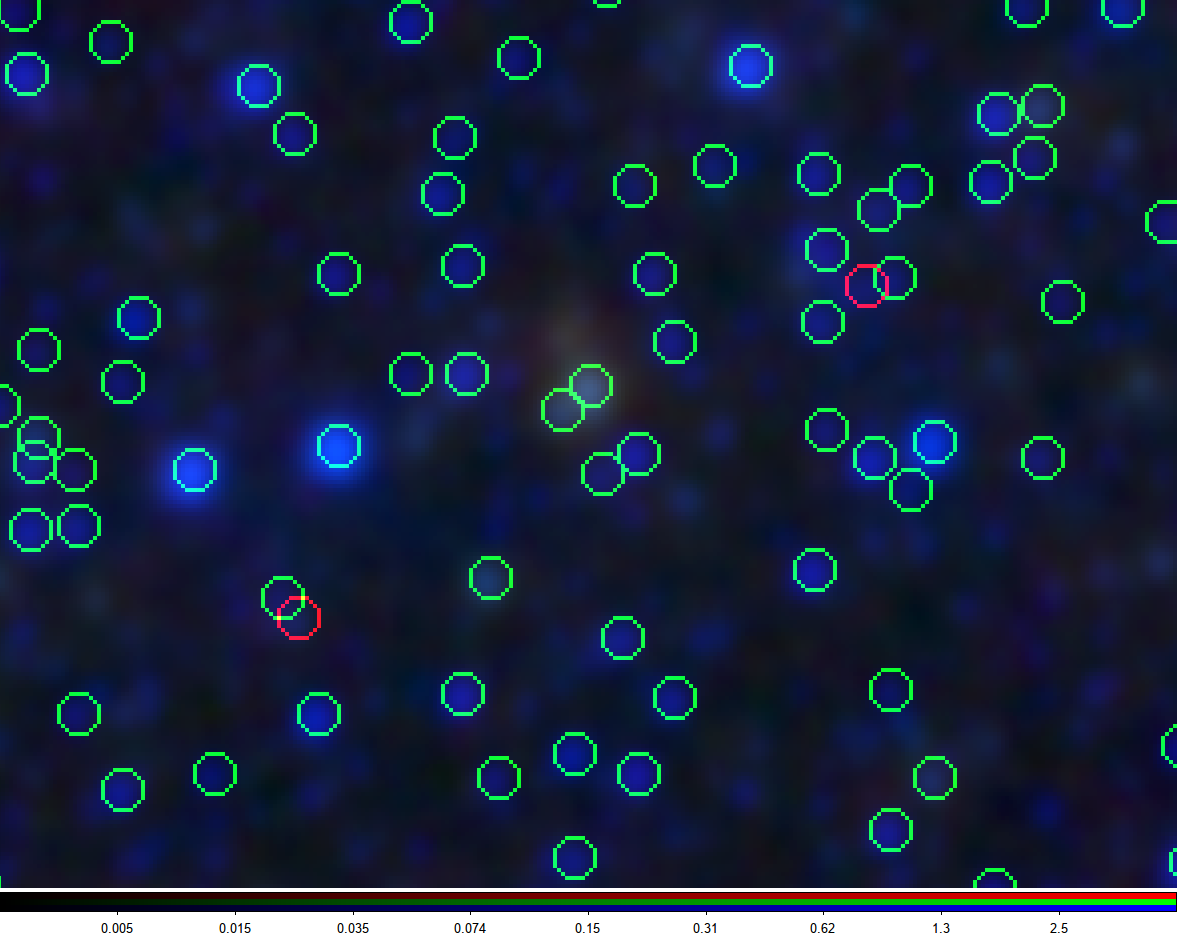
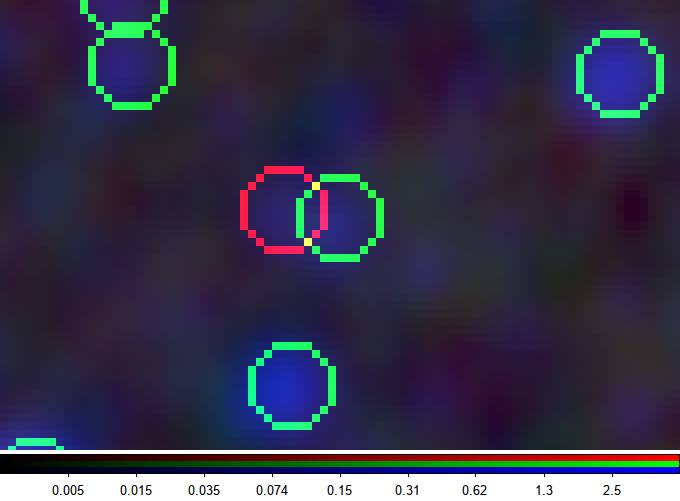
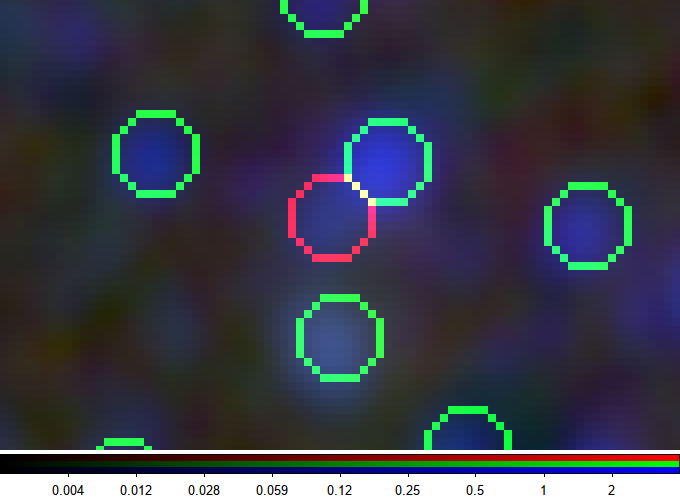
The nature of the unmatched sources can be determined by examination of the images. Figure 3 shows two portions of the 0891m637 field with all the matched sources marked with a green circle, while unmatched sources are marked with red circles. Apparent sources with no symbols are excluded either because they are not detected above 20σ in any band, or because they are associated with an identified artifact (cc_flags != 0000). Blue in this case is mapped to W1, green is W3, and red is W4.
 |
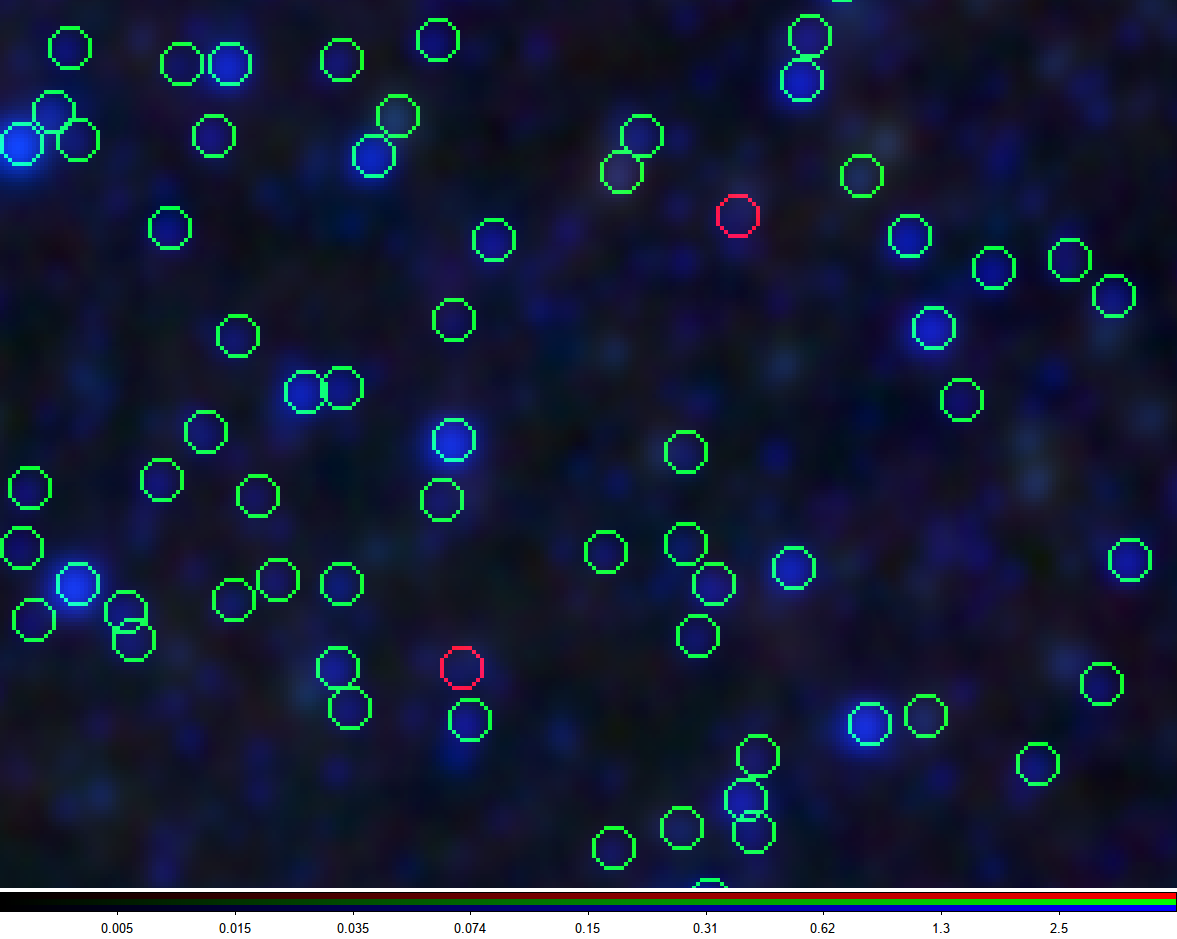 |
| Figure 3 - Two regions from an image of the 0891m637 field with matched (green) and unmatched (red) sources marked in circles. The image data comes from the full atlas data set (~ 150 coverages), while the markers were generated from one of the decimated tiles (nm10_03). | |
The majority of the unmatched sources are found in very confused blends, small clumps of sources that sometimes resemble nebulosity. Some of these sources trigger the deblending flags, but many do not. Because these test regions are near the ecliptic poles, the position angle of the PSF varies dramatically from one scan to the next (much more so than for a typical tile elsewhere on the sky). The shallower data may emphasize small irregularities in the PSF that later get smoothed out in the deeper sets. No attempt was made to filter out such blends in the statistics in Figures 1 and 2.
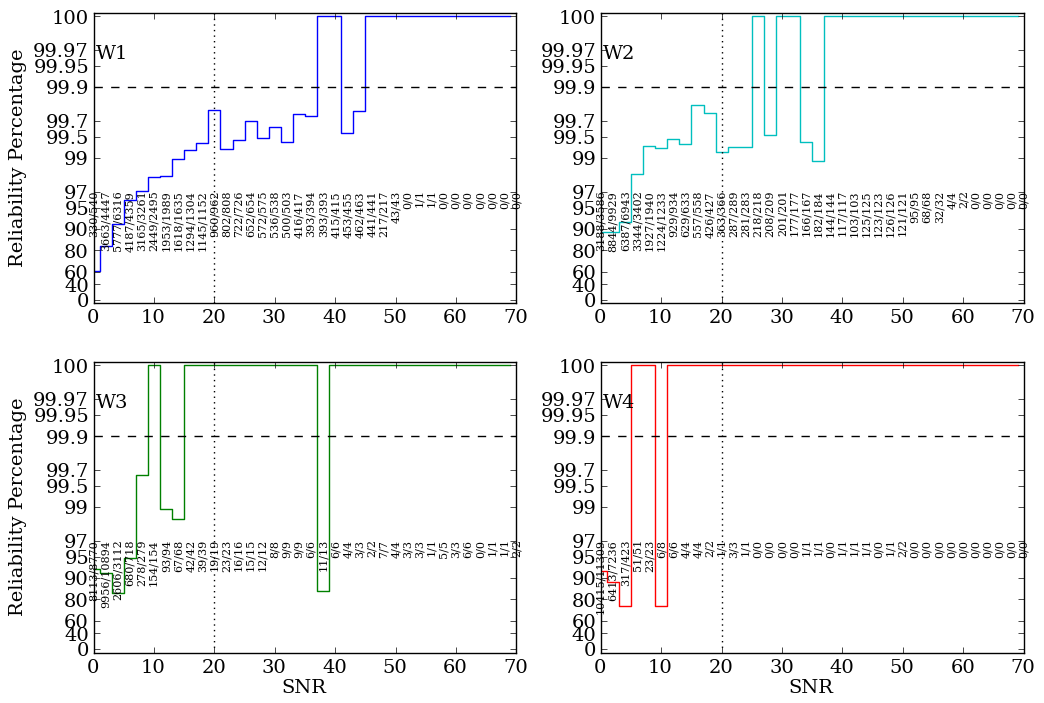
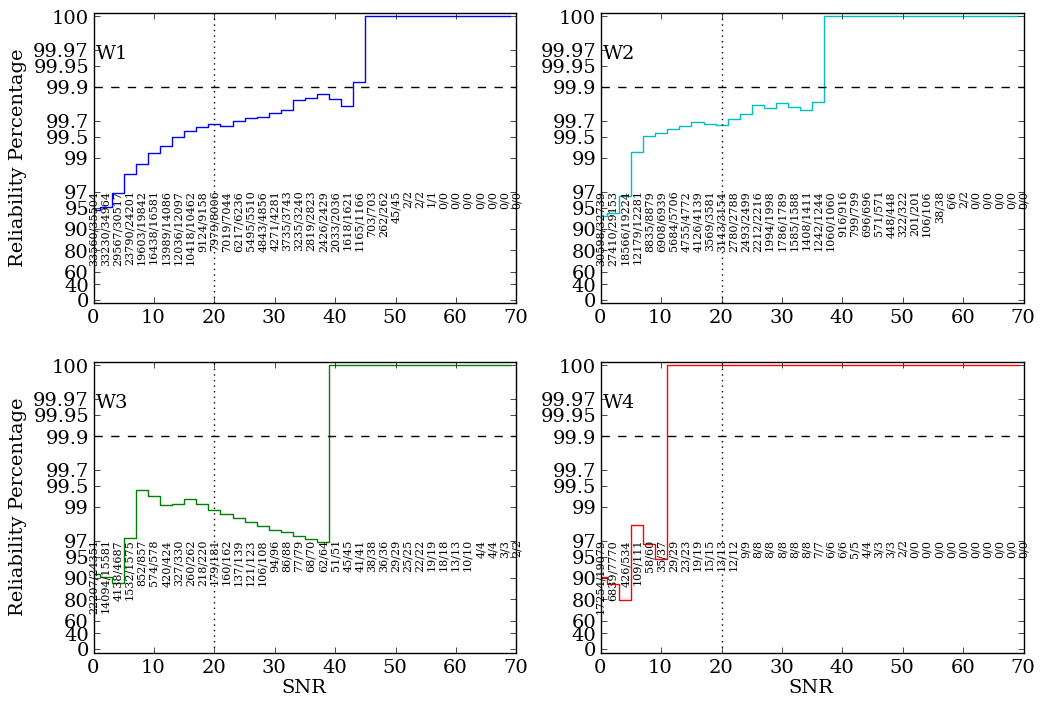
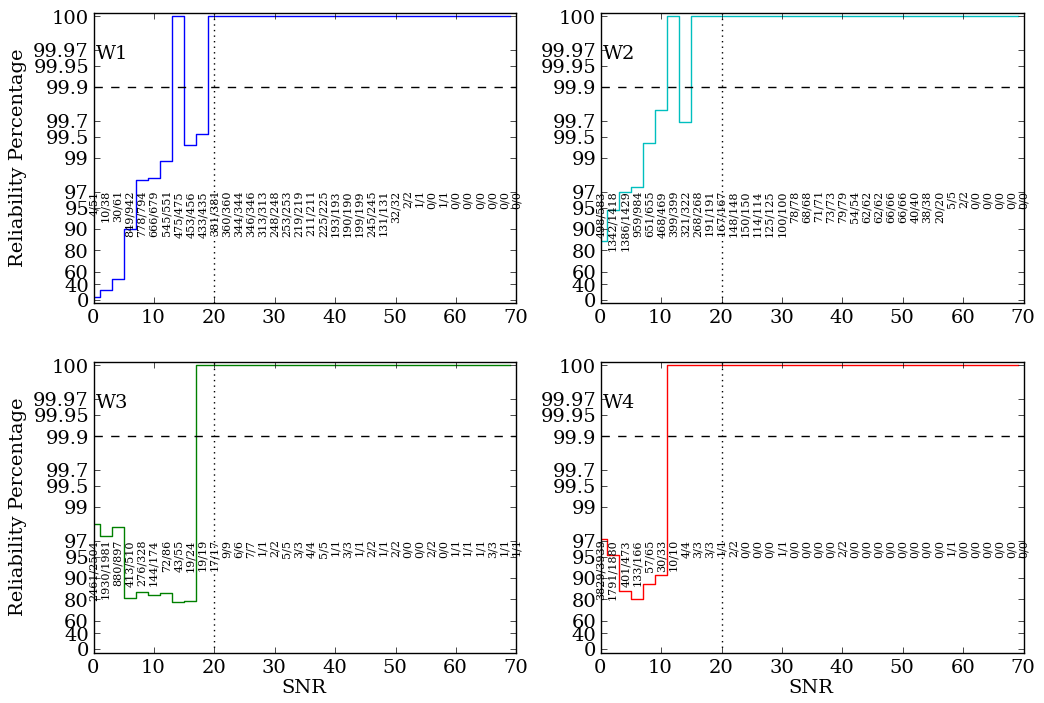
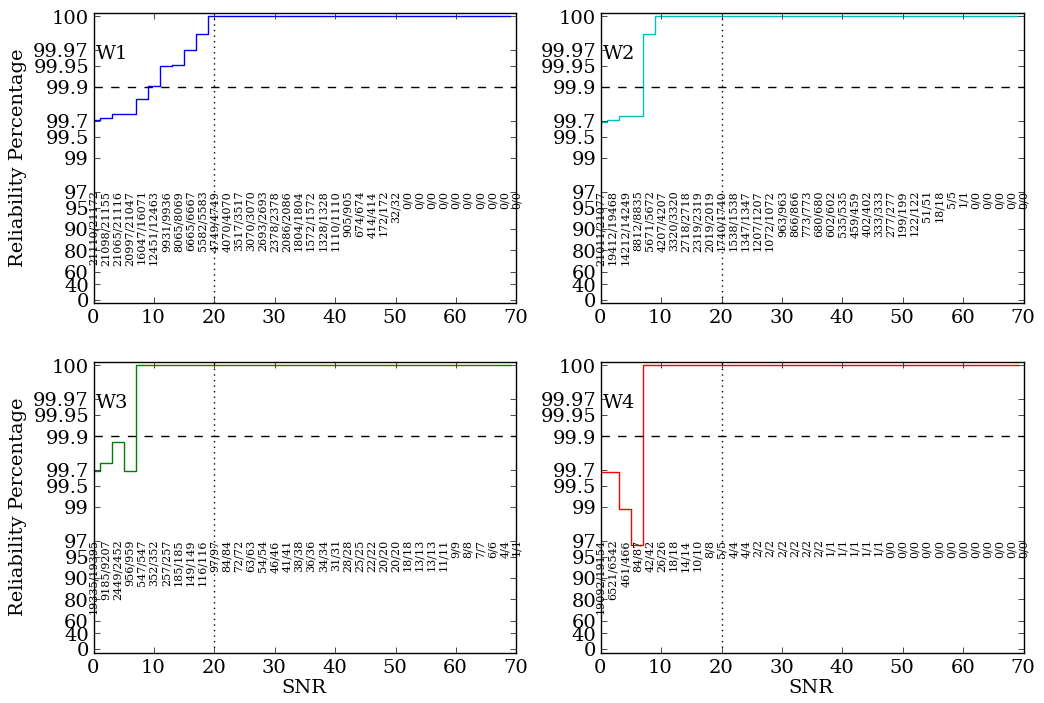
Therefore, to test the impact of these blends on reliability, Figures 4 and 5 replot the data, this time with the flagged blended sources and sources with poor χ2 fits (rchi2 > 1.5) filtered from the data. The reliability is greatly improved, with the W2, W3, and W4 bands meeting the 99.9% requirement, while W1 meets the requirement in the 2708 field, but just misses in the 0891 field. Note that the two missing bright W3 sources have been filtered as excessively blended.
| Differential Reliability | Cumulative Reliability |
 |
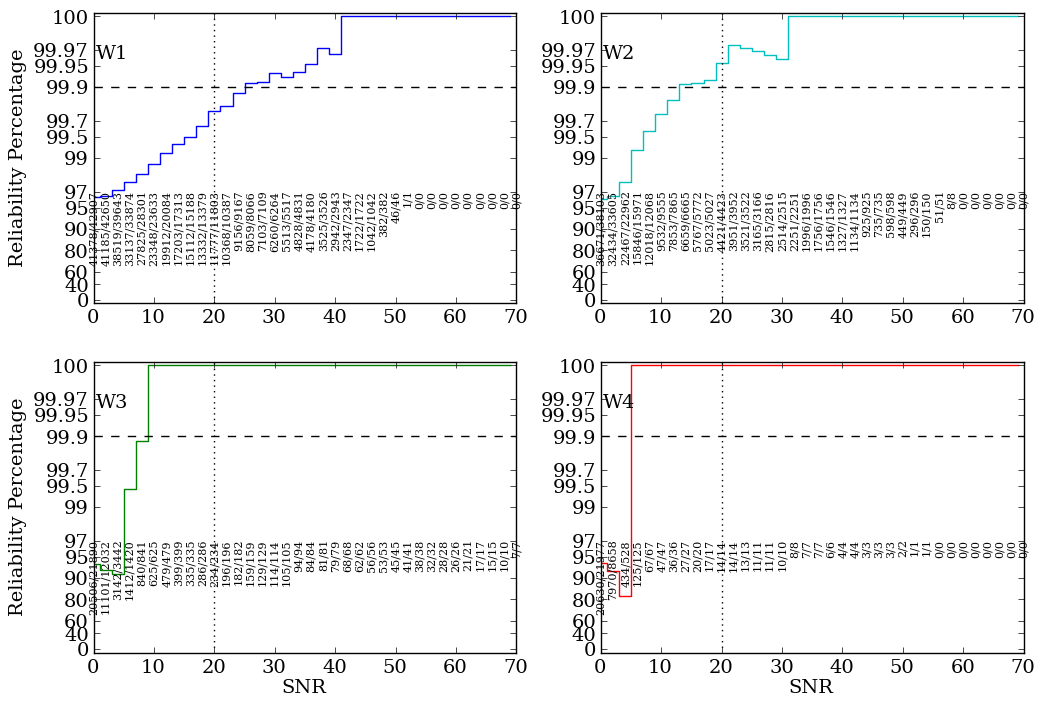 |
| Figure 4 - Example Data for Field 0891m637_nm10_08, filtered for blends | |
| Differential Reliability | Cumulative Reliability |
 |
 |
| Figure 5 - Example Data for Field 2708p636_nm10_08, filtered for blends | |
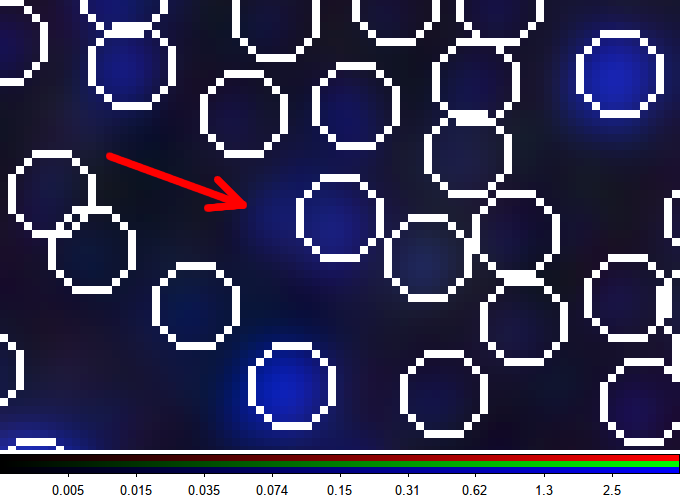
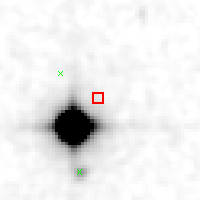
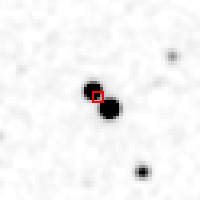
Because the requirement is still just barely met at W1 in a few of the tile variation and misses by just a bit in others, a visual inspection was again performed to track down the few unmatched sources. Figure 6 shows two examples. In Figure 6a, the unmatched source found in the shallow depth data appears as a blended source close to a slightly brighter source. In the truth table (full catalog coadd), however, it is not marked as a source at all, and thus there was no opportunity for a match to be found. In Figure 6b, the unmatched source is a 15th mag extension off a 12th mag star, with a 14th mag galaxy to the south, and a 14th mag star to the east. The truth table finds the same two stars and the galaxy, with brightnesses that differ by only a few hundredths of a mag and fits that have similar χ2, but instead of the extension, the truth table feels that a 16th mag star between the 12th and 14th mag stars is a better overall fit to the region. Again, there was no opportunity to match the test region source with the truth table.
 |
 |
 |
 |
| Figure 6a - An unmatched source in 0891m637_ nm10_03 (left, in red) vs. all catalog sources (right). The shallow field marked it as a 20σ source, while the full coadd did not find a source at all (unmatched position indicated by red arrow). | Figure 6b - A second unmatched source in the same field. Here the full coadd find not find a source in the same position (red arrow), but did mark a fainter source nearby (green arrow). | ||
The ultimate limit to this internal comparison technique is therefore the quality of the truth table. Since these tiles are nearly confusion limited in W1, the truth tables will not substantially better than the test regions, thus if both the test regions and truth tables are inherently 99.9% reliable, we might expect a measured reliability to be 99.8%, which is indeed typical of all the tiles in W1. In the other bands, the confusion is lessened, and thus a measured reliability of 99.9% is achieved.
Overall, then, the internal reliability test, when performed using the full depth coadds as truth tables, shows that the the 99.9% reliability requirement for SNR ≥ 20 sources is met for W2, W3, and W4, and produces an expected value for W1. However, blending and confusion noise do impact the ability to fully recover all the SNR ≥ 20 sources.
Since the properties of the near-infrared 2MASS Point Source Catalog are well understood, it provides a robust external source with which to judge the reliability of the WISE Catalog. We do this by selecting "stars" from the WISE Catalog which are sufficiently close to being blackbodies that their expected near-infrared flux puts them within the detection limits of 2MASS.
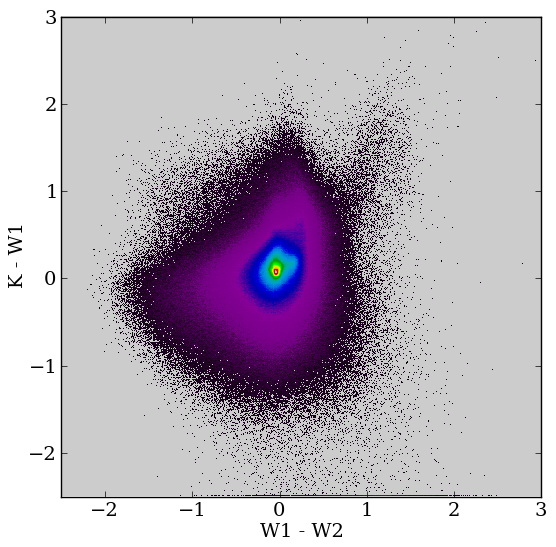
Color-color diagrams from WISE (Figure 7) show that the majority of Main Sequence stars have a color near 0.0 between the W1 and W2 bands. The 2MASS data show similar characteristics except for the J–H color where the blackbodies of cooler stars start to turn over; this leads to a wider spread of colors, but that is unimportant for this simple test. We therefore define a "star" in two slightly different ways to see how these objects match up with 2MASS: 1) any object that is bluer than W1–W2 < 0.2 that will be referred to as "blue color" objects (Figure 7b), and 2) a stricter selection where the range of colors is limited to |W1–W2| < 0.1 known as "zero-color" objects (Figure 7c).
 |
 |
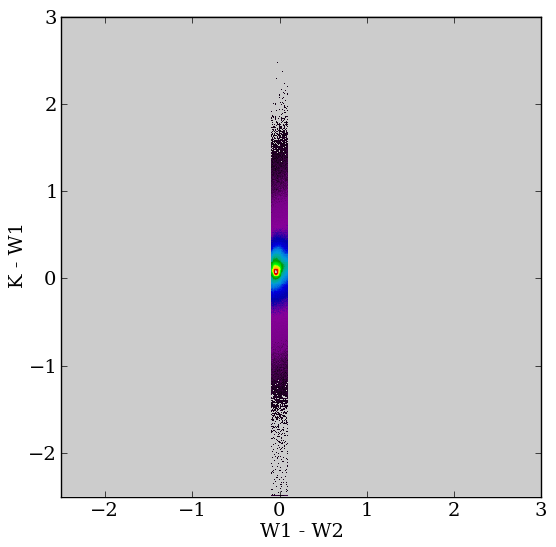 |
| Figure 7a - K–W1 vs W1–W2 color-color diagram for all sources found in 11 of the 12 test regions (Region 6 is excluded). The vast majority cluster around zero colors. | Figure 7b - The "blue" definition of stars are those selected to have W1–W2 colors < 0.2. | Figure 7c - The "zero-color" definition of stars are those with |W1–W2| < 0.1. |
Our assumption, then, is that a WISE "star" that has a W1 magnitude of 13.0 will also have a K magnitude of 13.0, and thus it should be present in the 2MASS catalog. Comparing the catalogs, the 20σ sensitivity of WISE is found to be approximately W1=15.5 and W2=14.1 in the shallower fields which is quite near the 2MASS 99% completeness range of J=15.8, H=15.1, and K=14.3. Thus, we would expect an excellent correlation between the catalogs to a limit of W1=14 to 15 for star-like sources.
To perform this test, we have selected sources from 11 of the 12 catalog test regions that have no identified artifacts associated with them (cc_flags = "0000"). (Test Region 6 was excluded since it includes the Galactic Plane and is highly confused. Note that Test Region 8, which is also near the Plane, b ~ +5°, and has a tremendous amount of nebulosity, was included in these statistics and has properties similar to the other test regions. Region 6 is simply an extreme case.) There are approximately 11 million identified WISE sources within these regions meeting this artifact-free criterion. Of these uncontaminated sources, 4 million are found to be stars using the blue color threshold; while a subset of 2.5 millions sources are stars using the zero-color definition. A 2MASS source was considered to be a match to the WISE source if the difference in coordinates was less than 3.0". (Recall that a raw single-frame pixel in the WISE W1, W2 and W3 data is 2.75". Also, please note that the 2MASS-related columns within the WISE catalog were generated by searching for counterparts within 3", so this is a "feature" of the catalog itself.)
The results are presented in Figures 8 and 9. Figure 8 shows the number of sources found per each 0.25 magnitude bin in W1. Several things stand out: for the blue color threshold, about 2/3 of all objects in any given brightness bin are stars (the constant ratio between the solid blue and green curves). The number of 2MASS matches for these stars starts to drop at about W1 ~ 14.75, as predicted earlier. Curiously, for the zero-color threshold stars, the fraction of objects that are rejected as non-stars in the magnitude range from 6 to 9 (nearly 50%) is far greater than those in the 10 to 13 magnitude range (< 10%). This suggests that either the brighter stars are redder on average, or it could be an artifact of the difficulty in measuring the W1 magnitude for these bright sources.
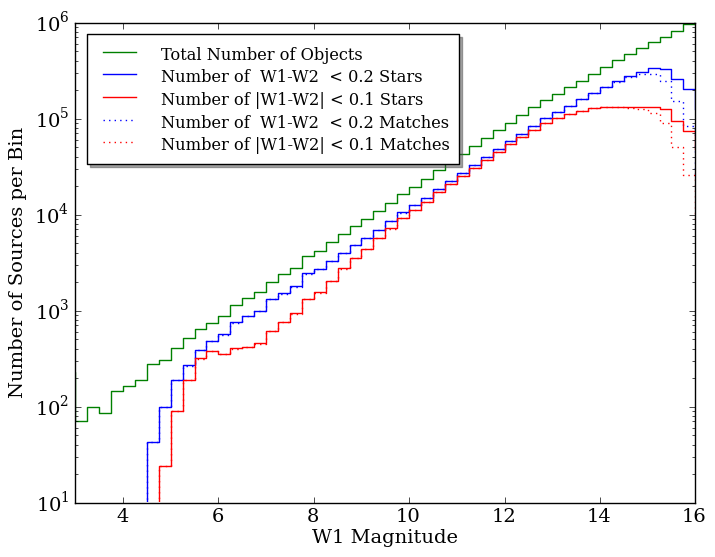 |
| Figure 8 - Number of source found in each 0.25 magnitude bin. Green is the total number of objects per magnitude bin; blue is the number of objects that fit the looser definition of a star, while red is the number that meet the stricter definition. |
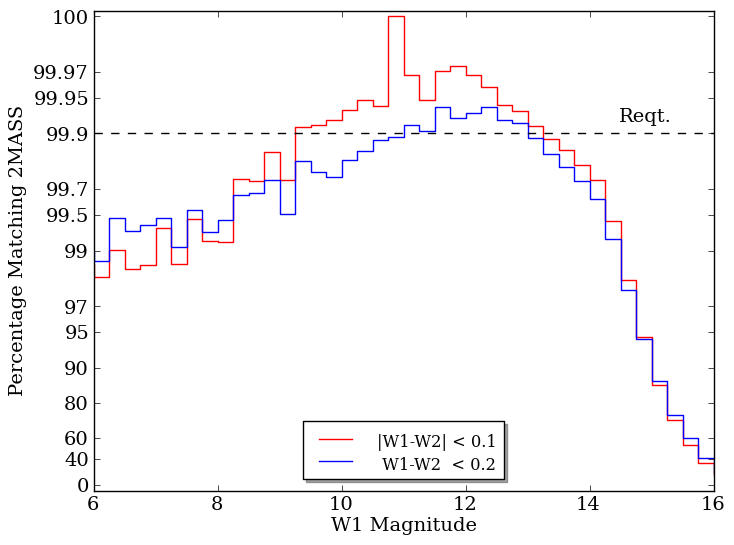
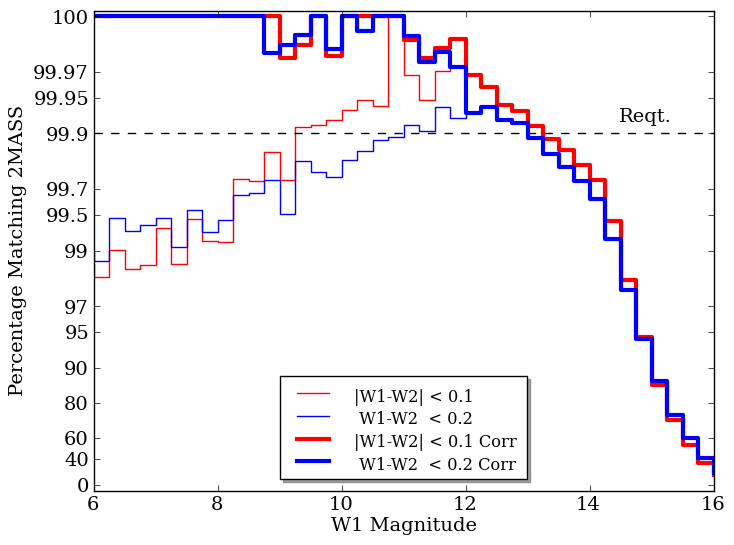
Figure 9a shows the fraction of WISE sources that have direct counterparts in the 2MASS catalog for each magnitude bin. 99.9% of the zero-color WISE stars have a 2MASS counterpart from magnitudes 9.5 to 13.5; the blue objects only 11.0 to 13.5. Past 14.0, the completeness of the 2MASS catalog impacts the matching fraction.
 |
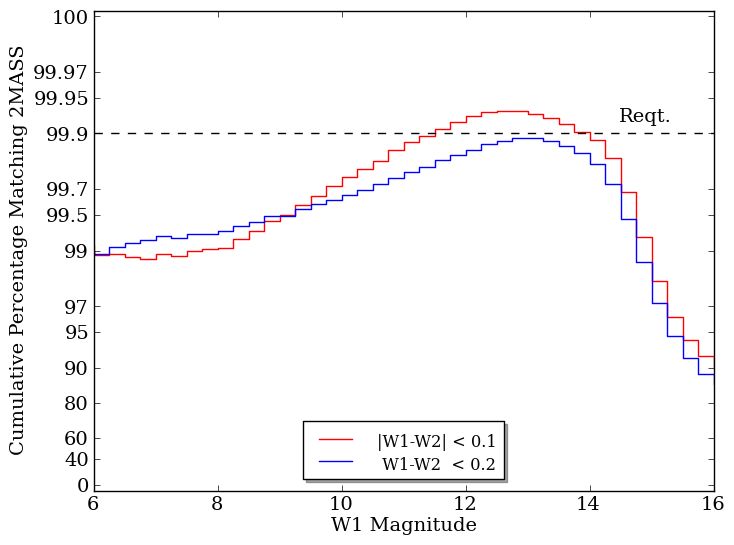 |
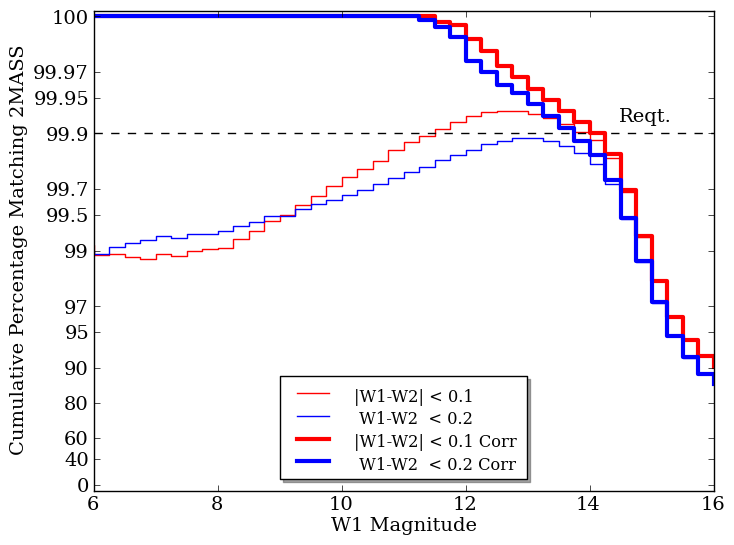
| Figure 9a - Fraction of 2MASS matches per bin when information from only the 2MASS data columns contained within the WISE All-Sky Release Catalog are considered. | Figure 9b - Cumulative fraction of 2MASS matches as a function of magnitude limit. This data shows that the 99.9% reliability requirement is met only for 11 < W1 < 14. A number of brighter sources where matches are expected are not found within the 3" search radius. |
The cumulative statistics shown in Figure 9b reinforce this picture. It's not until 11th magnitude that the sheer bulk of faint sources of zero-color type pulls the statistics up from the missing bright sources. A number of the unmatched bright sources were investigated by hand to determine why they were missed; in almost all these cases, there was in fact a bright 2MASS source in the vicinity, but it lay more than 3" away from the WISE position. This is not entirely unexpected; these bright stars will tend to be close by, and in the ~ 12 years between the 2MASS and WISE surveys, the proper motion of these sources will move them well outside the 3" match radius.
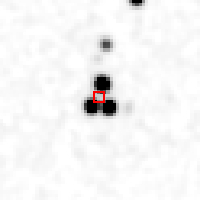
All the "missing" sources were recorded and those with a W1 magnitude < 12 were fed back into the 2MASS database, this time with a 10" search radius. If there was a source within 10", the K magnitude was compared against W1; if the putative |K–W1| was < 0.75 mag (factor of two in brightness), it was considered a definitive match. The vast majority of the unmatched bright sources were recovered in this way; most (> 95%) were simply high proper motion stars (Figure 10a). A few were "pathological" binaries (Figure 10b) or triples (Figure 10c)—multiple stars of a similar brightness with separations of 6 to 8", such that WISE could see them as only one object (Figure 10d), albeit with a bad χ2 fit. The centroid of this blur was more than 3" away from any of the positions of the components in 2MASS; therefore, the WISE source was originally considered unmatched.
 |
 |
 |
 |
| Figure 10a - High proper motion star LHS 3122 that moved 11.5" between the 2MASS and WISE observations. (2MASS J image, 1' FOV) | Figure 10b - An example of a "pathological" binary, where the WISE centroid lies between the two sources. (2MASS J image, 1' FOV) | Figure 10c - An example of a triple. (2MASS J image, 1' FOV) | Figure 10d - The appearance of the triple to WISE which saw it as a single source. (WISE W1 image, 1' FOV) |
A further 10 objects were matched by hand. 6 were sources with very high proper motions such that they moved between 10 and 13" between 2MASS and WISE. One was a very bright source whose W1–W2 color put it in the blue star range, but whose K magnitude fell outside the expectation. One source was a binary with a particularly bad spacing. The final two sources simply aren't in the 2MASS catalog, even though they are plainly visible in the 2MASS images. FZ Dra and BD+09 1904 should be members of the 2MASS catalog, but for whatever reason are not.
Adding the 12th mag and brighter 2MASS recoveries as well as the hand matching data to the reliability bins produces the thick curves in Figure 11. Now almost all WISE sources with W1 < 11.5 have 2MASS matches. The cumulative reliability (Figure 11b) does not drop below 99.9% until W1 ~ 14, consistent with the completeness limits of the 2MASS database. (Similar plots broken out by individual test regions are given in the WISE/2MASS supplementary material.)
 |
 |
| Figure 11a - Fraction of 2MASS matches per magnitude bin after chasing down the bright sources as described in the text. | Figure 11b - The cumulative fraction, after correction, shows that the 99.9% reliability requirement is met for all magnitudes down to W1 ~ 14, where the completeness of the 2MASS catalog limits the source matching. |
Therefore, the WISE Source Catalog is found to achieve 99.9% reliability for W1/W2 sources brighter than 14th magnitude and to be compliant with the reliability requirement within the constraints of the 2MASS catalog completeness and our definition of a "star." While this comparison does not validate all SNR = 20 sources from WISE, it does show that the artifact flagging algorithms are robust and do not allow a significant fraction of spurious sources to be included in the catalog. An important caution, however, is that brighter sources may not be perceived to have 99.9% reliability if the 2MASS-related columns in the WISE catalog are used in isolation. Proper motion and multiplicity must be taken into account for bright WISE sources that do not have 2MASS counterparts listed in the catalog.
A deeper comparison with the 2MASS data set is possible by using the 2MASS "Combined Calibration Field Source Table", available from IRSA Gator. These calibration data were derived from regions of the sky that had been covered several thousand times. The spatial coverage is small, but the depth has been increased to roughly K = 18. Accordingly, 5 regions (90013, 90161, 90191, 90312, and 90868) were selected for comparison. Each area of sky was scanned more than 2000 times, and the resultant data sets were chosen to have a relatively "benign" appearance: no very dense clusters, few visible imaging artifacts, smooth flat backgrounds, etc.
Because the field areas are small, we did not restrict the WISE colors to be star-like for this comparison; all 8500 WISE sources were included (whose cc_flags were "0000"). The initial results are presented in Figure 12.
 |
 |
| Figure 12a - Fraction of 2MASS calibration field matches per SNR bin. | Figure 12b - The cumulative fraction of deep 2MASS matches shows that the 99.9% reliability requirement is missed for SNR = 20. A few bright missing sources drag down the overall reliability. |
As is the case for the general 2MASS catalog comparison, a number of bright WISE sources were not matched in the deep 2MASS data when searching using the standard 3" radius, and thus the reliability in W1 and W2 fall just short of the requirement. A second search was run using a 10" radius as before, but because we did not place any restrictions on source color, rather than compare the K and W1 magnitudes directly, we estimate a K magnitude from the W1–W2 color, then compare that predicted value with the measured 2MASS value. If the match in values is good to 0.75 mag, then the source is considered to be matched.
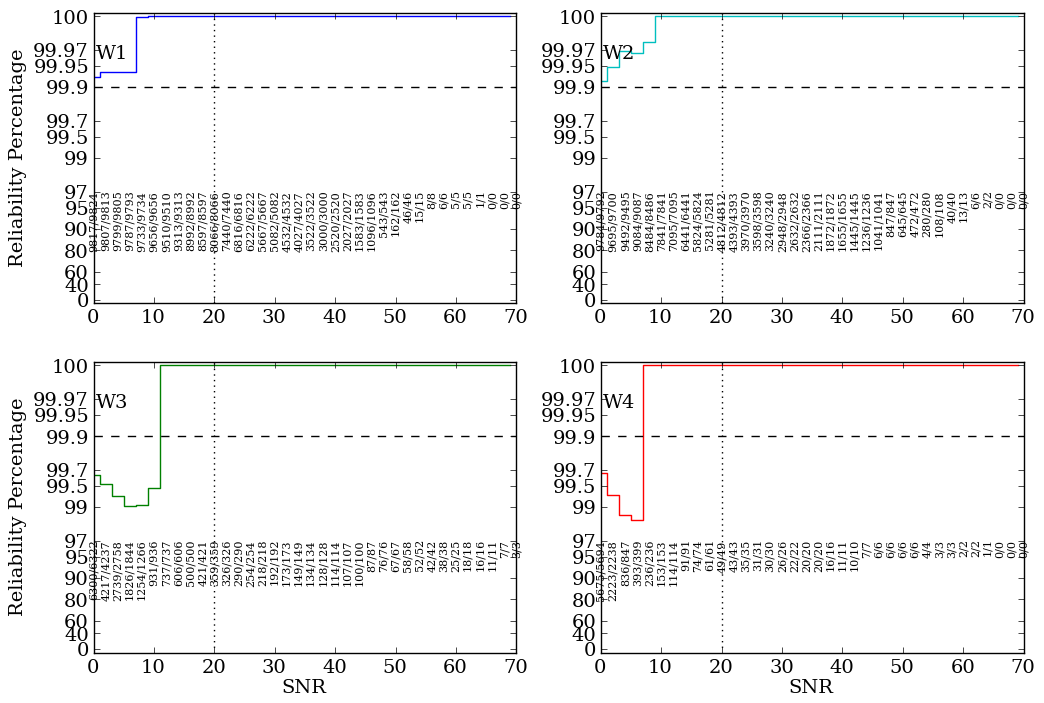
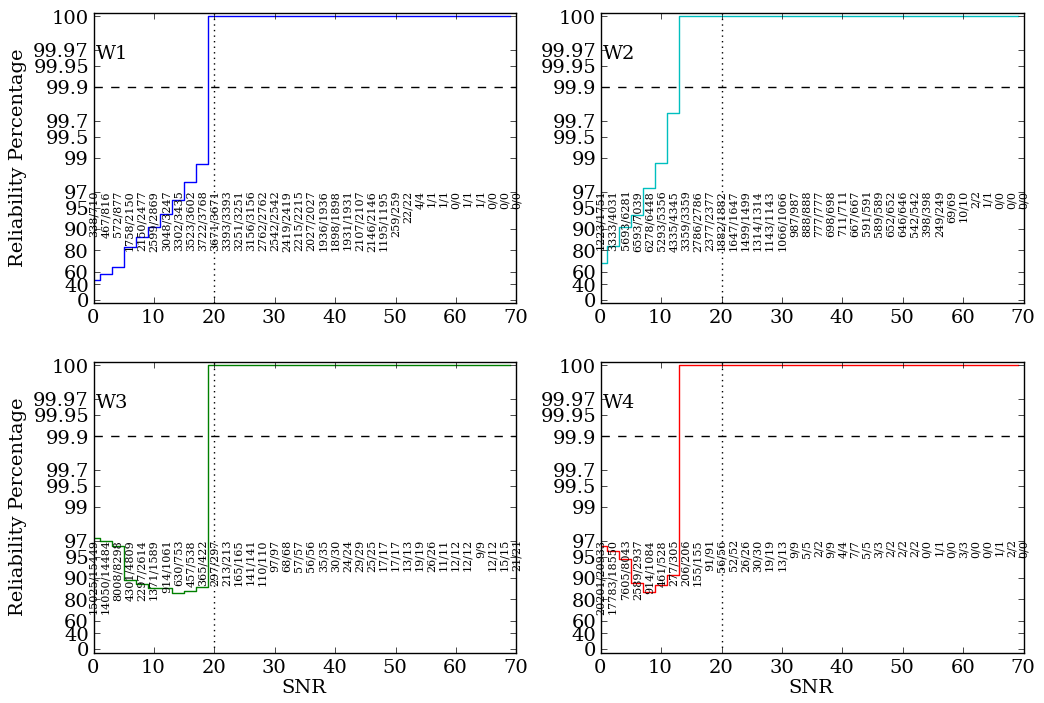
An additional 4 sources were matched by hand. One was binary with a very bad geometry. The other three had a 2MASS source outside the 0.75 mag matching requirement, but there was clearly a 2MASS source in the imaging data at the WISE position, and so they were counted. Between the rescan and the hand matching, 29 of the 70 missing sources were recovered. The corrected plots are shown in Figure 13. The reliability requirement is now met easily for all 4 bands; in fact, 100% of the sources with a WISE SNR ≥ 20 have counterparts in the 2MASS deep calibration data for these selected fields.
 |
 |
| Figure 13a - Fraction of 2MASS calibration field matches per SNR bin after the bright sources have been recovered. Indeed, 100% of the WISE sources with SNR ≥ 20 are found to have 2MASS counterparts. | Figure 13b - The cumulative fraction now shows that the 99.9% requirement is met even down to SNR ~ 16. |
An assessment of the reliability of WISE source extractions using Spitzer Space Telescope data as the truth table is perhaps the ultimate check since WISE and Spitzer observed at approximately the same wavelengths. There are a number of regions where Spitzer performed deep surveys, to depths much greater than WISE could achieve; the spatial resolution of Spitzer is also a factor of 2 better. Therefore, truly anything that is listed as a source in WISE should be present in these Spitzer fields.
The analysis proceeds in much the same fashion as for the deep 2MASS fields: all WISE sources that overlap the Spitzer fields and that do not have any artifact flags are searched for a Spitzer counterpart within 3" of the listed position. For sources where no counterpart was found, an interactive search using Spitzer cutouts was performed. All missing sources with w1snr ≥ 15, w2snr ≥ 12, w3snr ≥ 10, or w4snr ≥ 10 were searched in an effort to recover them. Almost all the sources that were recovered were either knots of emission from extended galaxies that WISE identified as a separate source in addition to the galaxy core whereas Spitzer included it all as one galaxy (these are "real" sources in that there is a source of astrophysical flux at the given position; it's just not a point source), or as the usual pathological binaries or clusters (of stars or galaxies). A few examples are shown in Figure 14.
 |
 |
 |
| Figure 14a - Binary/clustered sources are very common unmatched sources. WISE sees a single source in the center, but Spitzer reports two sources, both of which are more than 3" from the WISE position. | Figure 14b - Brighter spots in the disks of edge-on galaxies show up frequently. The WISE catalog makes no attempt to merge multiple sources of emission from a galaxy as a single extended source. | Figure 14c - Spiral arms and other complex galactic structures are also a common form that produce multiple WISE sources. |
We begin with the seven fields from the SWIRE and COSMOS surveys. These fields are dominated by stars and galaxies, the areal density is rather low, and there is little extended emission present, thus they represent a relatively benign test of the catalog extraction algorithms. Each field is typically a few square degrees and has from 5,000 to 40,000 WISE sources contained within it.
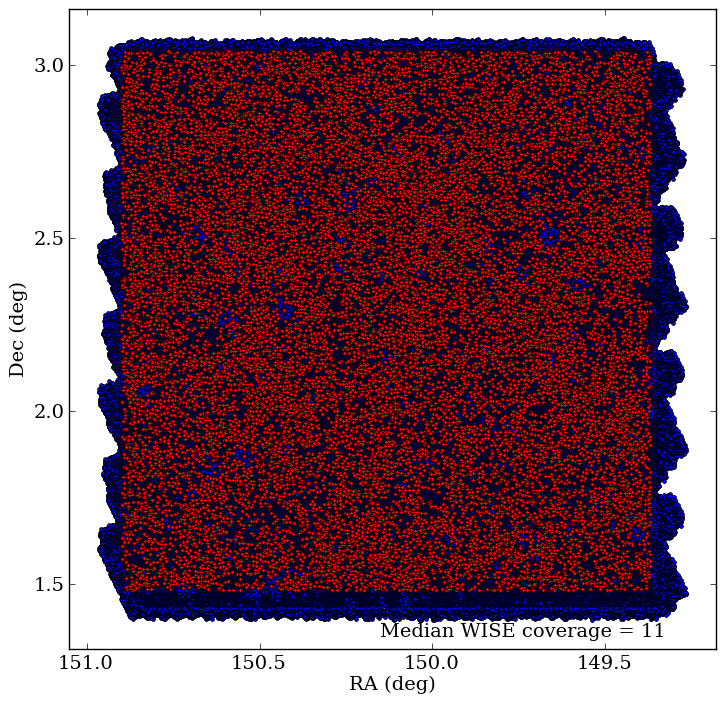
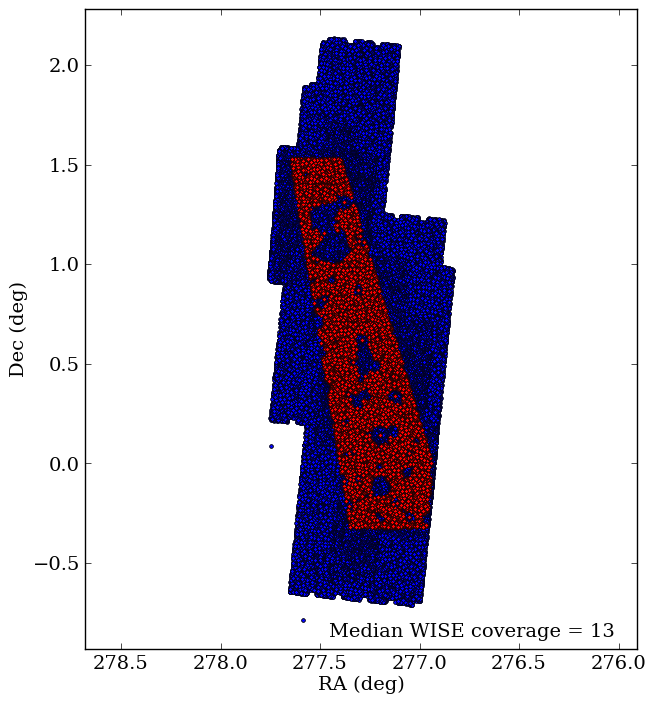
Figure 15 shows the results for the COSMOS field. A map is given showing the position of the WISE sources plotted over those from the Spitzer survey, followed by the usual differential and cumulative reliability plots. The search area for the WISE sources was deliberately chosen to be slightly smaller than the full Spitzer survey fields to avoid artificially missing sources at the edges of the field. Results from the six SWIRE fields are essentially identical and are shown in the WISE/Spitzer supplementary material.
 |
 |
 |
| Figure 15a - Map of the COSMOS field coverage. Spitzer sources are in blue, the WISE sources are in red. | Figure 15b - Differential reliability for the COSMOS field after interactive source recovery. | Figure 15c - Cumulative reliability for the COSMOS field after interactive source recovery. |
The results show that 100% the WISE sources with SNR ≥ 20 in the COSMOS field have matching Spitzer entries, when binarity and extended source emission are taken into account. In fact, only 2 of the more than 130,000 sources with SNR > 20 in these 7 fields are not matched (one in CDF-s and one in Lockman).
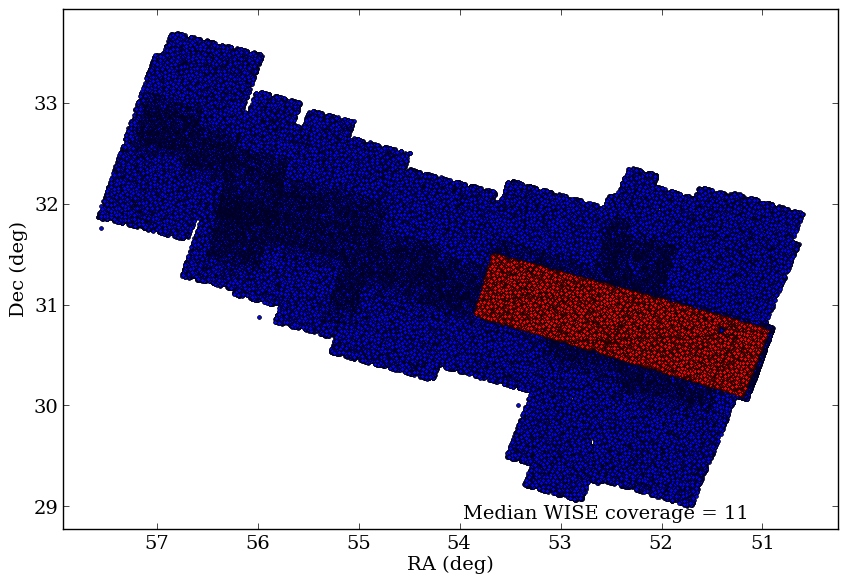
To investigate the effect of very red sources and nebulosity on the reliability, 4 of the 5 regions from the Spitzer C2D CLOUDS surveys were also analyzed (Chamaeleon, Perseus, Serpens, and Ophiuchus; the Lupus patches are too small to yield good statistics). The WISE search regions were limited to those areas within the Spitzer surveys that had the deepest coverage. Unlike the extragalactic fields where nearly 100% of the Spitzer area could be searched for matches to WISE, the SFRs had much less uniform coverage, so the fraction of each area that could be searched is much smaller, as is demonstrated in the maps.
The processing for these star-forming regions (SFRs) proceeded in the same manner as for the SWIRE and COSMOS fields, including the interactive matching of missing sources to the same SNR depths listed above, with the exception of Ophiuchus which will be discussed more extensively. Figure 16 shows the results for the Chamaeleon region, Figure 17 for the Perseus region, and Figure 18 for the Serpens region.
 |
 |
 |
| Figure 16a - Map of the Chamaeleon SFR coverage. Spitzer is in blue, WISE is in red. | Figure 16b - Differential reliability for the Chamaeleon SFR after interactive source recovery. | Figure 16c - Cumulative reliability for the Chamaeleon SFR after interactive source recovery. |
 |
 |
 |
| Figure 17a - Map of the Perseus SFR coverage. Spitzer is in blue, WISE is in red. | Figure 17b - Differential reliability for the Perseus SFR after interactive source recovery. | Figure 17c - Cumulative reliability for the Perseus SFR after interactive source recovery. |
 |
 |
 |
| Figure 18a - Map of the Serpens SFR coverage. Spitzer is in blue, WISE is in red. | Figure 18b - Differential reliability for the Serpens SFR after interactive source recovery. | Figure 18c - Cumulative reliability for the Serpens SFR after interactive source recovery. |
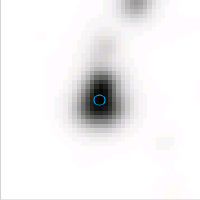
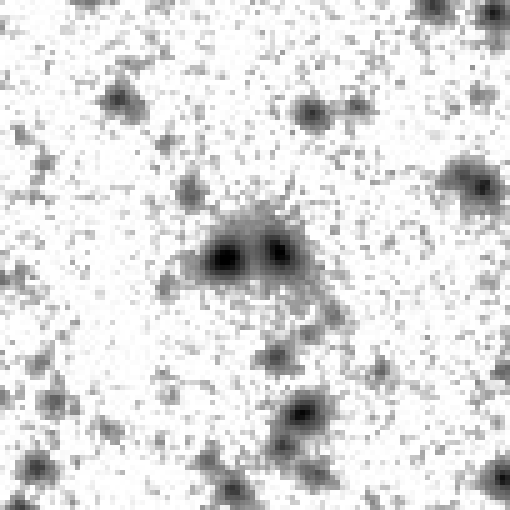
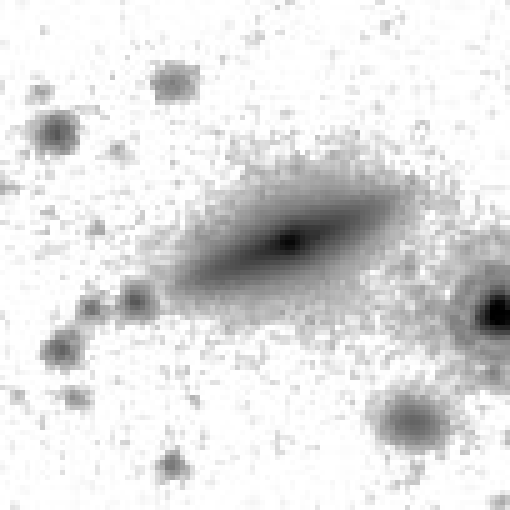
Of the more than 20,000 sources with SNR ≥ 20 in these three CLOUDS fields, every one of them was successfully matched to a Spitzer counterpart. However, there is a very important caution. Not all the matched sources are point sources. Figure 19 shows an example of a WISE source that was detected at SNR = 18 in W3. There is no point source contained within the circular marker, but there is an "astrophysical source"—the nebulosity—that the WISE source extractor found. The Spitzer data shows an identical structure, so the source is real and contributes to the good reliability of the WISE source catalog. Therefore, even for moderately complex fields that include nebulosity, the WISE source extractions (as long as they are not required to be true point sources) are very reliable.
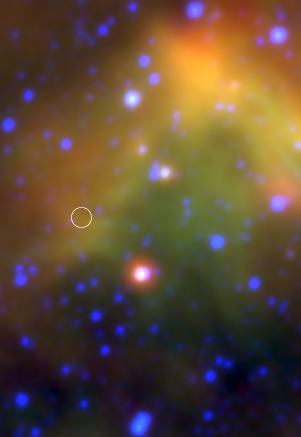 |
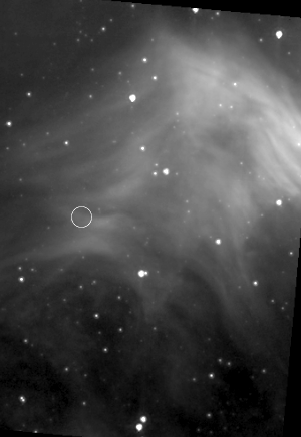 |
| Figure 19a - A WISE W1/W3/W4 image of a SNR = 18 "source" in Serpens. There is clearly flux originating from the encircled area, though there is no point source. | Figure 19b - The Spitzer 8 μm image of the same area. The same structures are observed, confirming the reality of the WISE source. |
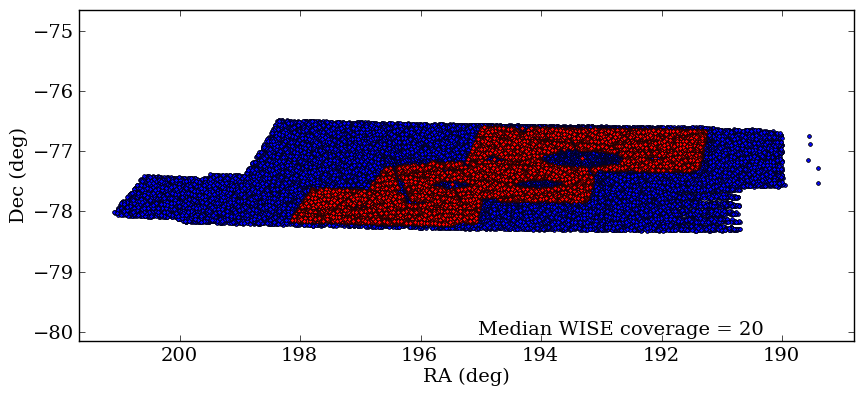
The star forming region in Ophiuchus is an extreme case, far more complex than the other three SFRs. Essentially the whole region scanned by Spitzer is filled with nebulosity (Figure 20), and by restricting ourselves to the portions with the greatest coverage, we ensure that the WISE search area will also be extremely contaminated by this emission.
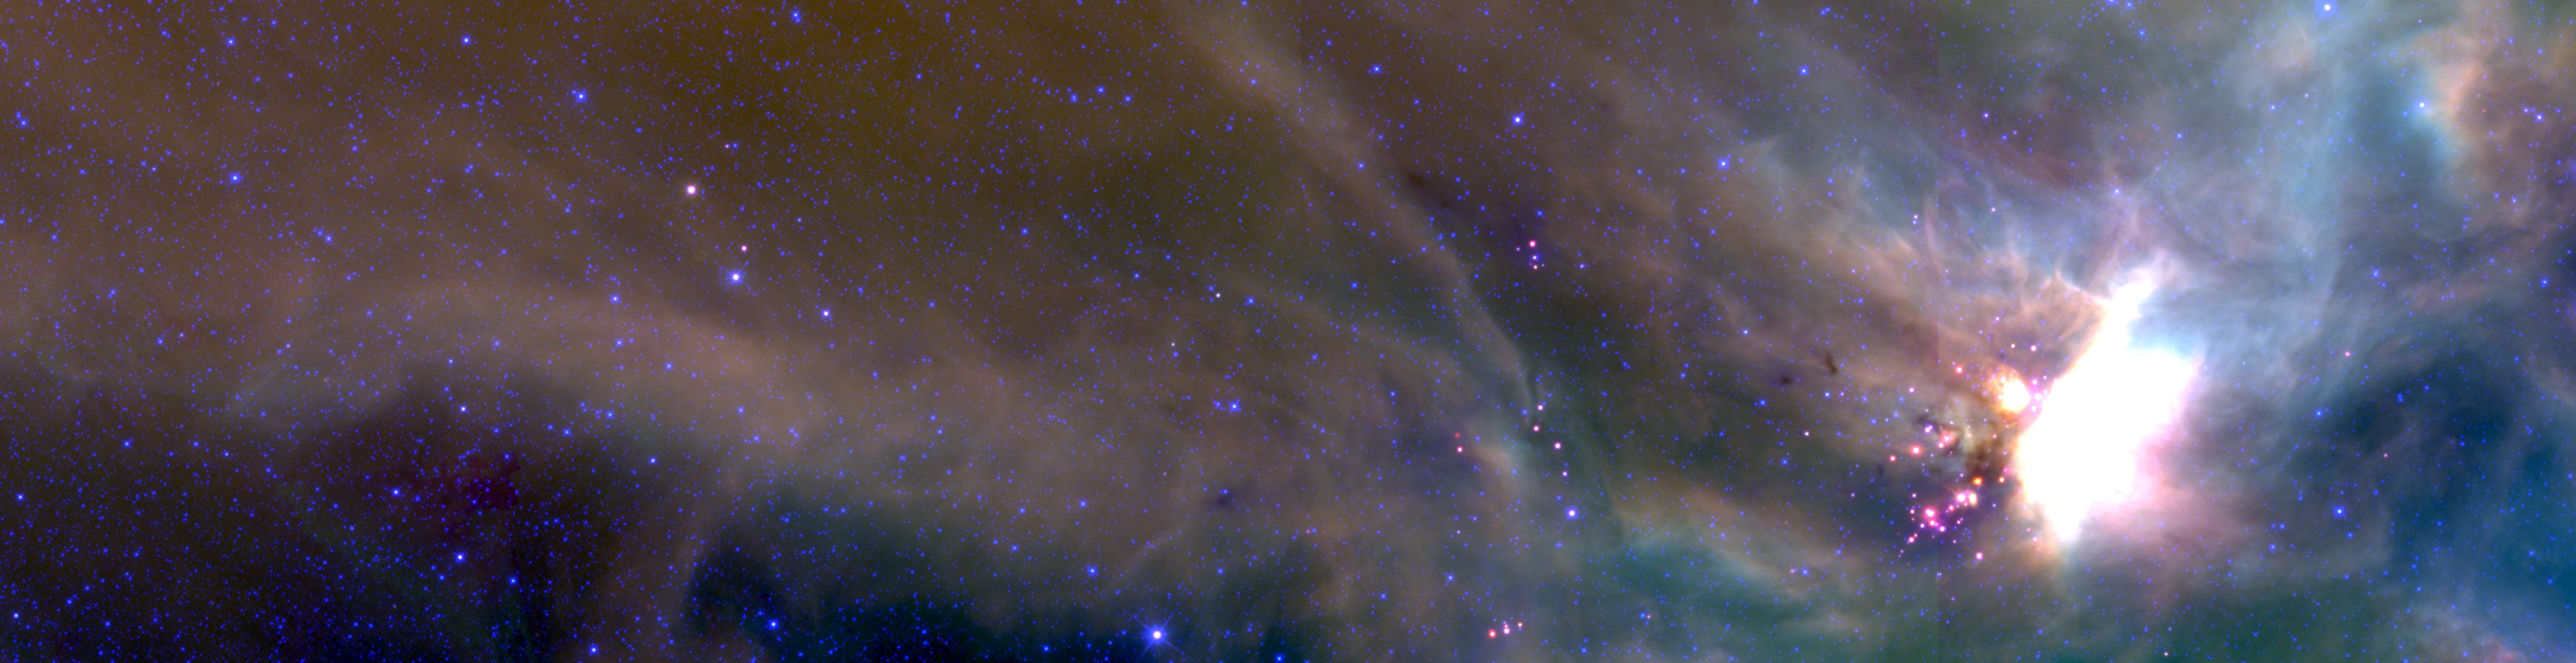 |
| Figure 20 - The four tiles from WISE in the Ophiuchus SFR that contain most of the sources used in the reliability comparison. (Red = W4, green = W3, and blue = W1.) |
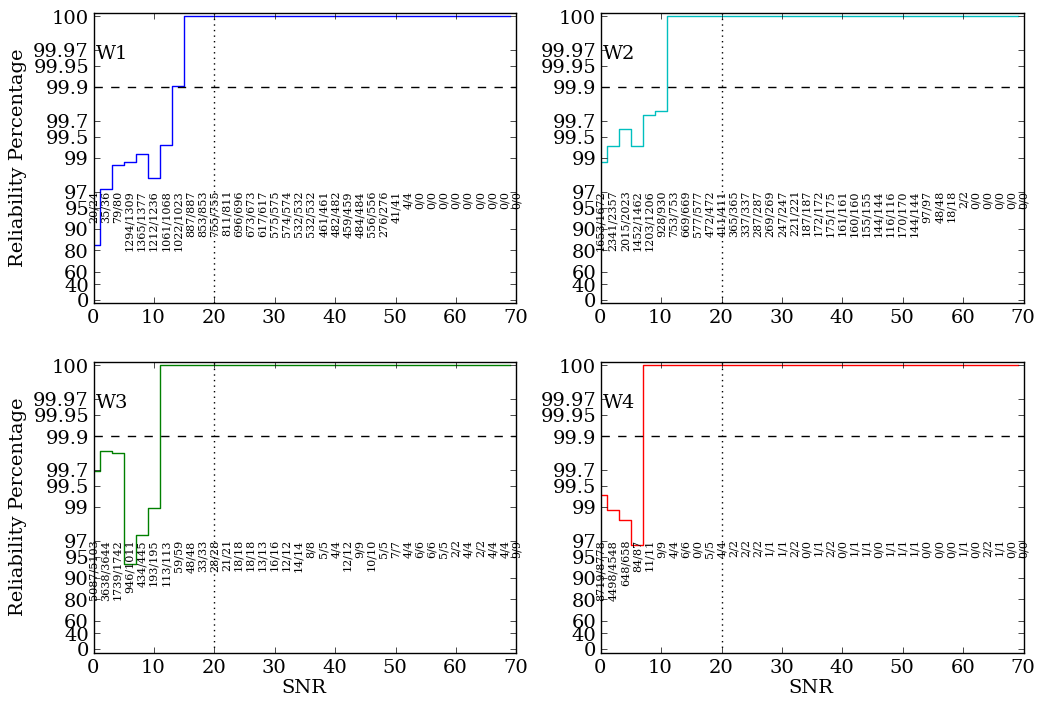
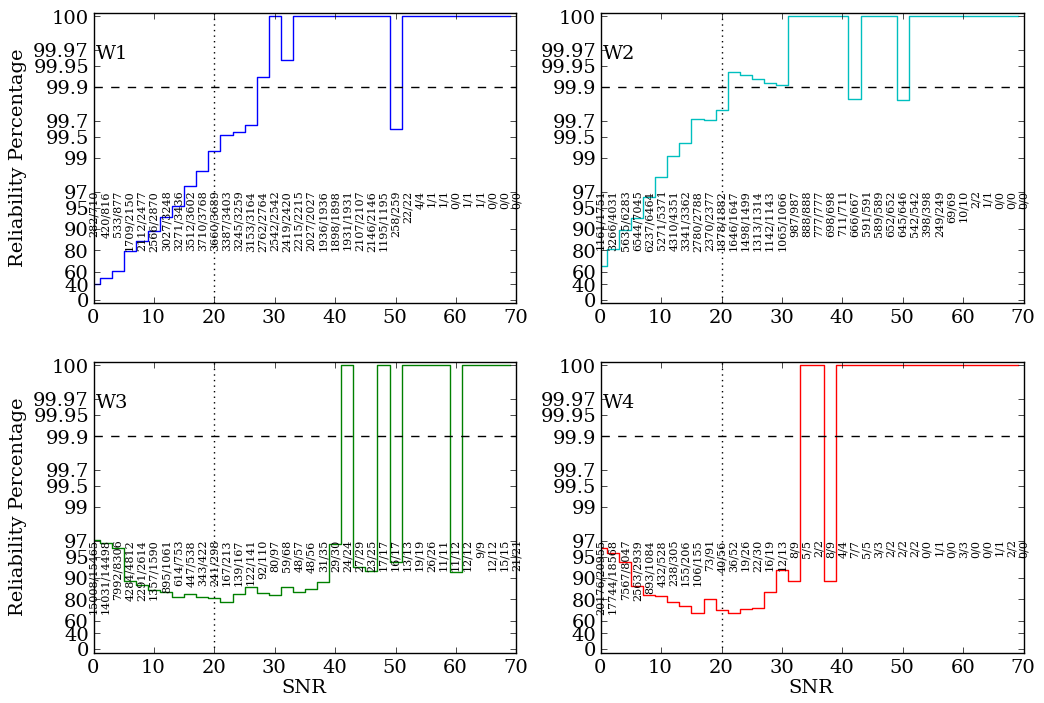
Figure 21 shows the reliability data before the interactive matching; simply a direct comparison of the WISE source lists against the Spitzer point source lists. In W2, the requirement is met without any such hand tuning in spite of the complexity of the field, and nearly so in W1. W3 and W4, however match only 80% of the sources above SNR = 20.
 |
 |
 |
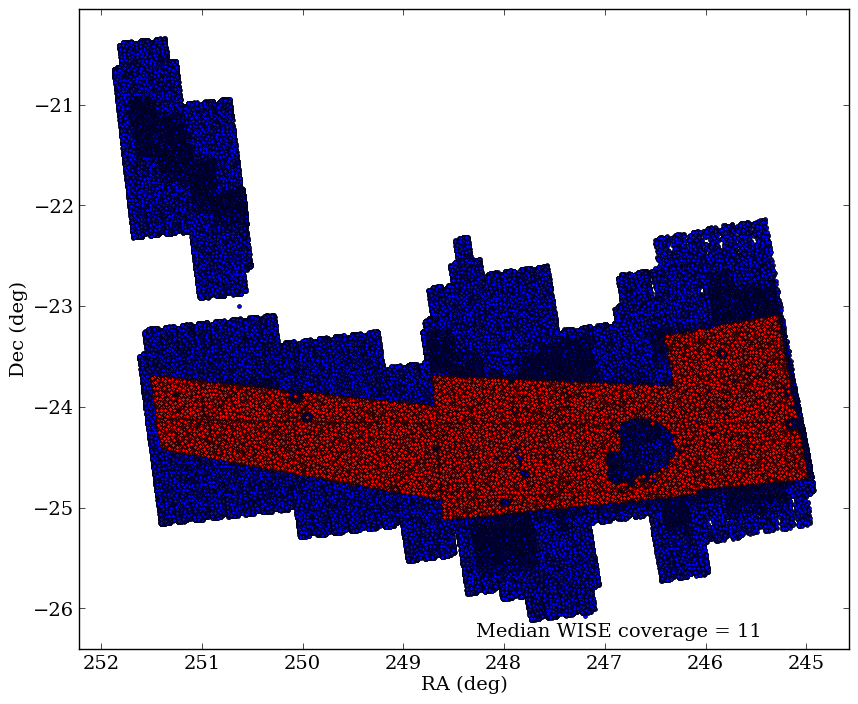
| Figure 21a - Map of the Ophiuchus SFR coverage. Spitzer is in blue, WISE is in red. | Figure 21b - Differential reliability for the Ophiuchus SFR before interactive source recovery. | Figure 21c - Cumulative reliability for the Ophiuchus SFR before interactive source recovery. |
The apparently poor reliability in W3 and W4 comes down entirely to the fact that WISE is a source catalog, not a point source catalog. 400 unmatched sources were examined by hand, and except for a half dozen or so binaries, they were all patches of nebulosity. At some level, then, it may seem silly to say that these sources have been recovered. In principal, a random list of coordinates that falls inside a relatively smooth region of nebulosity will be 100% reliable since by definition there is an astrophysical source at each spot. However, the important point for the reliability of the WISE source catalog is that each of these 400 coordinates has also been found to have measurable flux in the Spitzer imaging data, so that in all these cases, WISE has reliably detected the existence of each of these reported sources. No attempt was made to compare the measured flux levels between the WISE and Spitzer detections; this would really require a surface brightness measurement that WISE is not calibrated to produce.
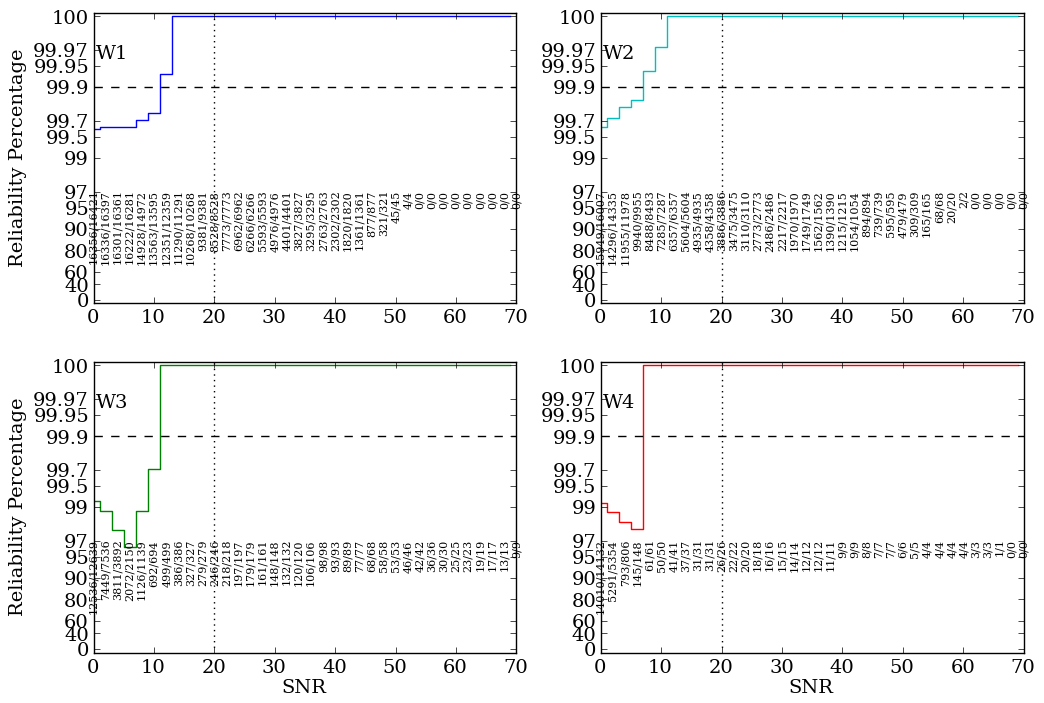
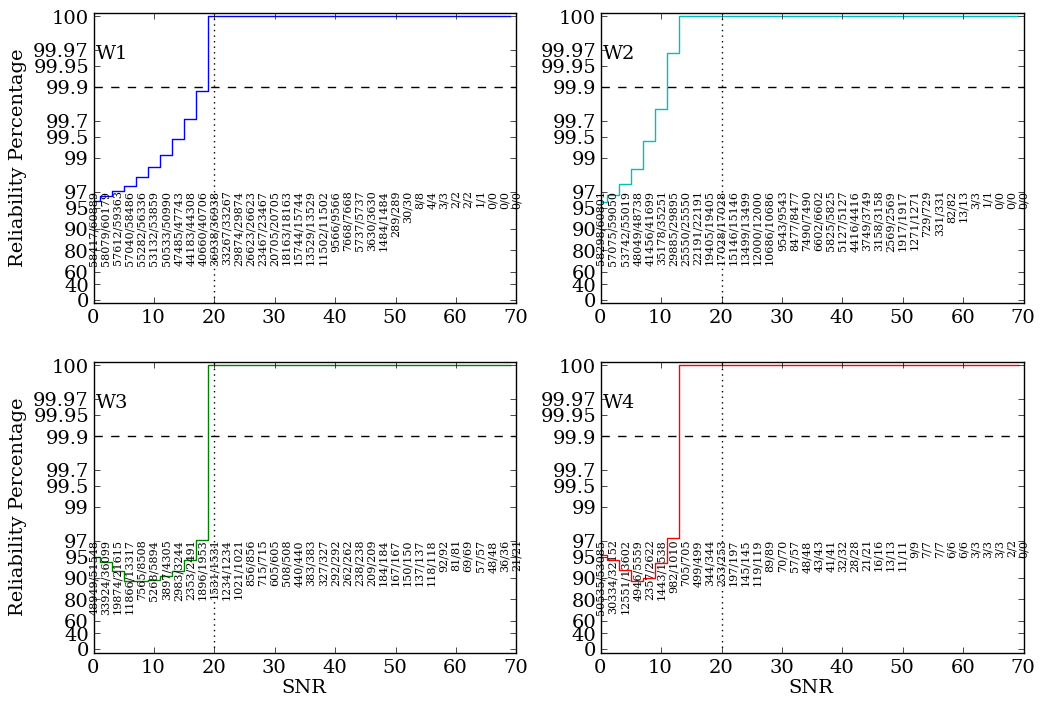
For completeness, the revised Ophiuchus reliability plots are presented in Figure 22. Because of the sheer number of sources (more than the other three fields combined), corrections were made only for sources down to SNR = 19 in W1, 12 in W2, 19 in W3, and 12 in W4, unlike the 15, 12, 10, and 10 as for all other regions. Because all sources were found to be either point sources or patches of nebulosity, the reliability is 100% down to the SNR levels of the hand corrections, and falls precipitously to the uncorrected levels below that.
 |
 |
 |
| Figure 22a - Map of the Ophiuchus SFR coverage. Spitzer is in blue, WISE is in red. (Repeat of Fig 21a) | Figure 22b - Differential reliability for the Ophiuchus SFR after interactive source recovery. | Figure 22c - Cumulative reliability for the Ophiuchus SFR after interactive source recovery. |
In summary, the COSMOS, SWIRE, and CLOUDS fields demonstrate that deep Spitzer fields are extremely effective truth tables and that the reliability of the WISE source extractions is very good when the differences in spatial resolution between WISE and Spitzer are properly taken into account, as well as the fact that WISE is a source catalog, not a point source catalog. The 99.9% reliability requirement is once more confirmed.
Last update: 2012 March 23