


The WISE Source Catalog shall be at least 95% complete for sources detected with SNR > 20 in at least one band, where the noise includes flux errors due to zodiacal foreground emission, instrumental effects, source photon statistics, and neighboring sources. This requirement shall not apply to sources that are superimposed on an identified artifact.
Because the coverage of the WISE survey is nonuniform the SNR, source confusion, and the resulting completeness levels will vary with position on the sky. Therefore it is not possible to provide a single flux density in any one band at which the data are 95% complete. We have tested the completeness using internal WISE-only data sets, and also by comparisons of WISE data with public Spitzer data. We first describe the internal tests, and then the external tests.
To determine the completeness we have carried out tests with the WISE data alone by taking advantage of the much greater depth of the polar fields, listed below.
| Tile | R.A. | Declination | Eclip.Long. | Eclip.Lat. | Gal.Long. | Gal.Lat. |
|---|---|---|---|---|---|---|
| 0891m637 | 89.17615245 | -63.606667 | 82.9242 | -87.0257 | 272.9707 | -30.1350 |
| 0949m682 | 94.94249910 | -68.150000 | 222.8398 | -87.5225 | 278.2905 | -27.9803 |
| 0988m682 | 98.89843657 | -68.150000 | 209.6575 | -86.2293 | 278.4666 | -26.5175 |
| 2675p636 | 267.52845736 | +63.6066667 | 250.1466 | +86.8682 | 92.9537 | +30.8320 |
| 2708p636 | 270.8312778 | +63.606667 | 277.1390 | +87.0253 | 92.9954 | +29.3998 |
| 2741p636 | 274.13409828 | +63.606667 | 303.1045 | +86.5726 | 93.1346 | 27.9011 |
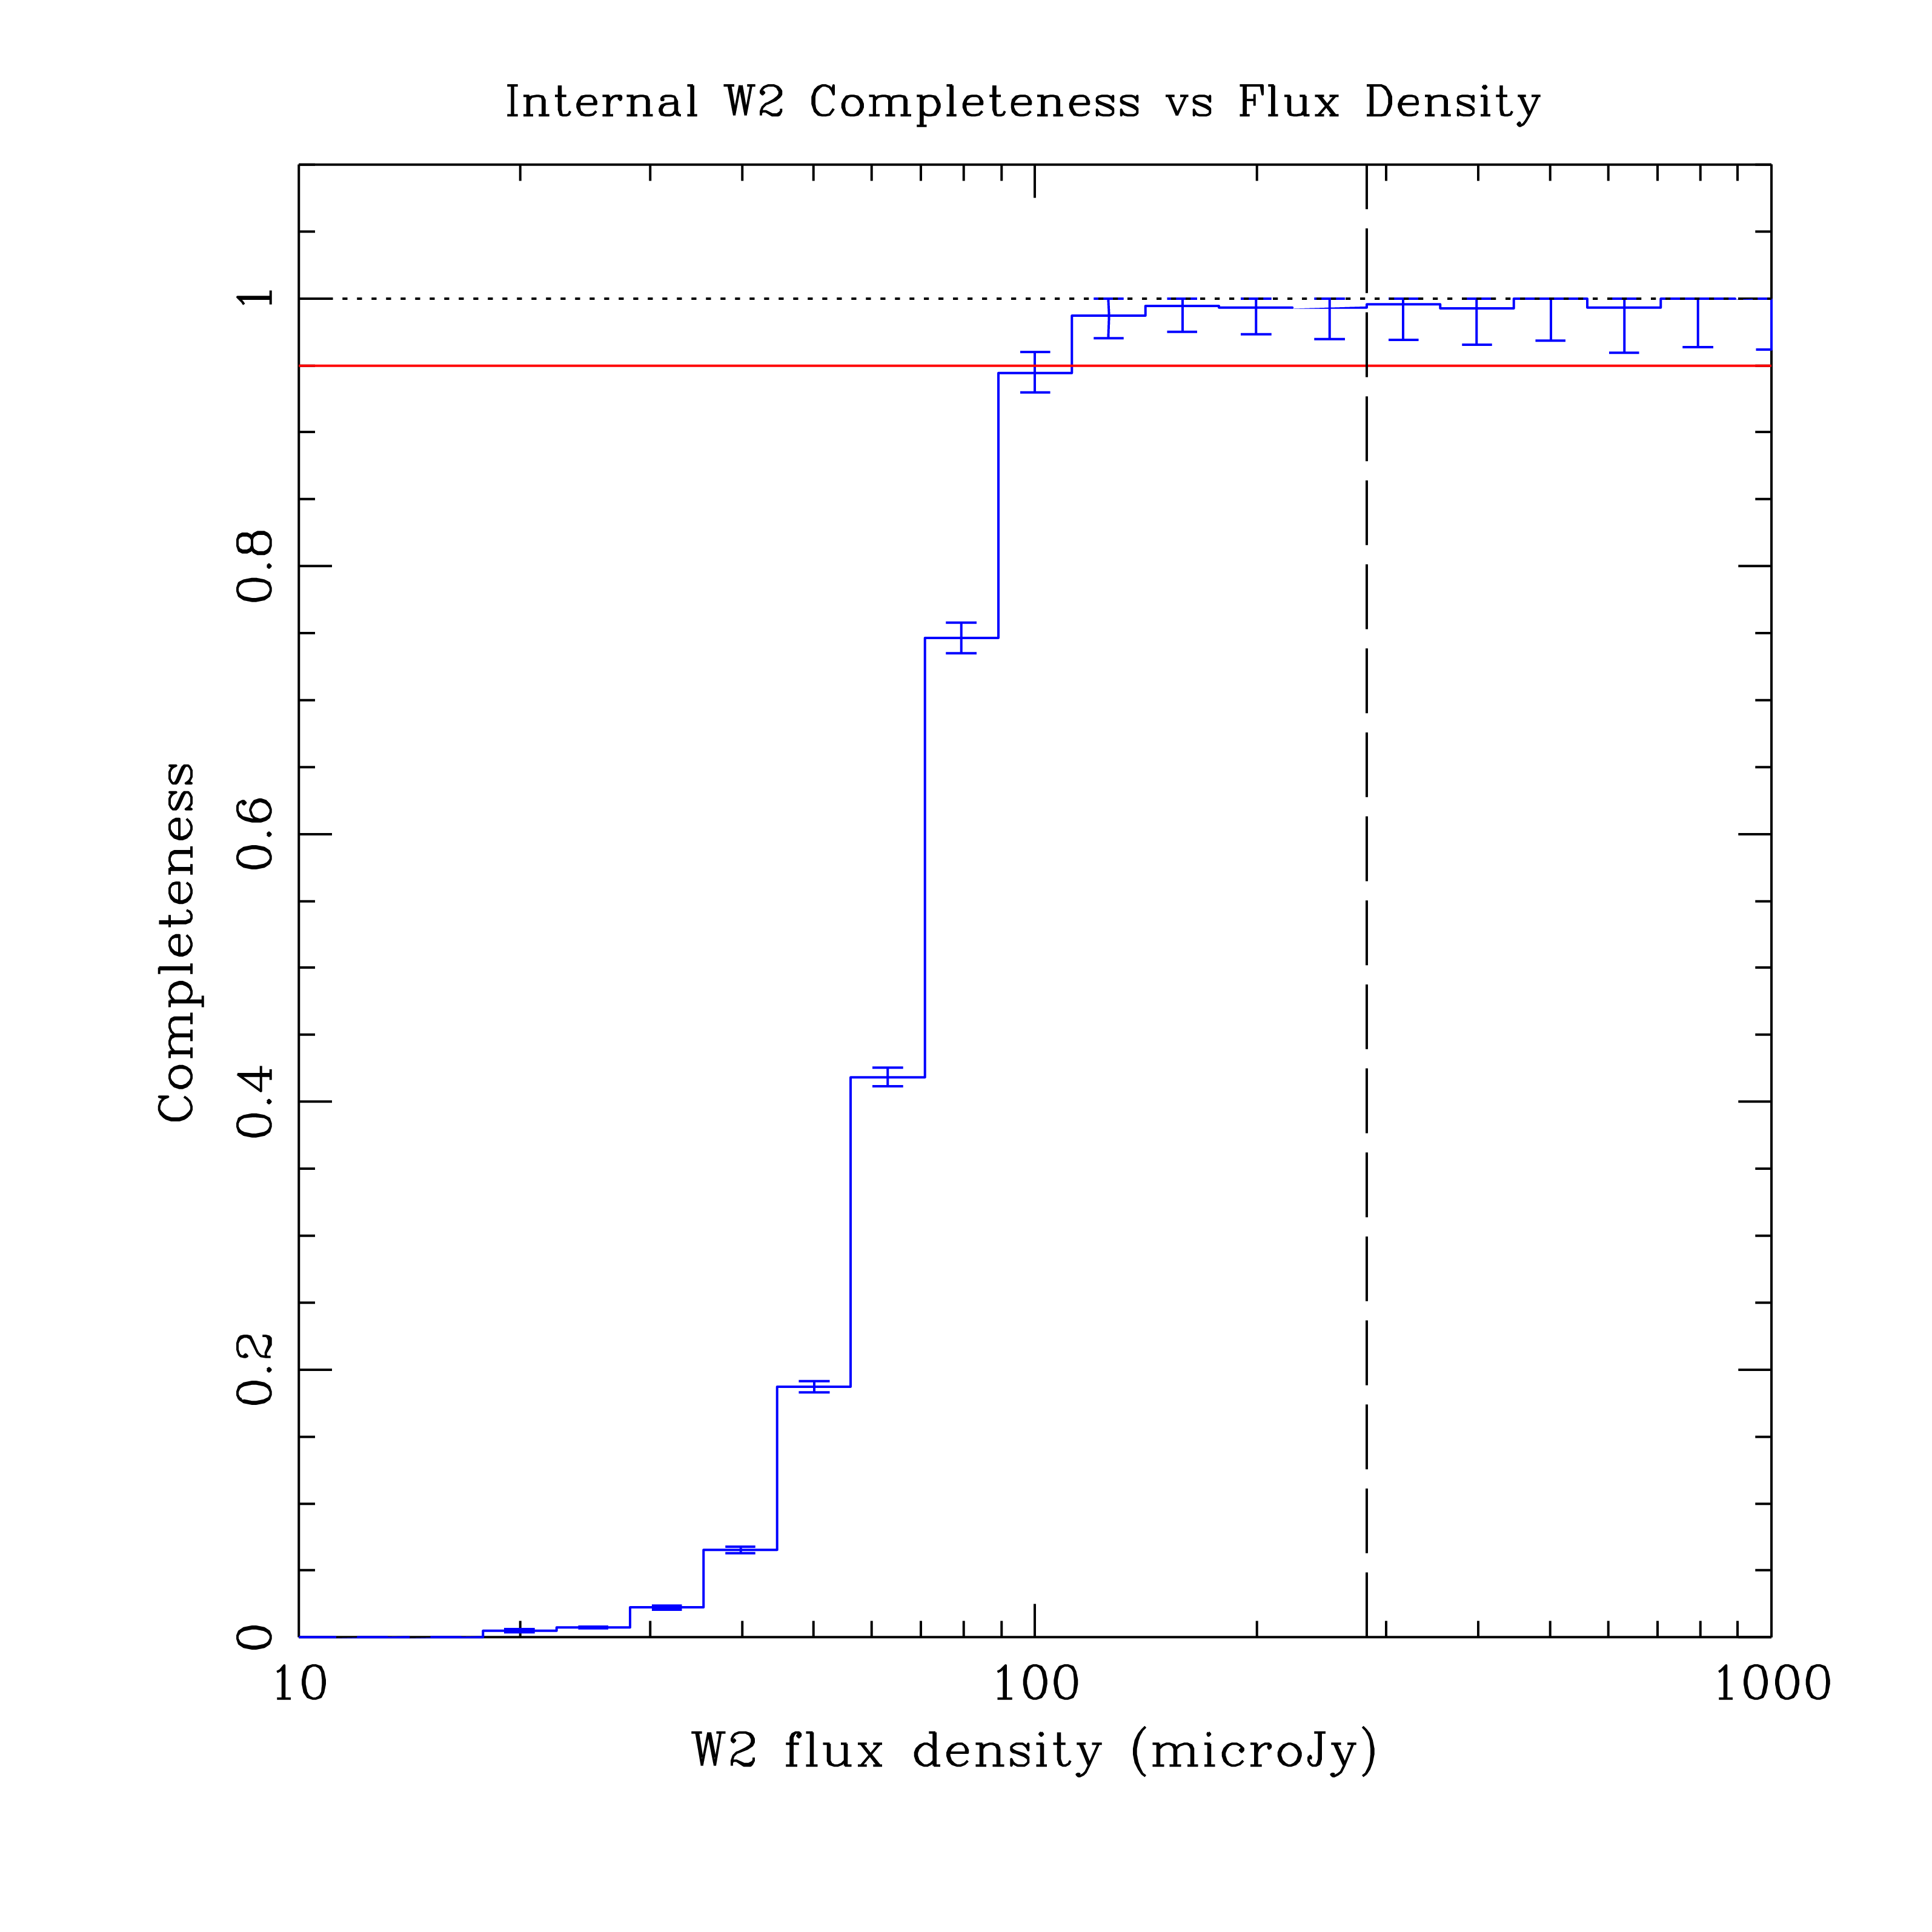
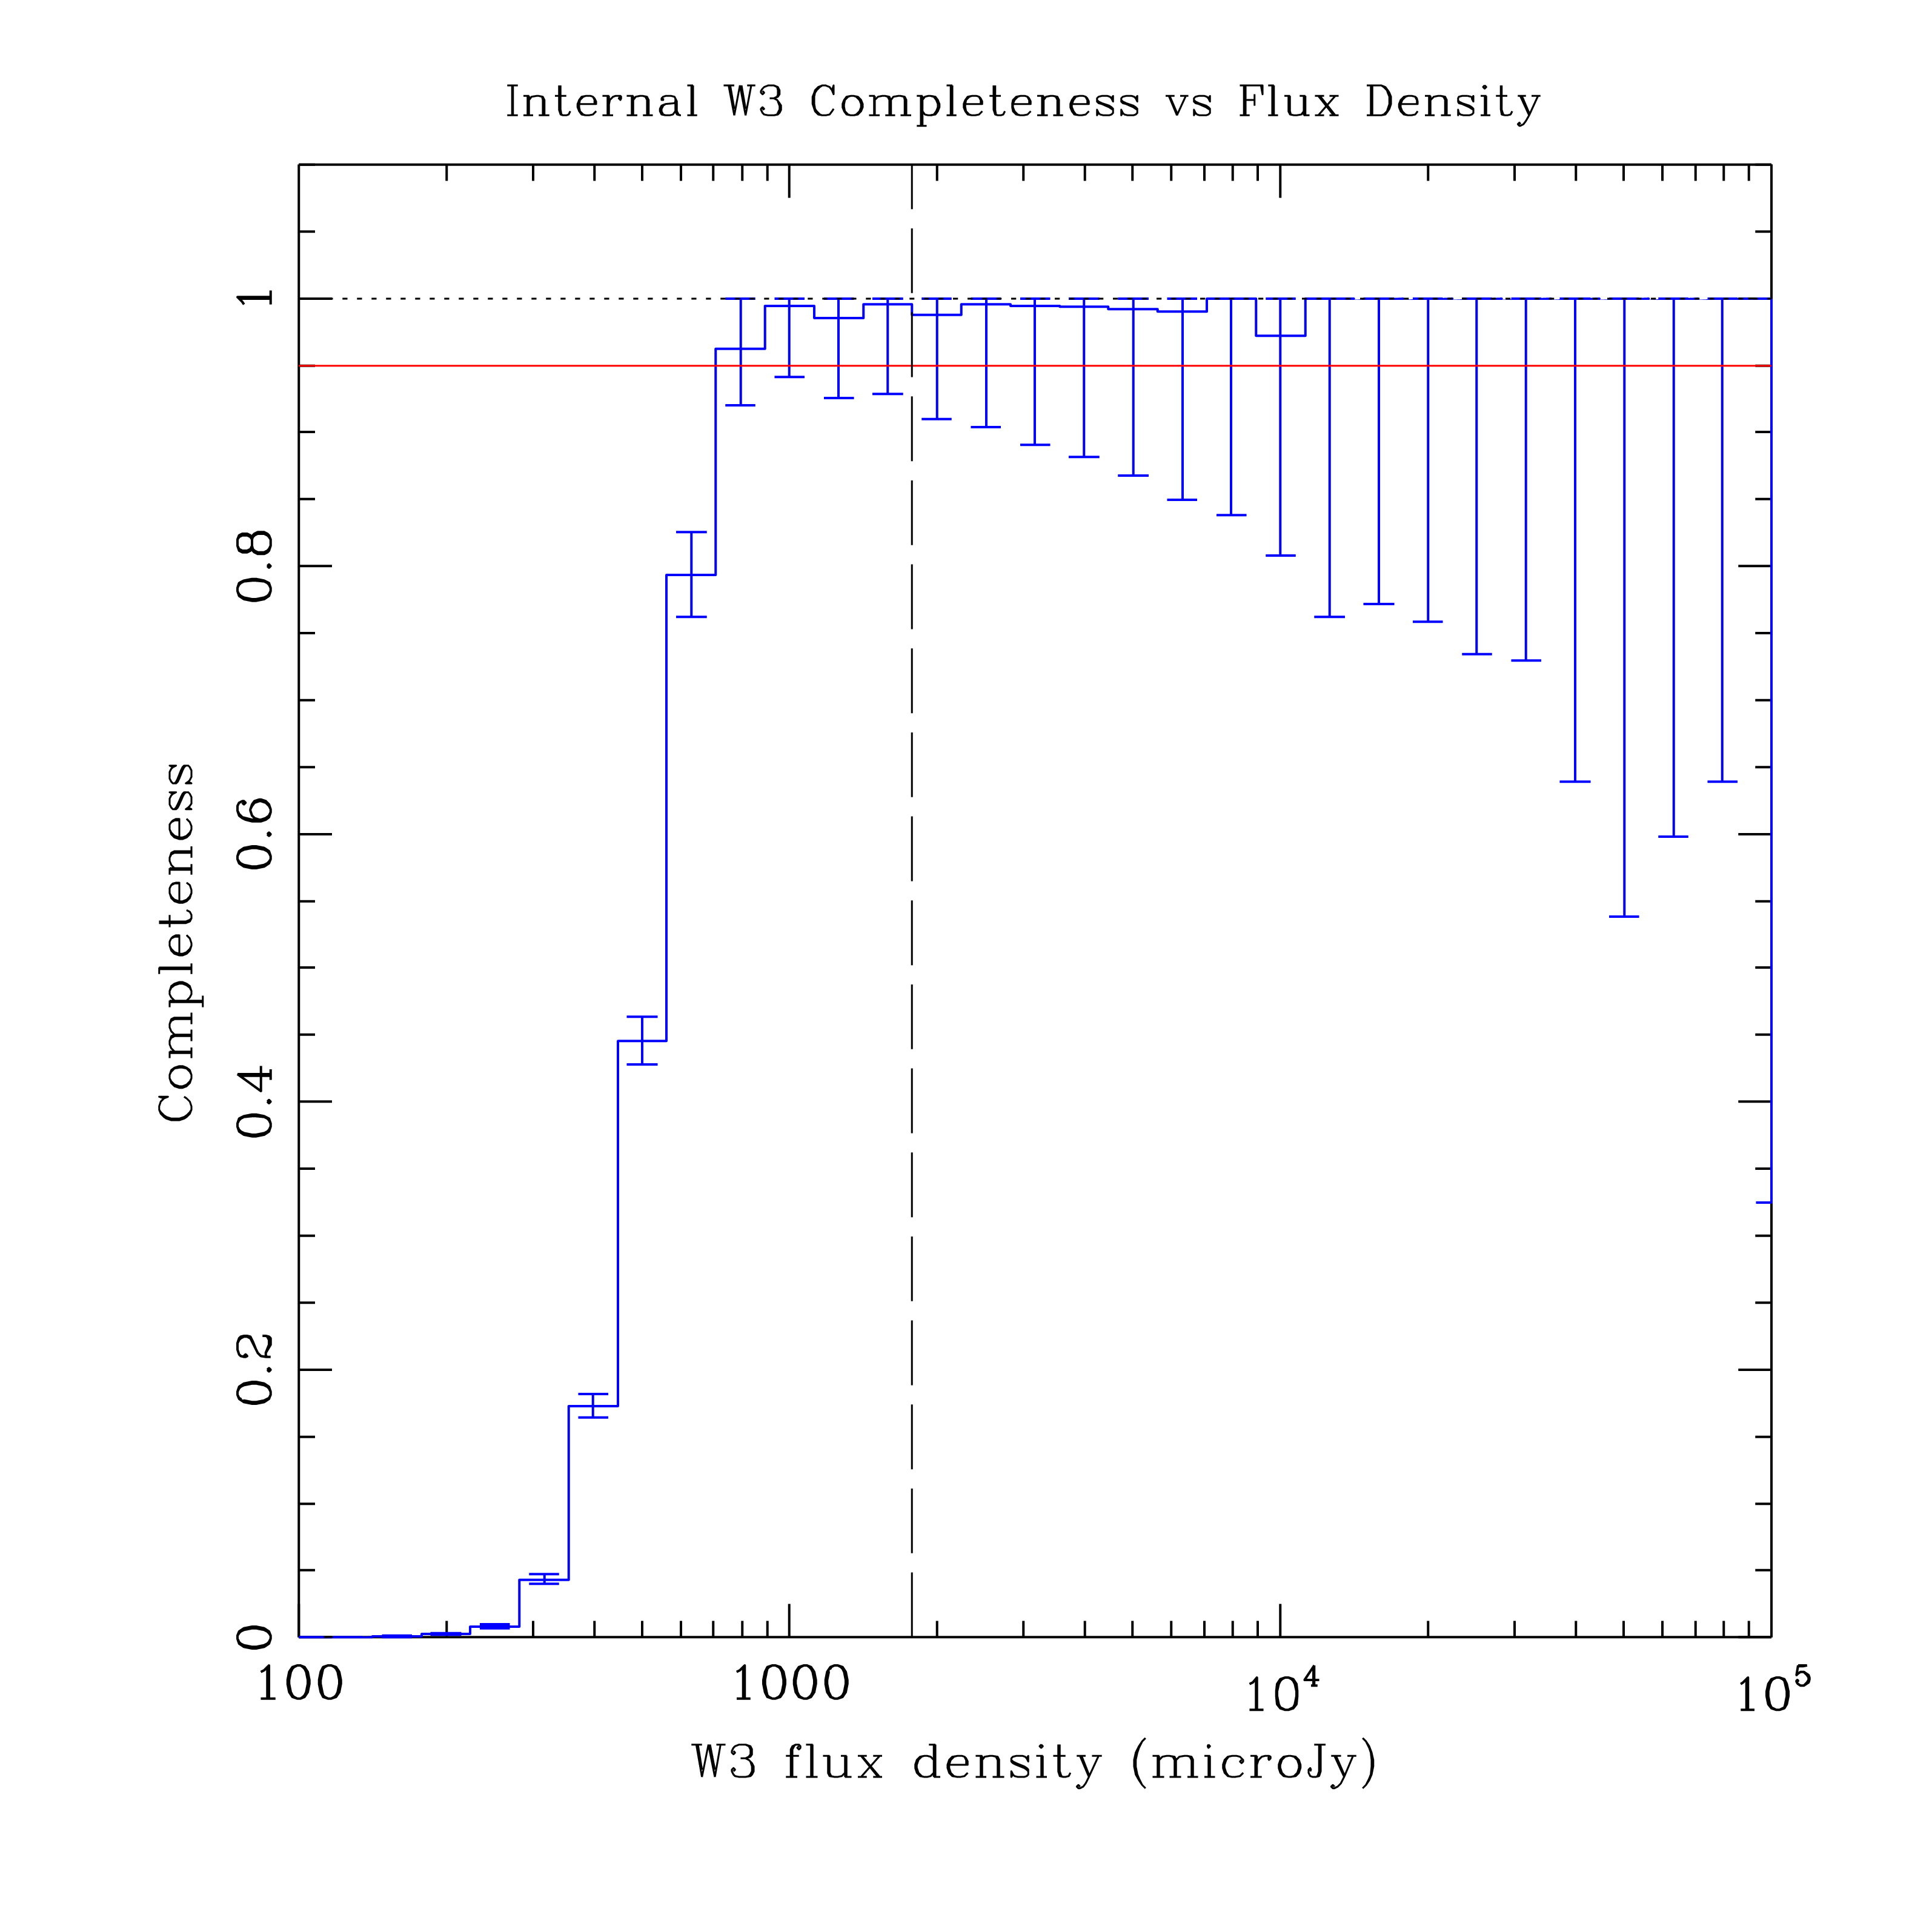
For these tiles, special processing was carried out by the WSDC, using the same reduction software used to produce the Preliminary Release Catalog, to produce coadds of subsets of the frames obtained in each tile during the many passes made by WISE during its mission. The median and maximum frame depths of these coadds are listed in the table below. For the internal test fields we have determined that a SNR = 20 is reached at flux densities of 175, 320, 2550, and 21760 microJy in W1, W2, W3, and W4, respectively (= 15.6, 14.3, 10.2 and 6.5 mag) for a frame depth of 16, corresponding to the median coverage over the whole sky.
| Name | Median Depth (frames) | Maximum Depth (frames) |
|---|---|---|
| NM10 | 16 | 30 |
| NMA12 | 12 | 26 |
| NMA06 | 30 | 52 |
| NMA03 | 50 | 95 |
| NMA02 | 90 | 168 |
We use the full depth coadd as the "truth" set against which the catalogs at shallower depths are compared to determine the completeness. Because the median depth of coverage is about 16 frames in the Final Release, the completeness results for the 16-frame coadds should provide a reasonable approximation to the typical completeness for the survey. However, users are cautioned that the actual completeness at any one position on the sky will also depend on the local source density as well as the actual coverage.
The catalogs for each coadded image were generated in exactly the same way that the Final Release Catalog was produced, with the same selection criteria (in particular w?snr > 5, w?cov > 4, and ccflags!=DHOP). This means that there are a large number of catalog entries for which the only real detections occur in W1 and W2, and for which the information in W3 and W4 is based on upper limits. Therefore we have followed the procedure described below when calculating completeness fractions. This procedure was designed to attempt to produce meaningful completeness information particularly for W3 and W4. The procedure was carried for each coadd depth (median levels of 12, 16, 30, 50, and 90 frames, on average). The catalog which is being tested for completeness is referred to below as the target catalog.
This procedure is repeated, independently, for each band to determine the completeness for that band.
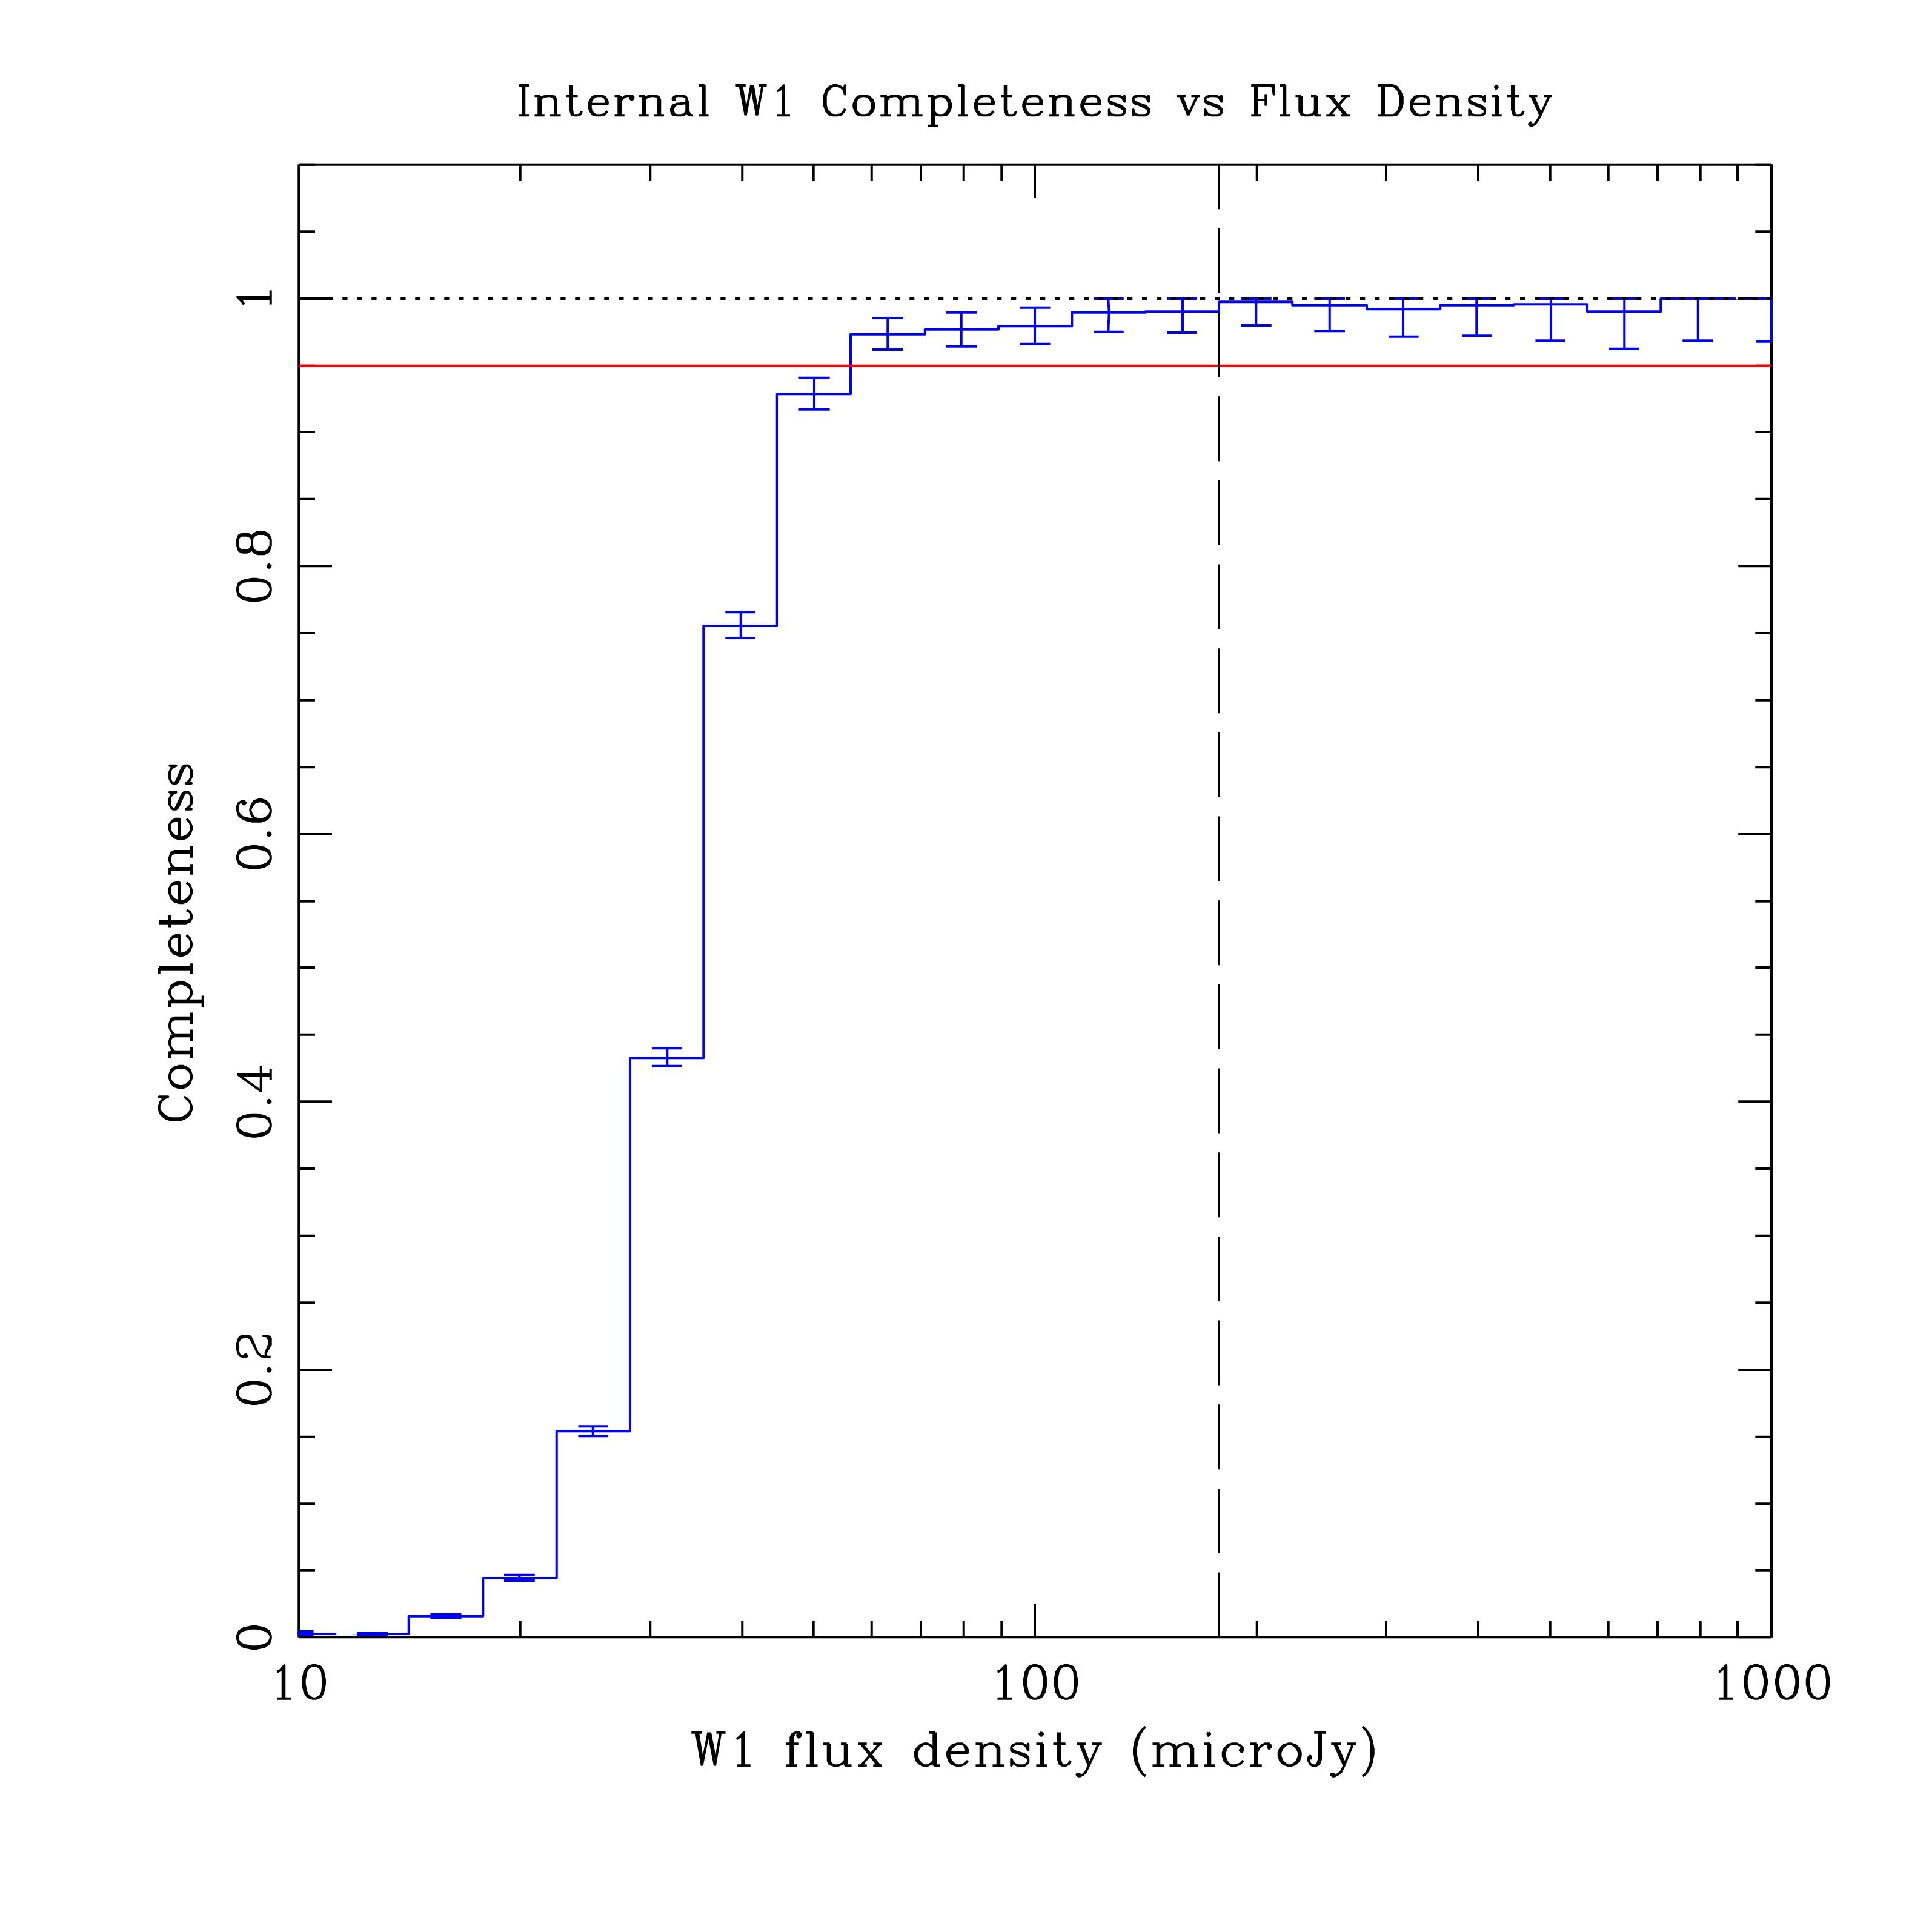
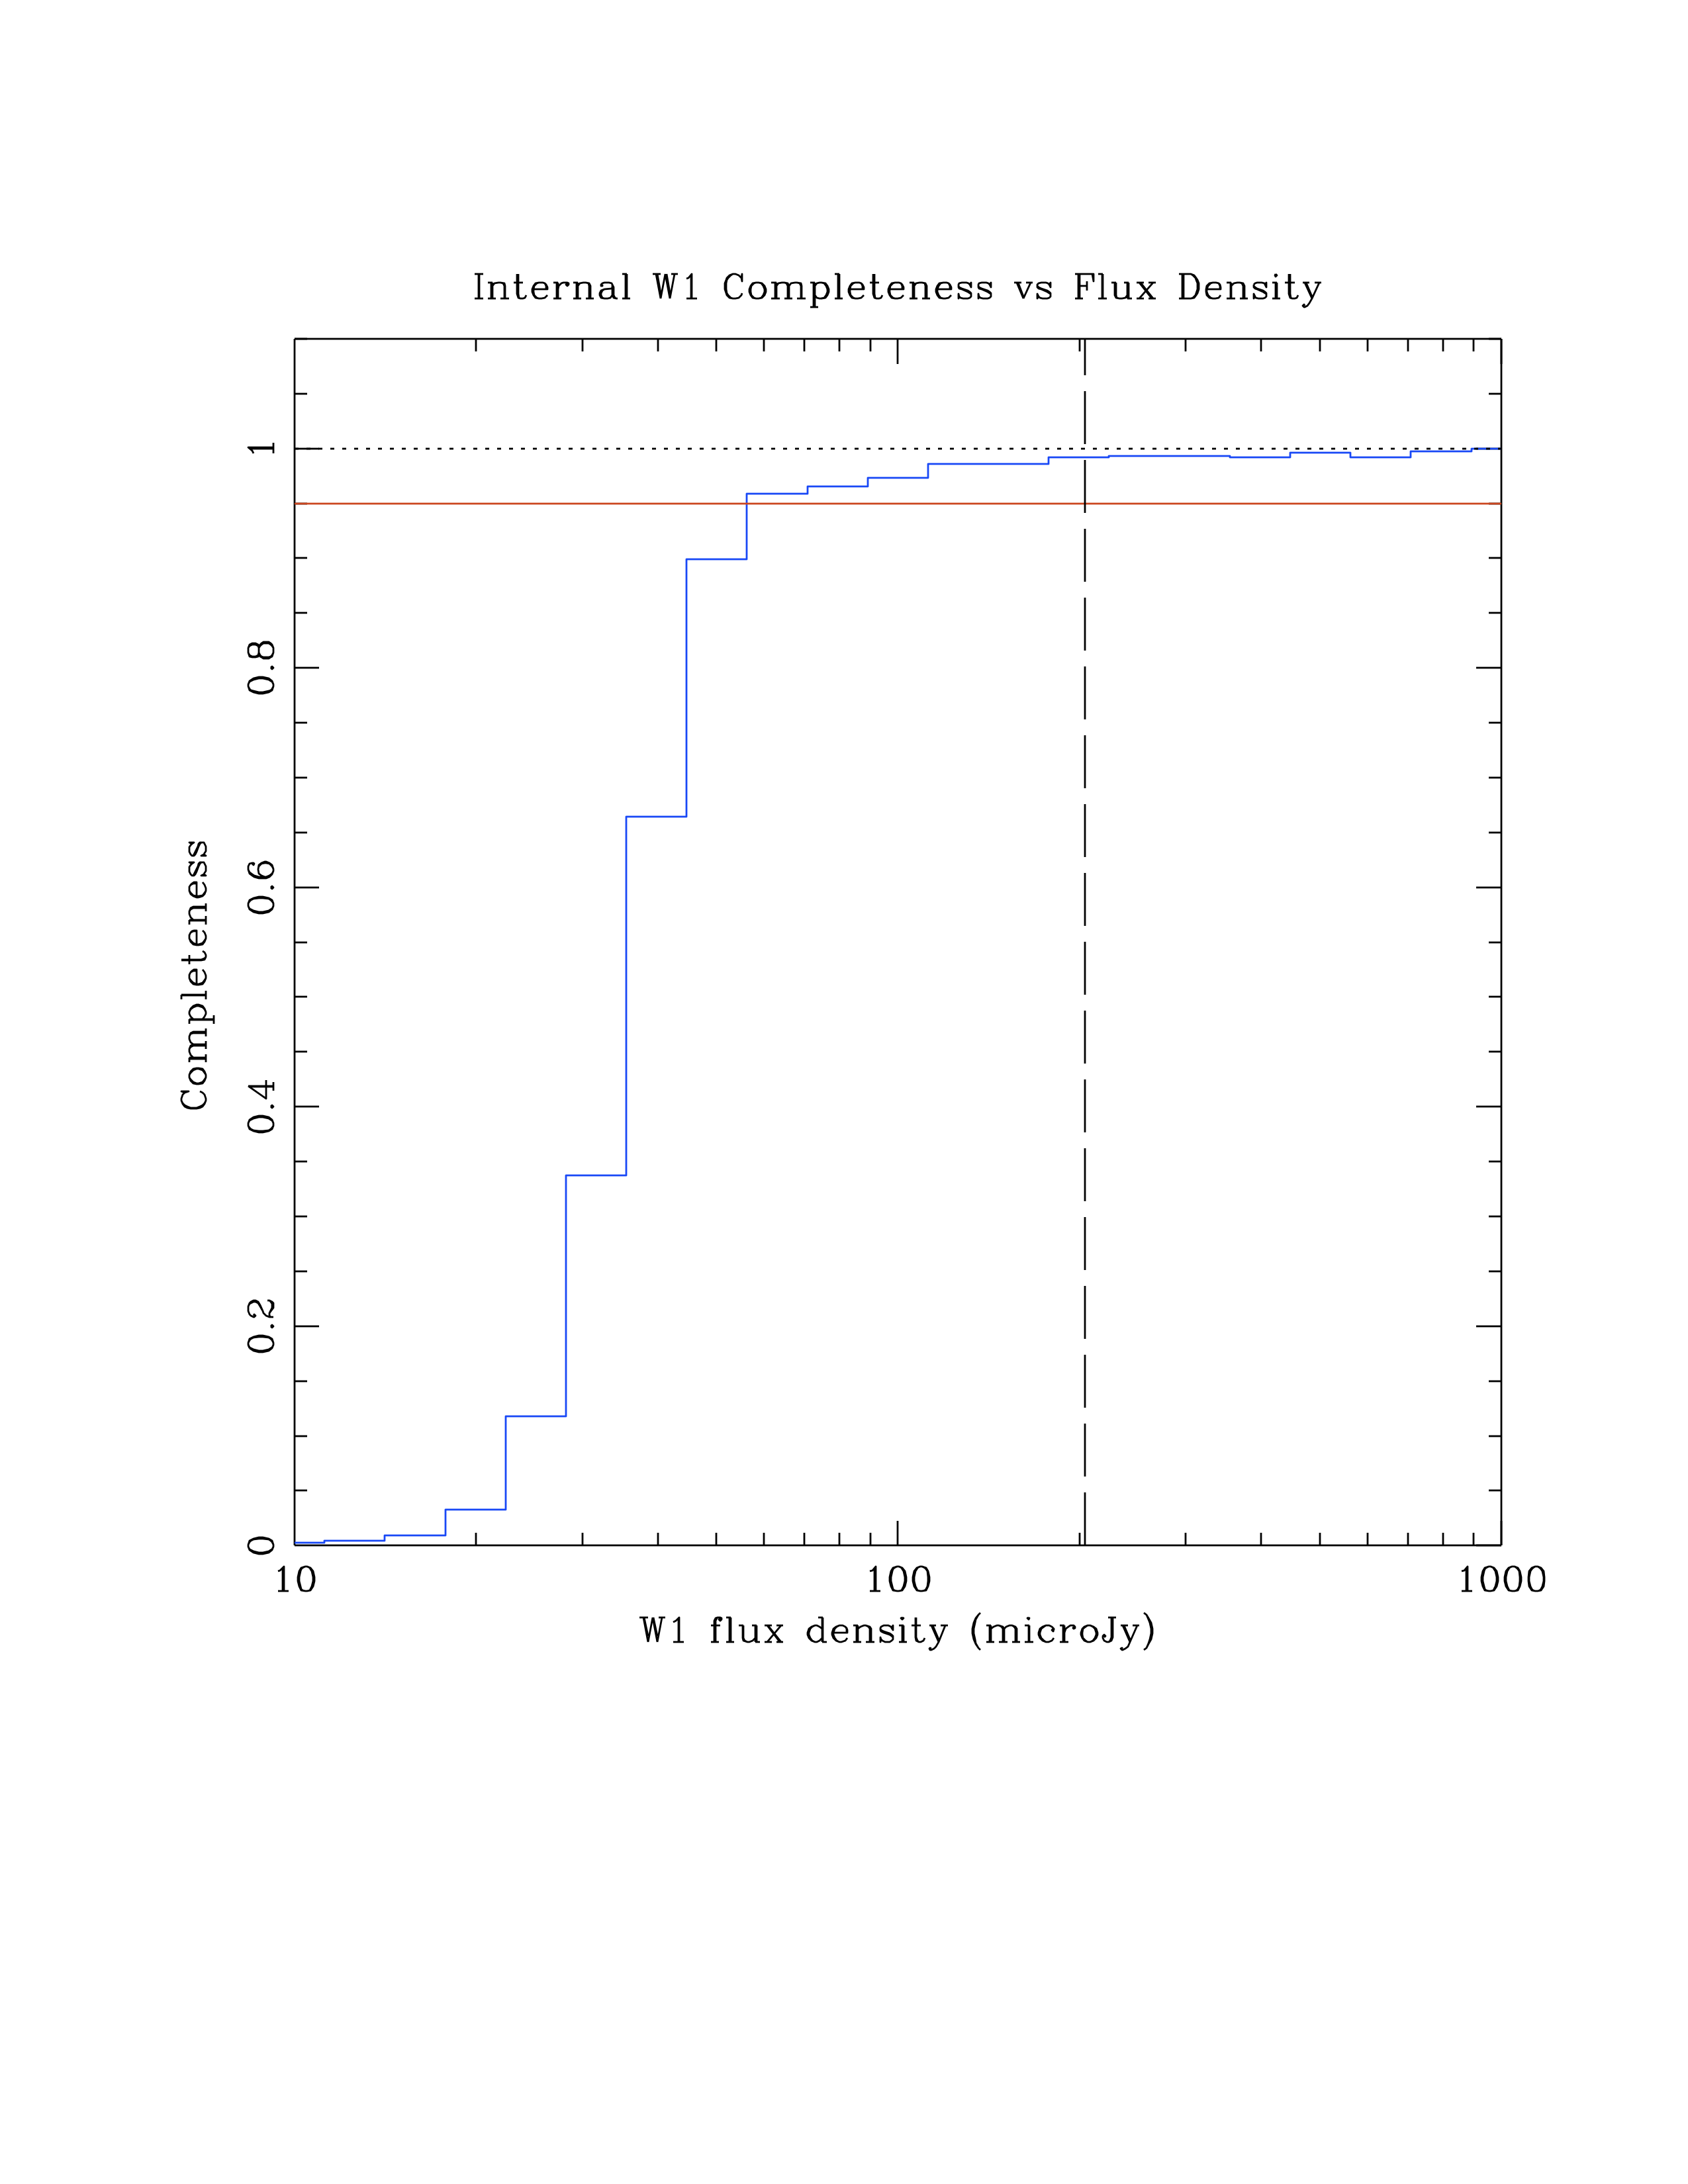
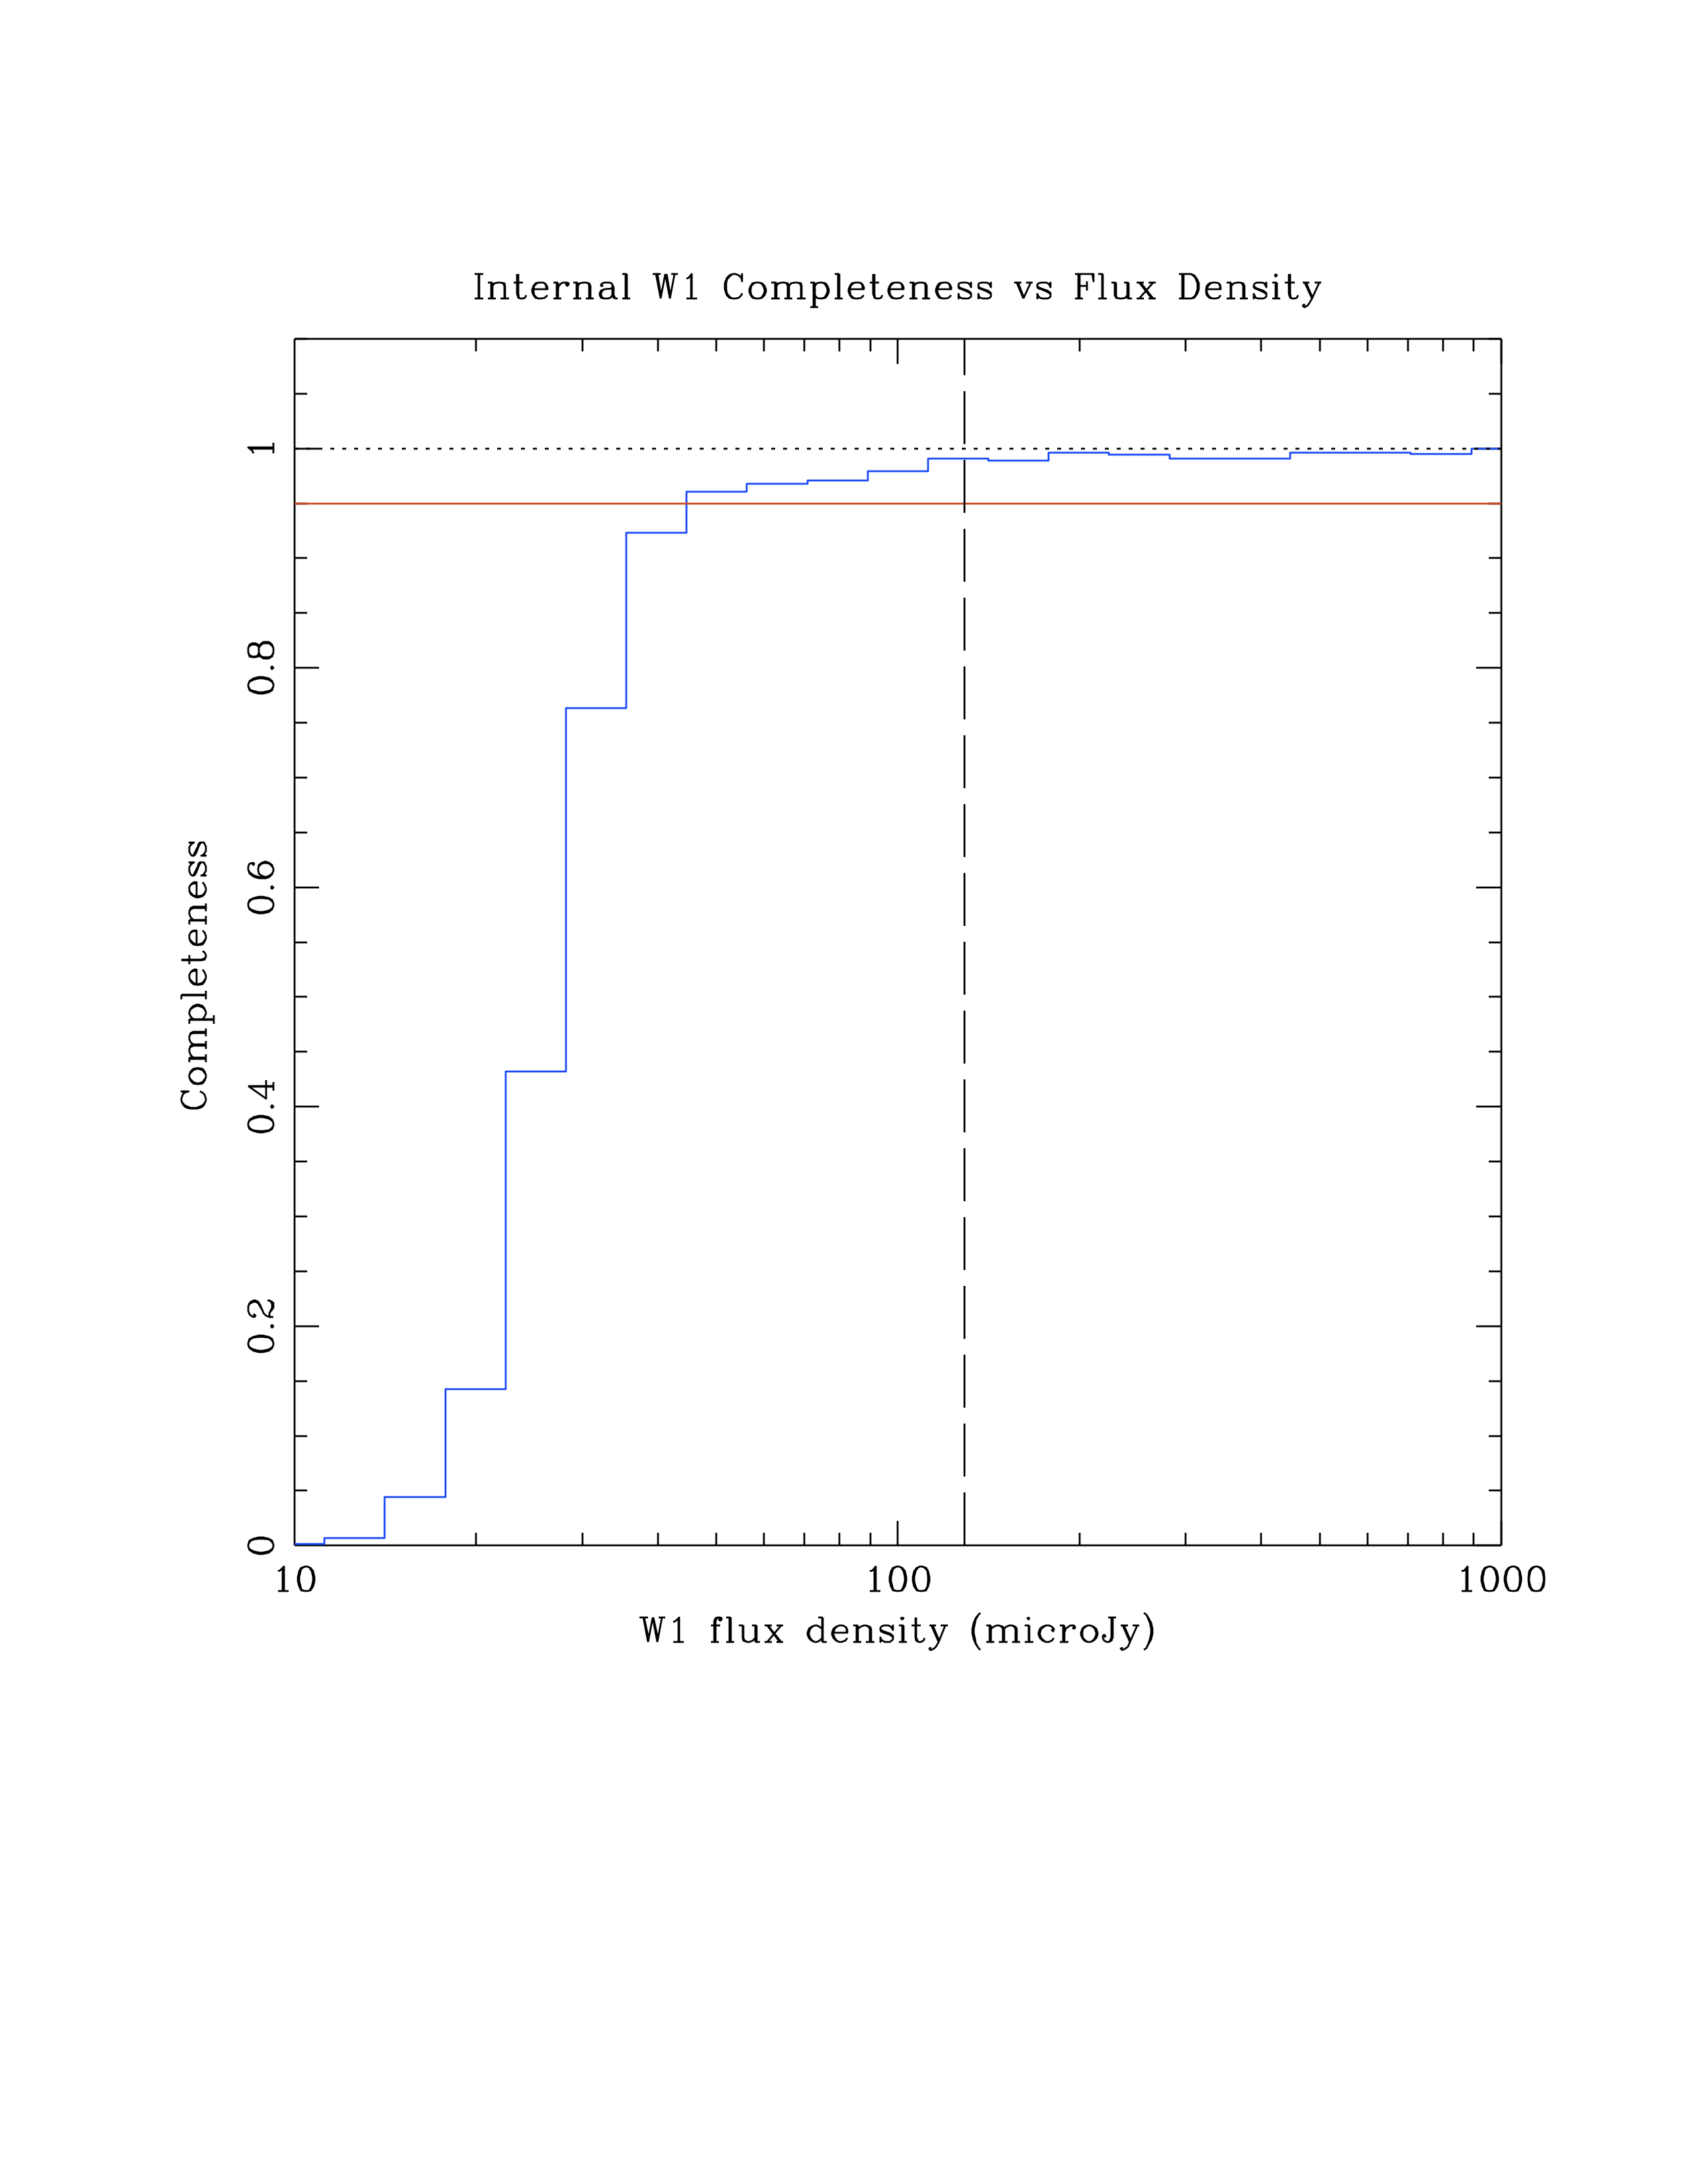
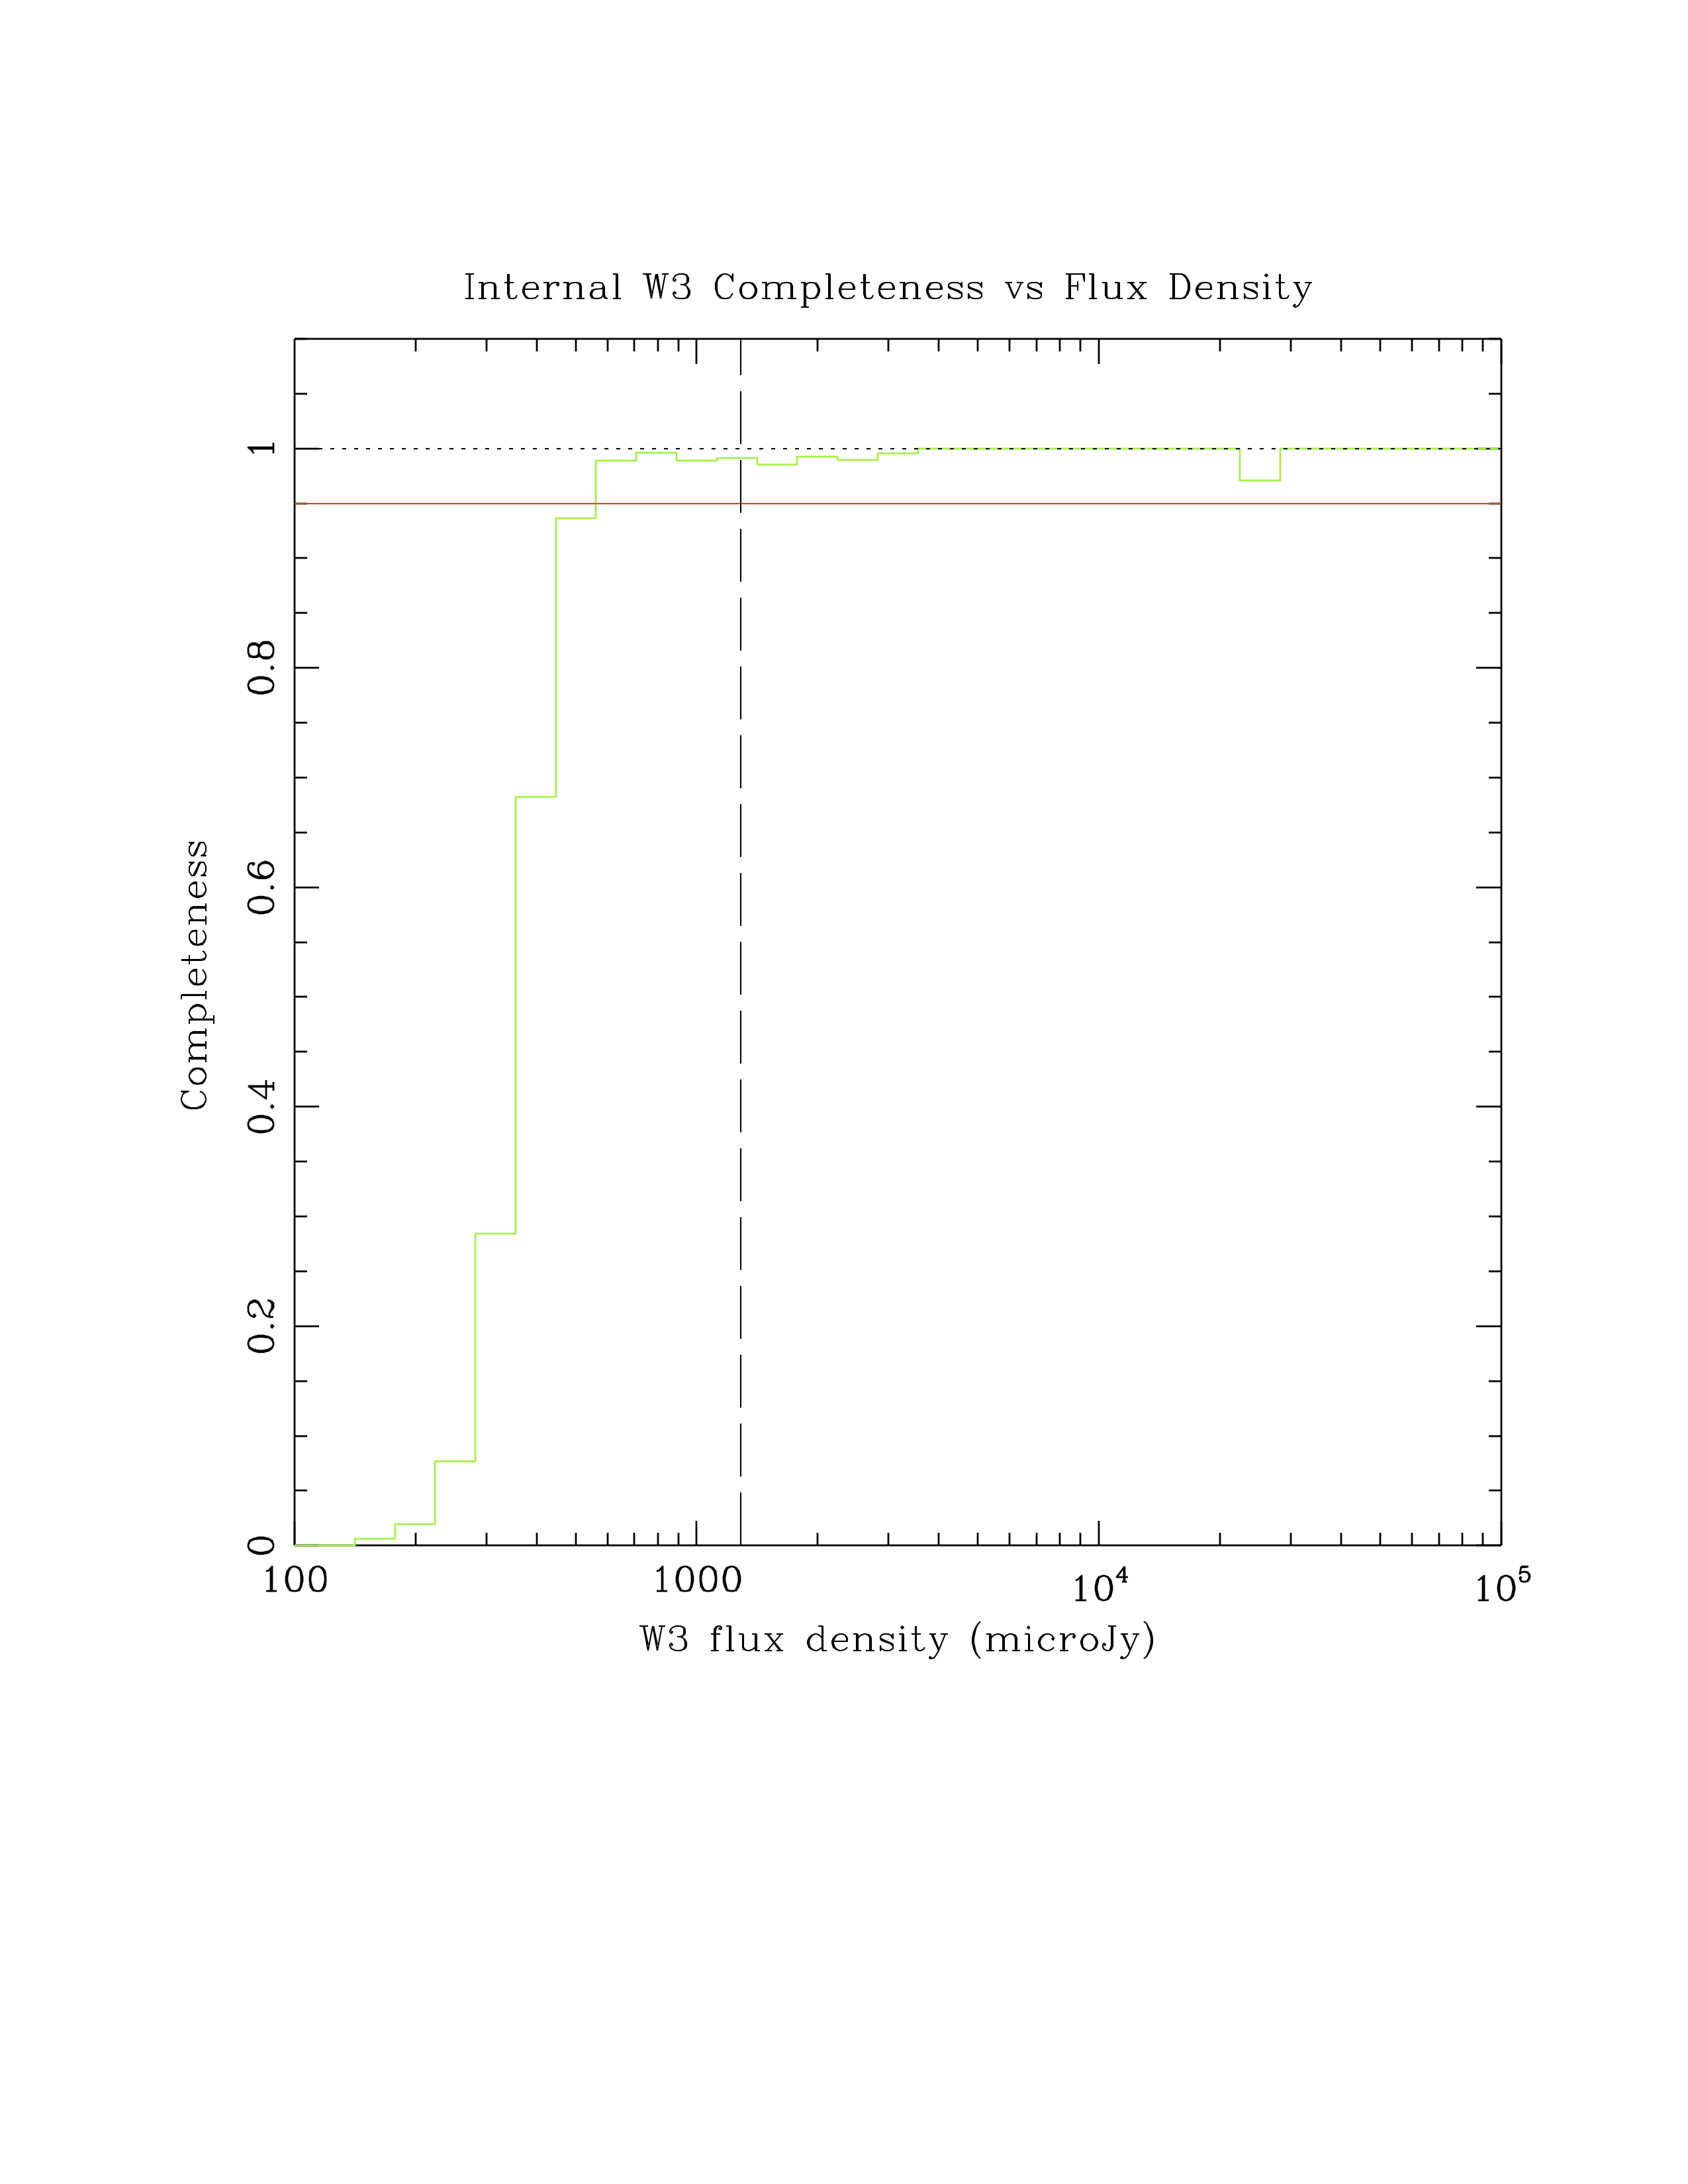
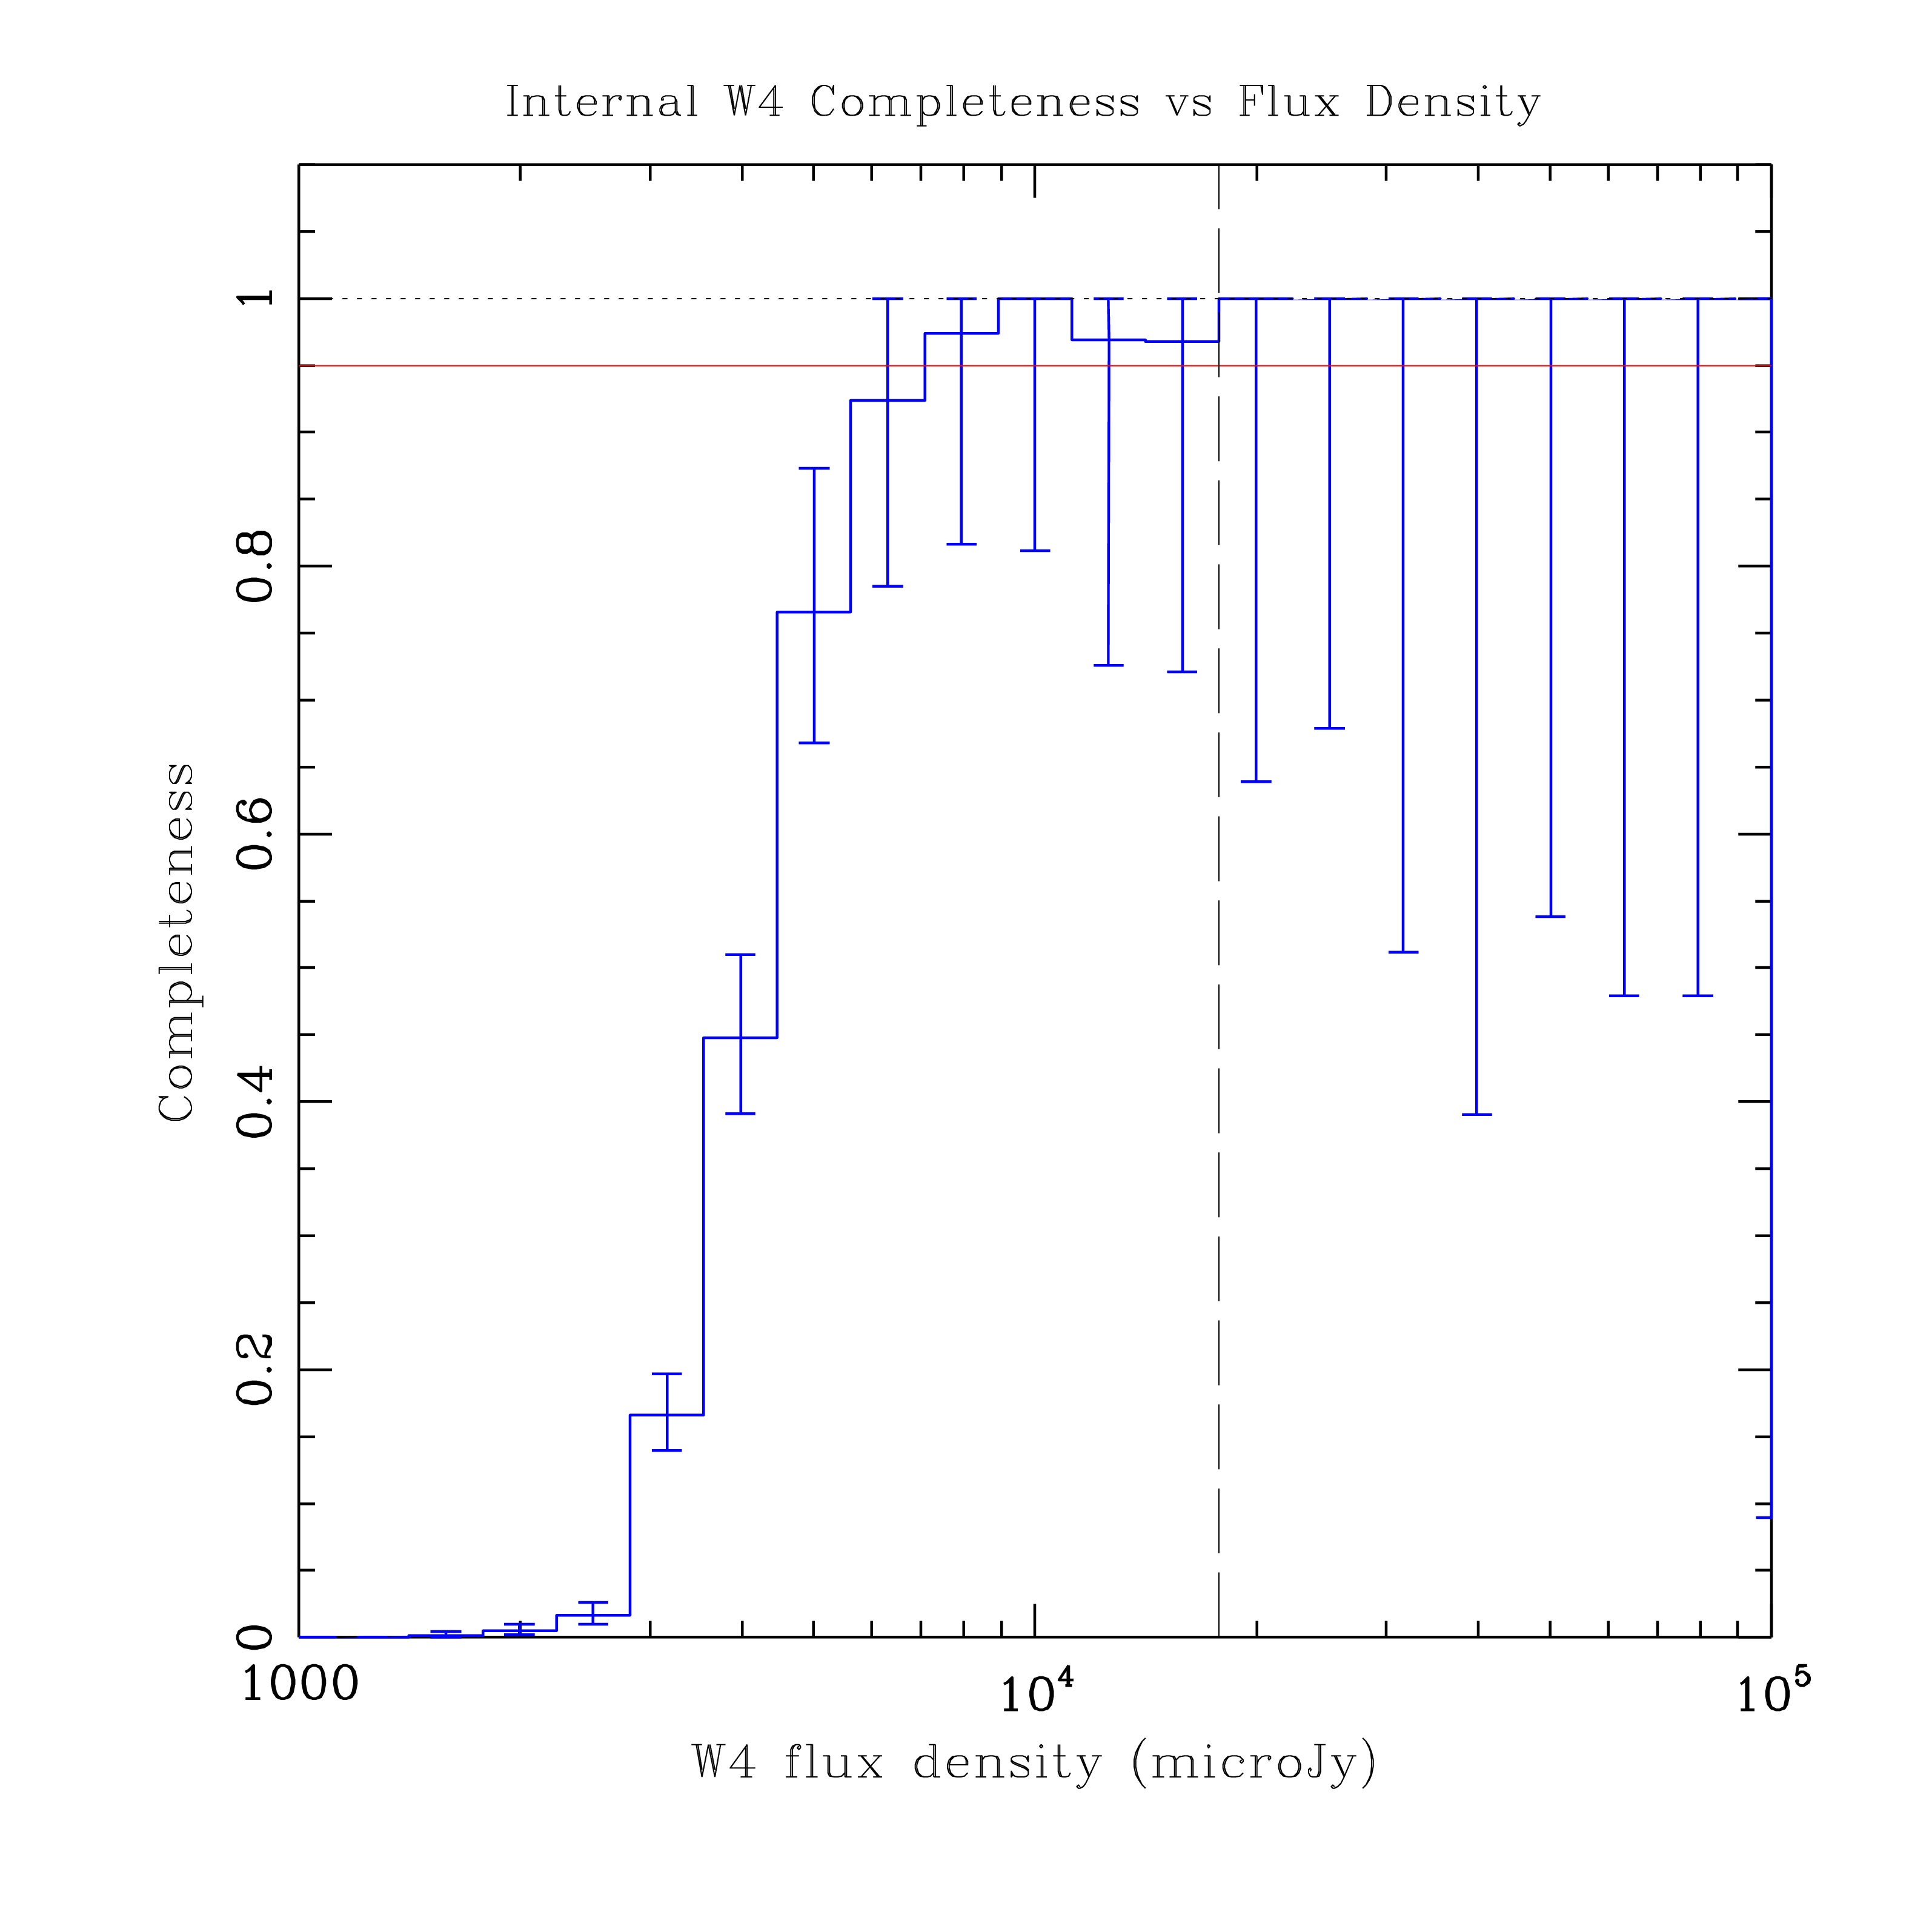
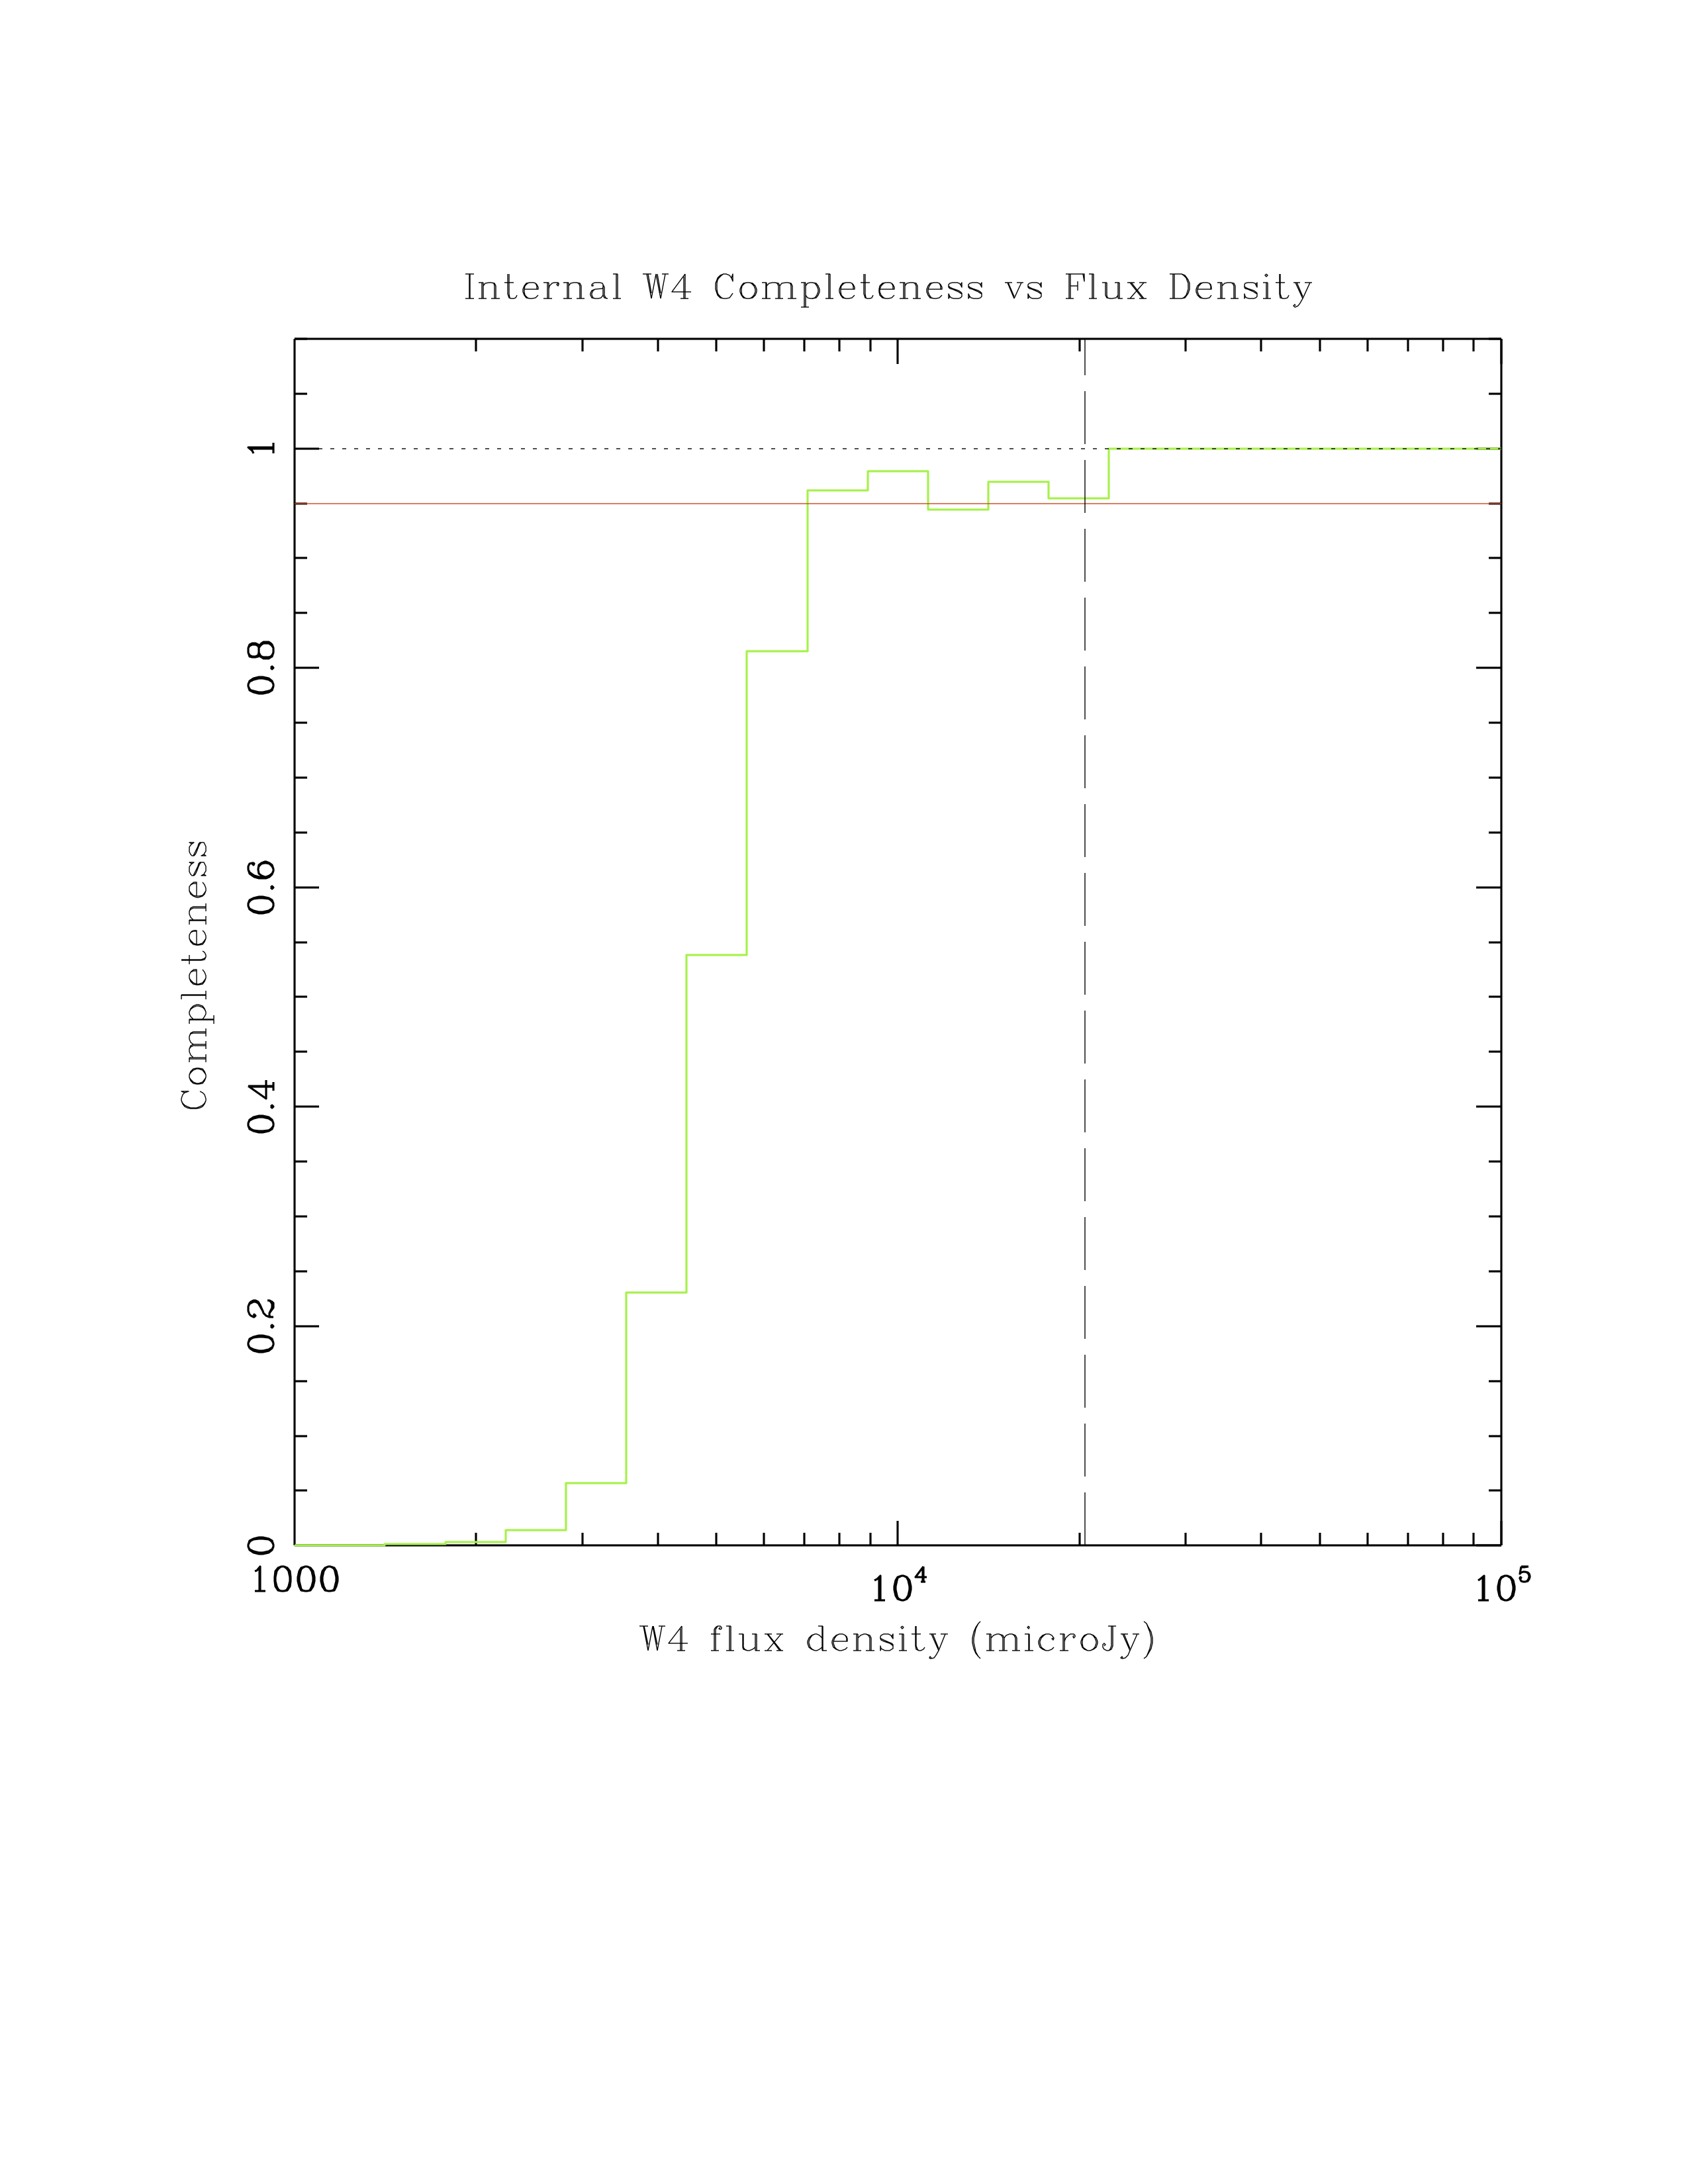
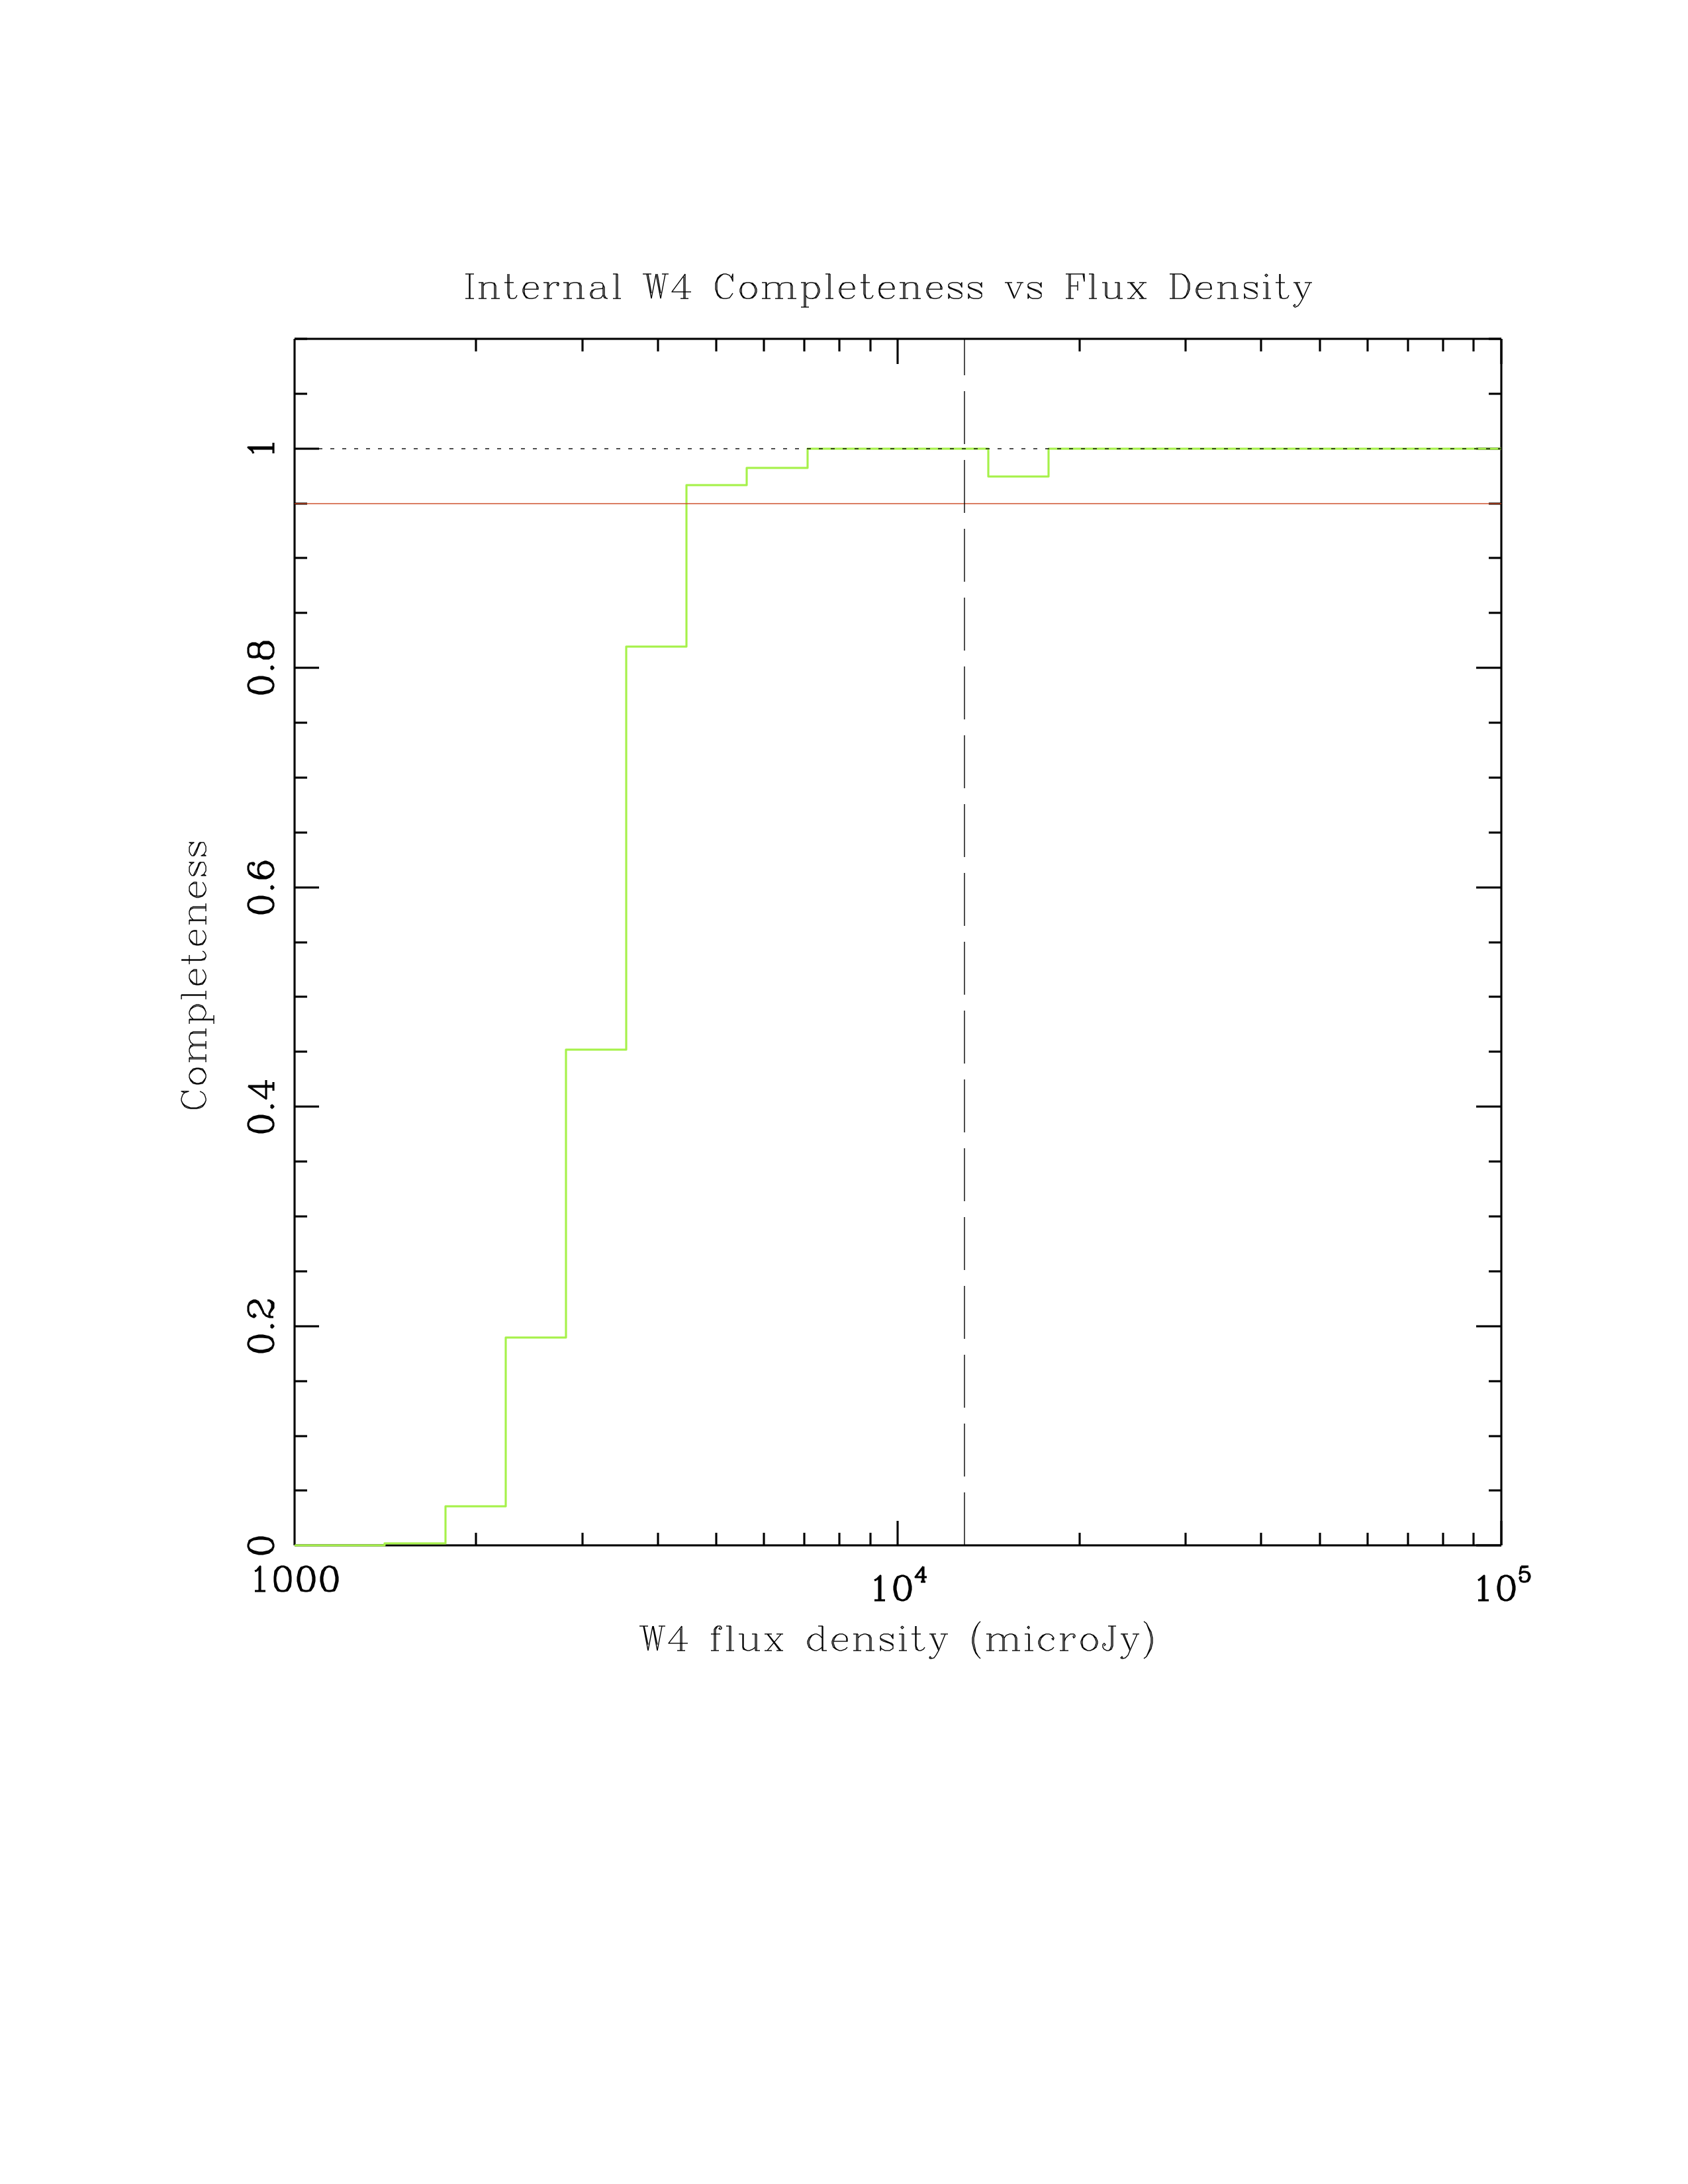
The results of the tests described above are shown, averaged over all 6 polar tiles, in the following figures. For each band we show plots of the differential completeness as a function of flux density. In each case, we show the results for the median depth, as well as for the other coadd depths to illustrate the range for the mast majority of the area covered by the final data release.
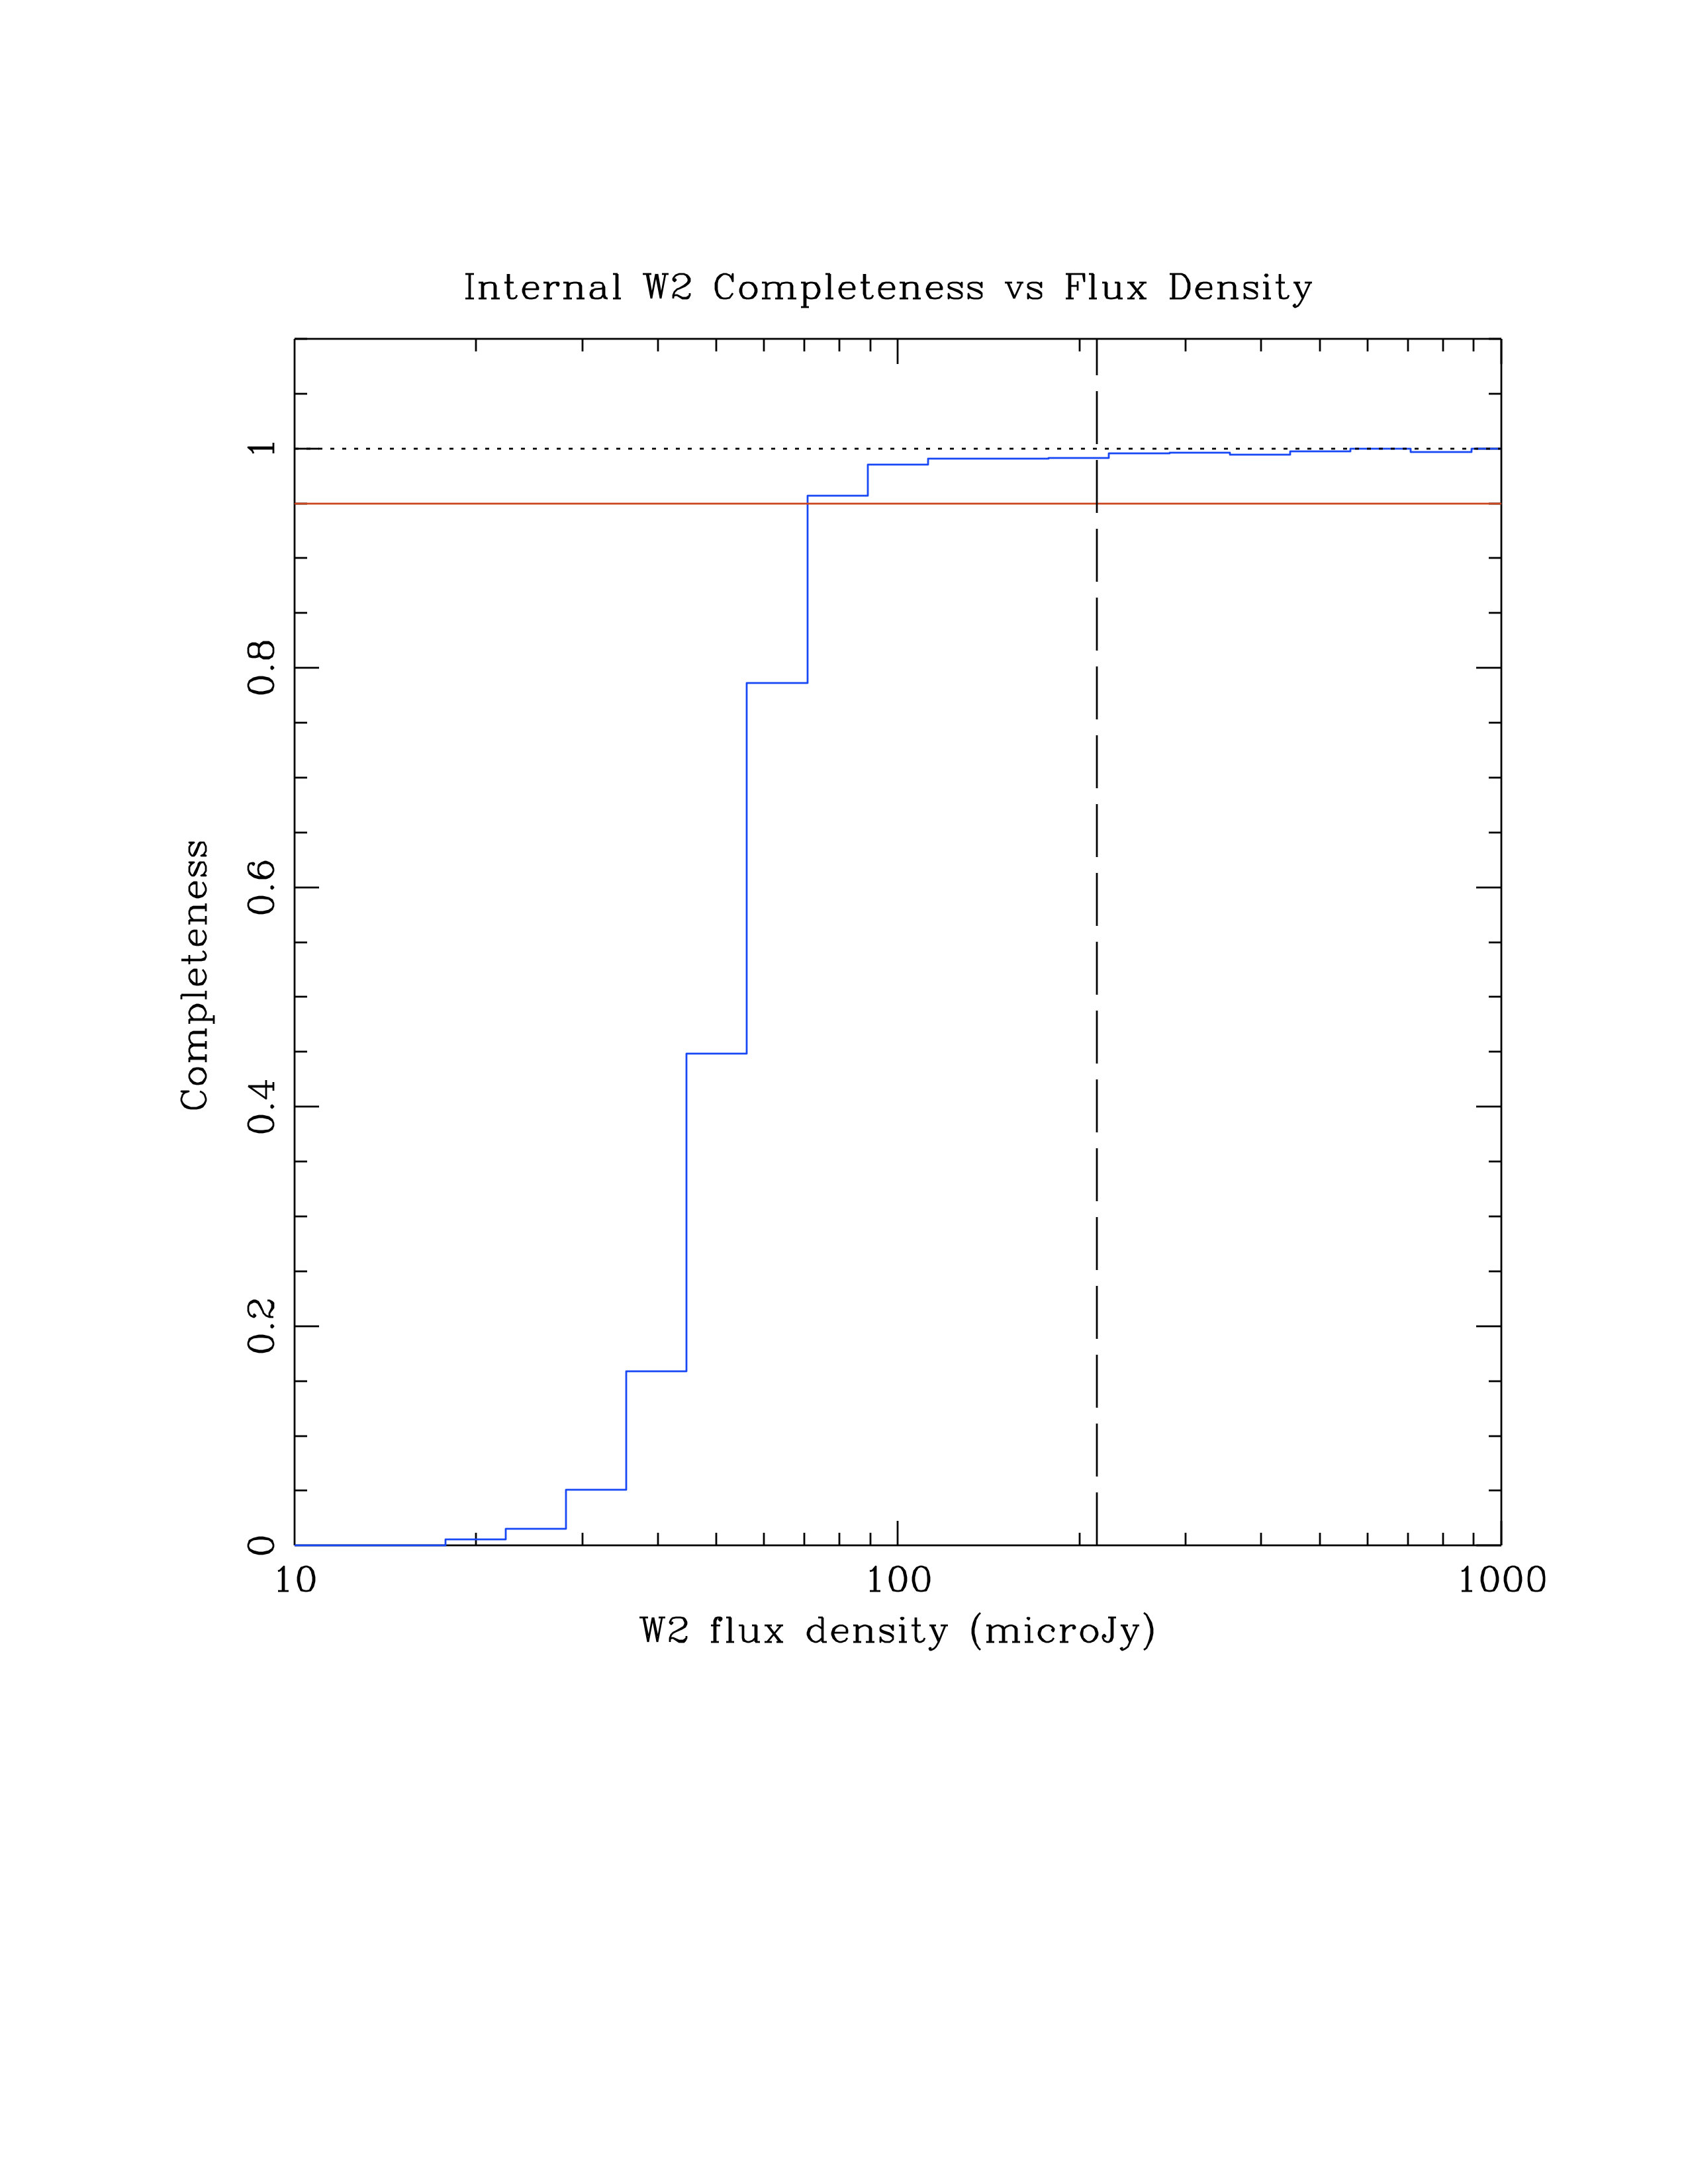
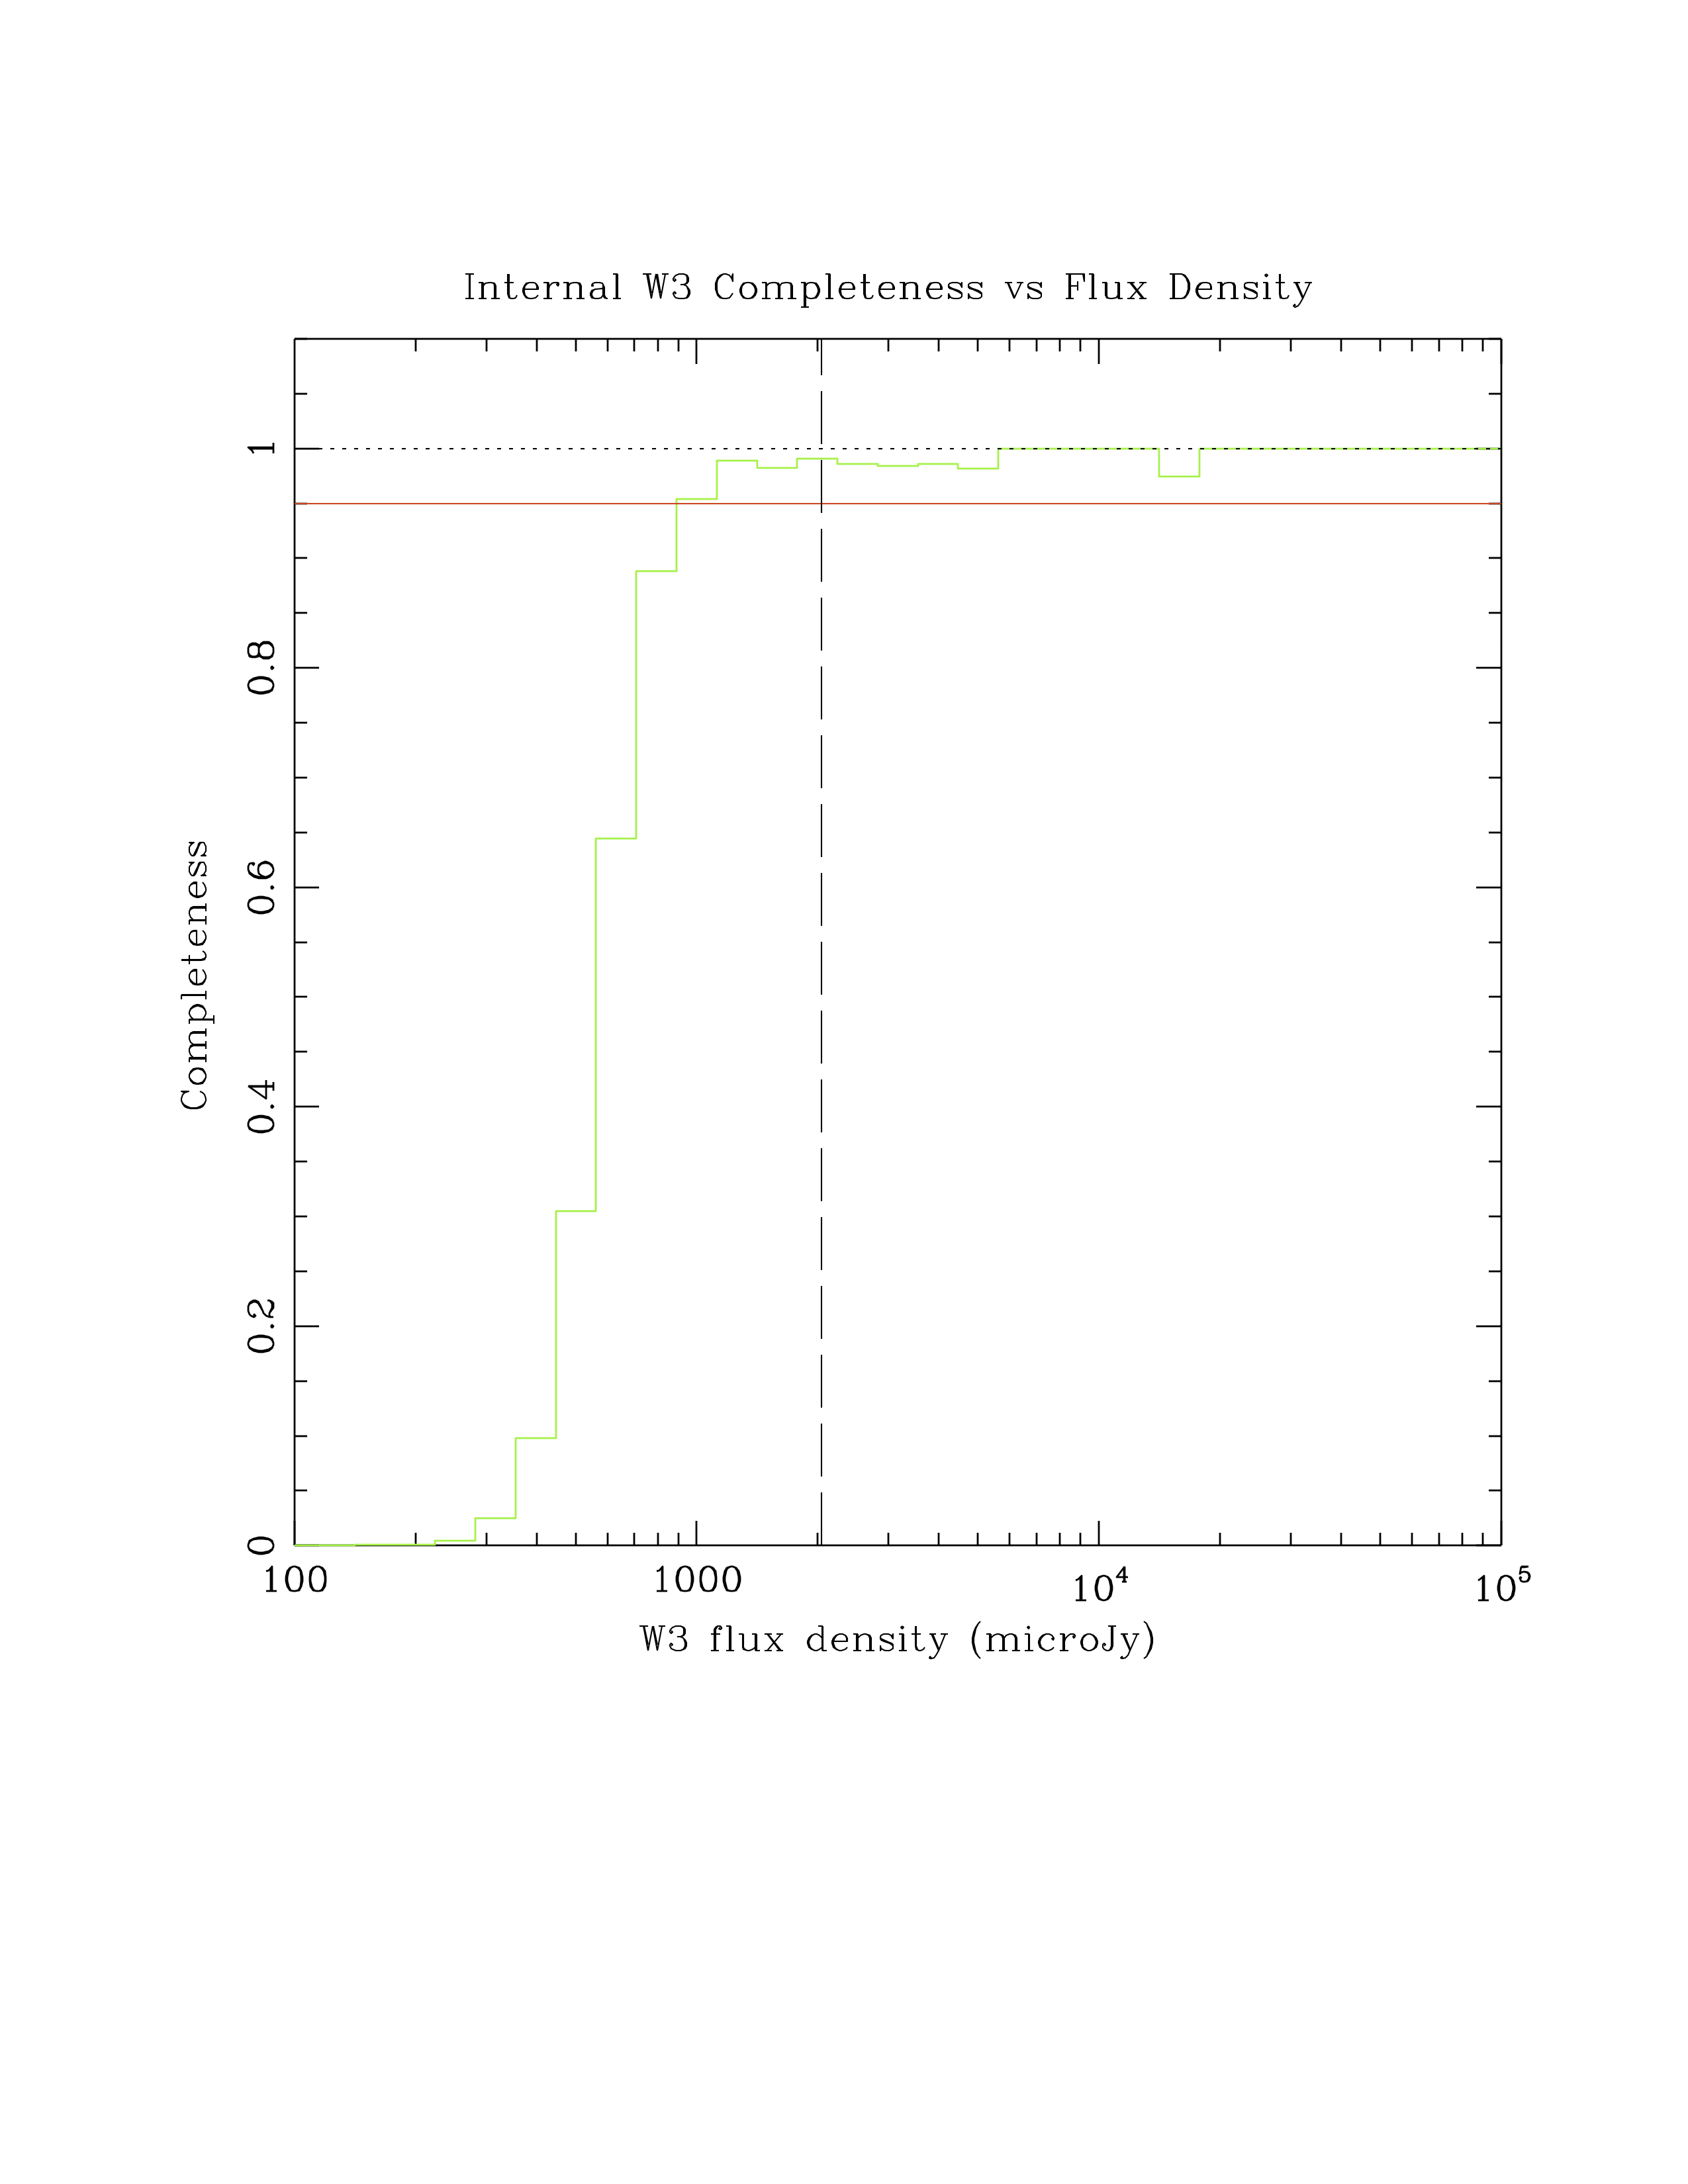
As seen in the plots, the Level 1 requirement is met by the median depth data (the 16-frame depth curves) in all 4 bands. Table 3 provides the flux density levels for the 95% completeness levels in the four bands. These completeness levels are appropriate for the source densities of high Galactic latitude areas. The dependence of the completeness on coverage, illustrated by the other curves in the plots, is as expected: the completeness is higher at lower flux densities when the coverage is deeper.
| Band | Flux Density (milli-Jy) |
|---|---|
| W1 | 0.055 |
| W2 | 0.110 |
| W3 | 0.7 |
| W4 | 7.0 |
 |
 |
 |
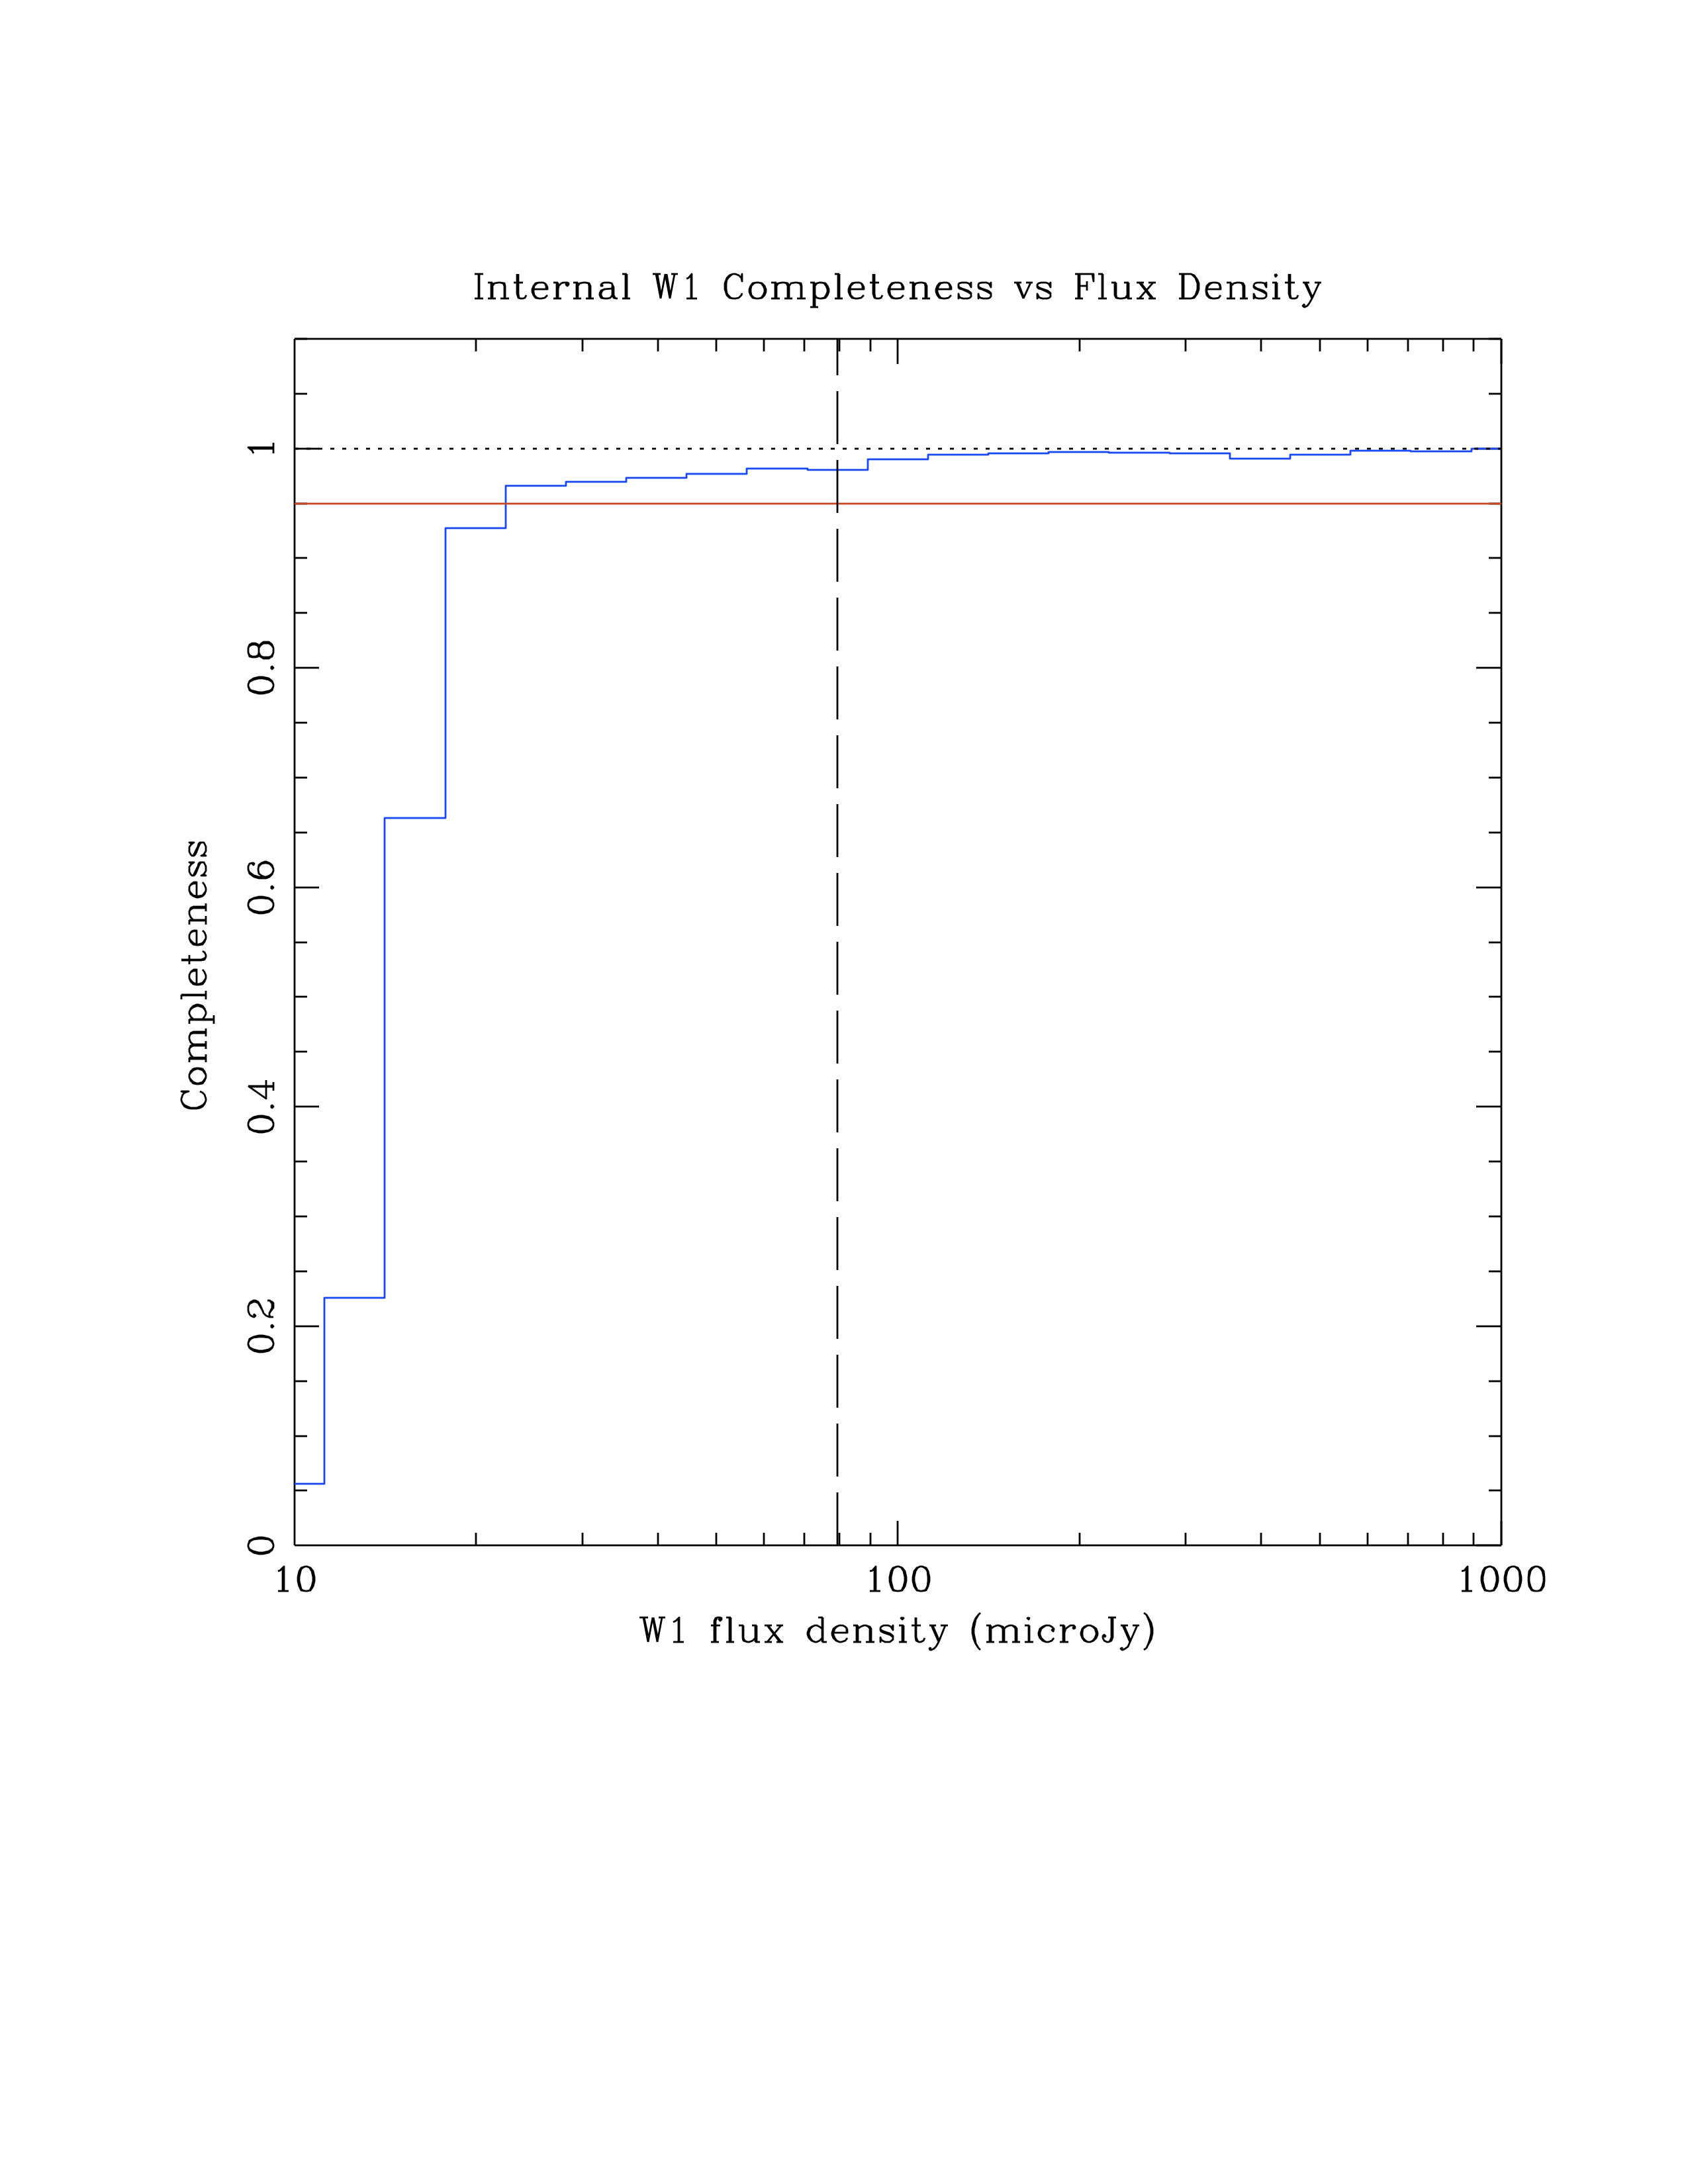 |
| Figure 1a - Completeness in W1 as a function of W1 flux density for depth=16 frames. The vertical dashed line shows SNR=20, and the horizontal red line is at 95% completeness. One sigma errorbars in each flux density bin are shown for this case. | Figure 1b - Completeness in W1 as a function of W1 flux density for depth~12 frames. The vertical dashed line shows SNR=20, and the horizontal red line is at 95% completeness. | Figure 1c - Completeness in W1 as a function of W1 flux density for depth~30 frames. The vertical dashed line shows SNR=20, and the horizontal red line is at 95% completeness. | Figure 1d - Completeness in W1 as a function of W1 flux density for depth~80 frames. The vertical dashed line shows SNR=20, and the horizontal red line is at 95% completeness. |
 |
 |
 |
 |
Figure 2a - Completeness in W2 as a function of W2 flux density for depth=16 frames. The vertical dashed line shows SNR=20, and the horizontal red line is at 95% completeness. One sigma errorbars in each flux density bin are shown for this case. | Figure 2b - Completeness in W2 as a function of W2 flux density for depth~12 frames. The vertical dashed line shows SNR=20, and the horizontal red line is at 95% completeness. | Figure 2c - Completeness in W2 as a function of W2 flux density for depth~30 frames. The vertical dashed line shows SNR=20, and the horizontal red line is at 95% completeness. | Figure 2d - Completeness in W2 as a function of W2 flux density for depth~80 frames. The vertical dashed line shows SNR=20, and the horizontal red line is at 95% completeness. |
 |
 |
 |
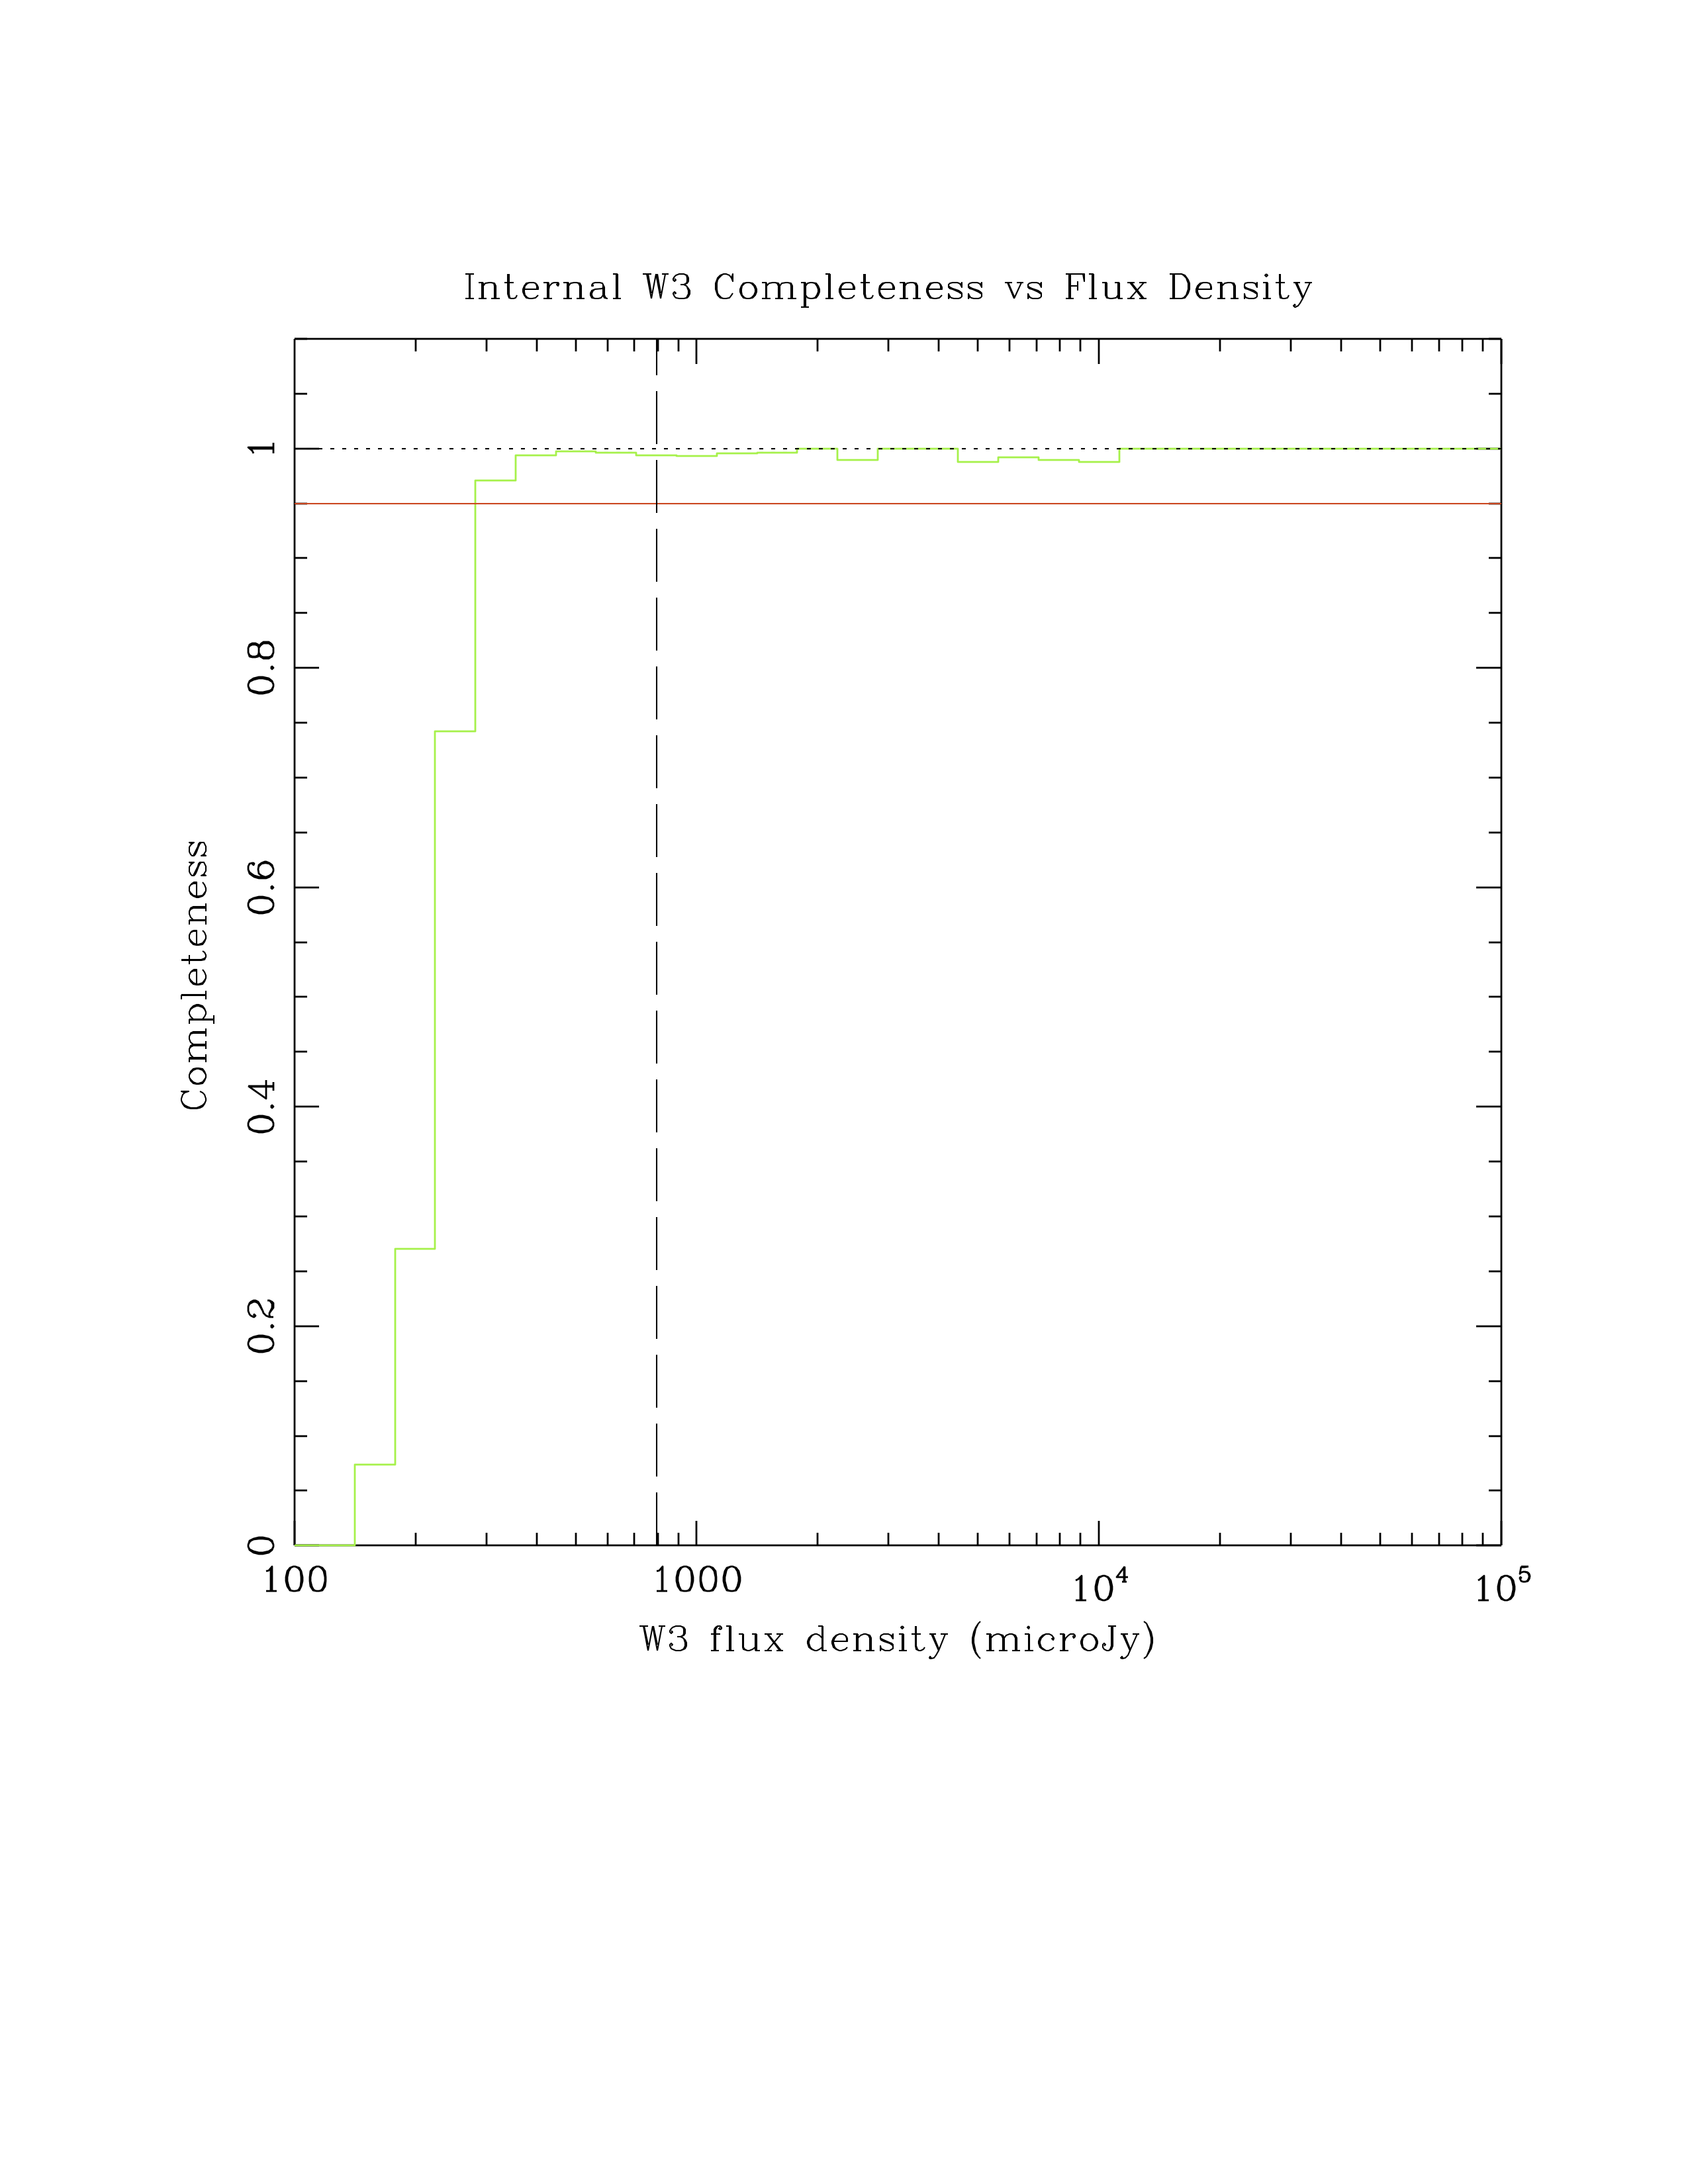 |
| Figure 3a - Completeness in W3 as a function of W3 flux density for depth=16 frames. The vertical dashed line shows SNR=20, and the horizontal red line is at 95% completeness. One sigma errorbars in each flux density bin are shown for this case. | Figure 3b - Completeness in W3 as a function of W3 flux density for depth~12 frames. The vertical dashed line shows SNR=20, and the horizontal red line is at 95% completeness. | Figure 3c - Completeness in W3 as a function of W3 flux density for depth~30 frames. The vertical dashed line shows SNR=20, and the horizontal red line is at 95% completeness. | Figure 3d - Completeness in W3 as a function of W3 flux density for depth~80 frames. The vertical dashed line shows SNR=20, and the horizontal red line is at 95% completeness. |
 |
 |
 |
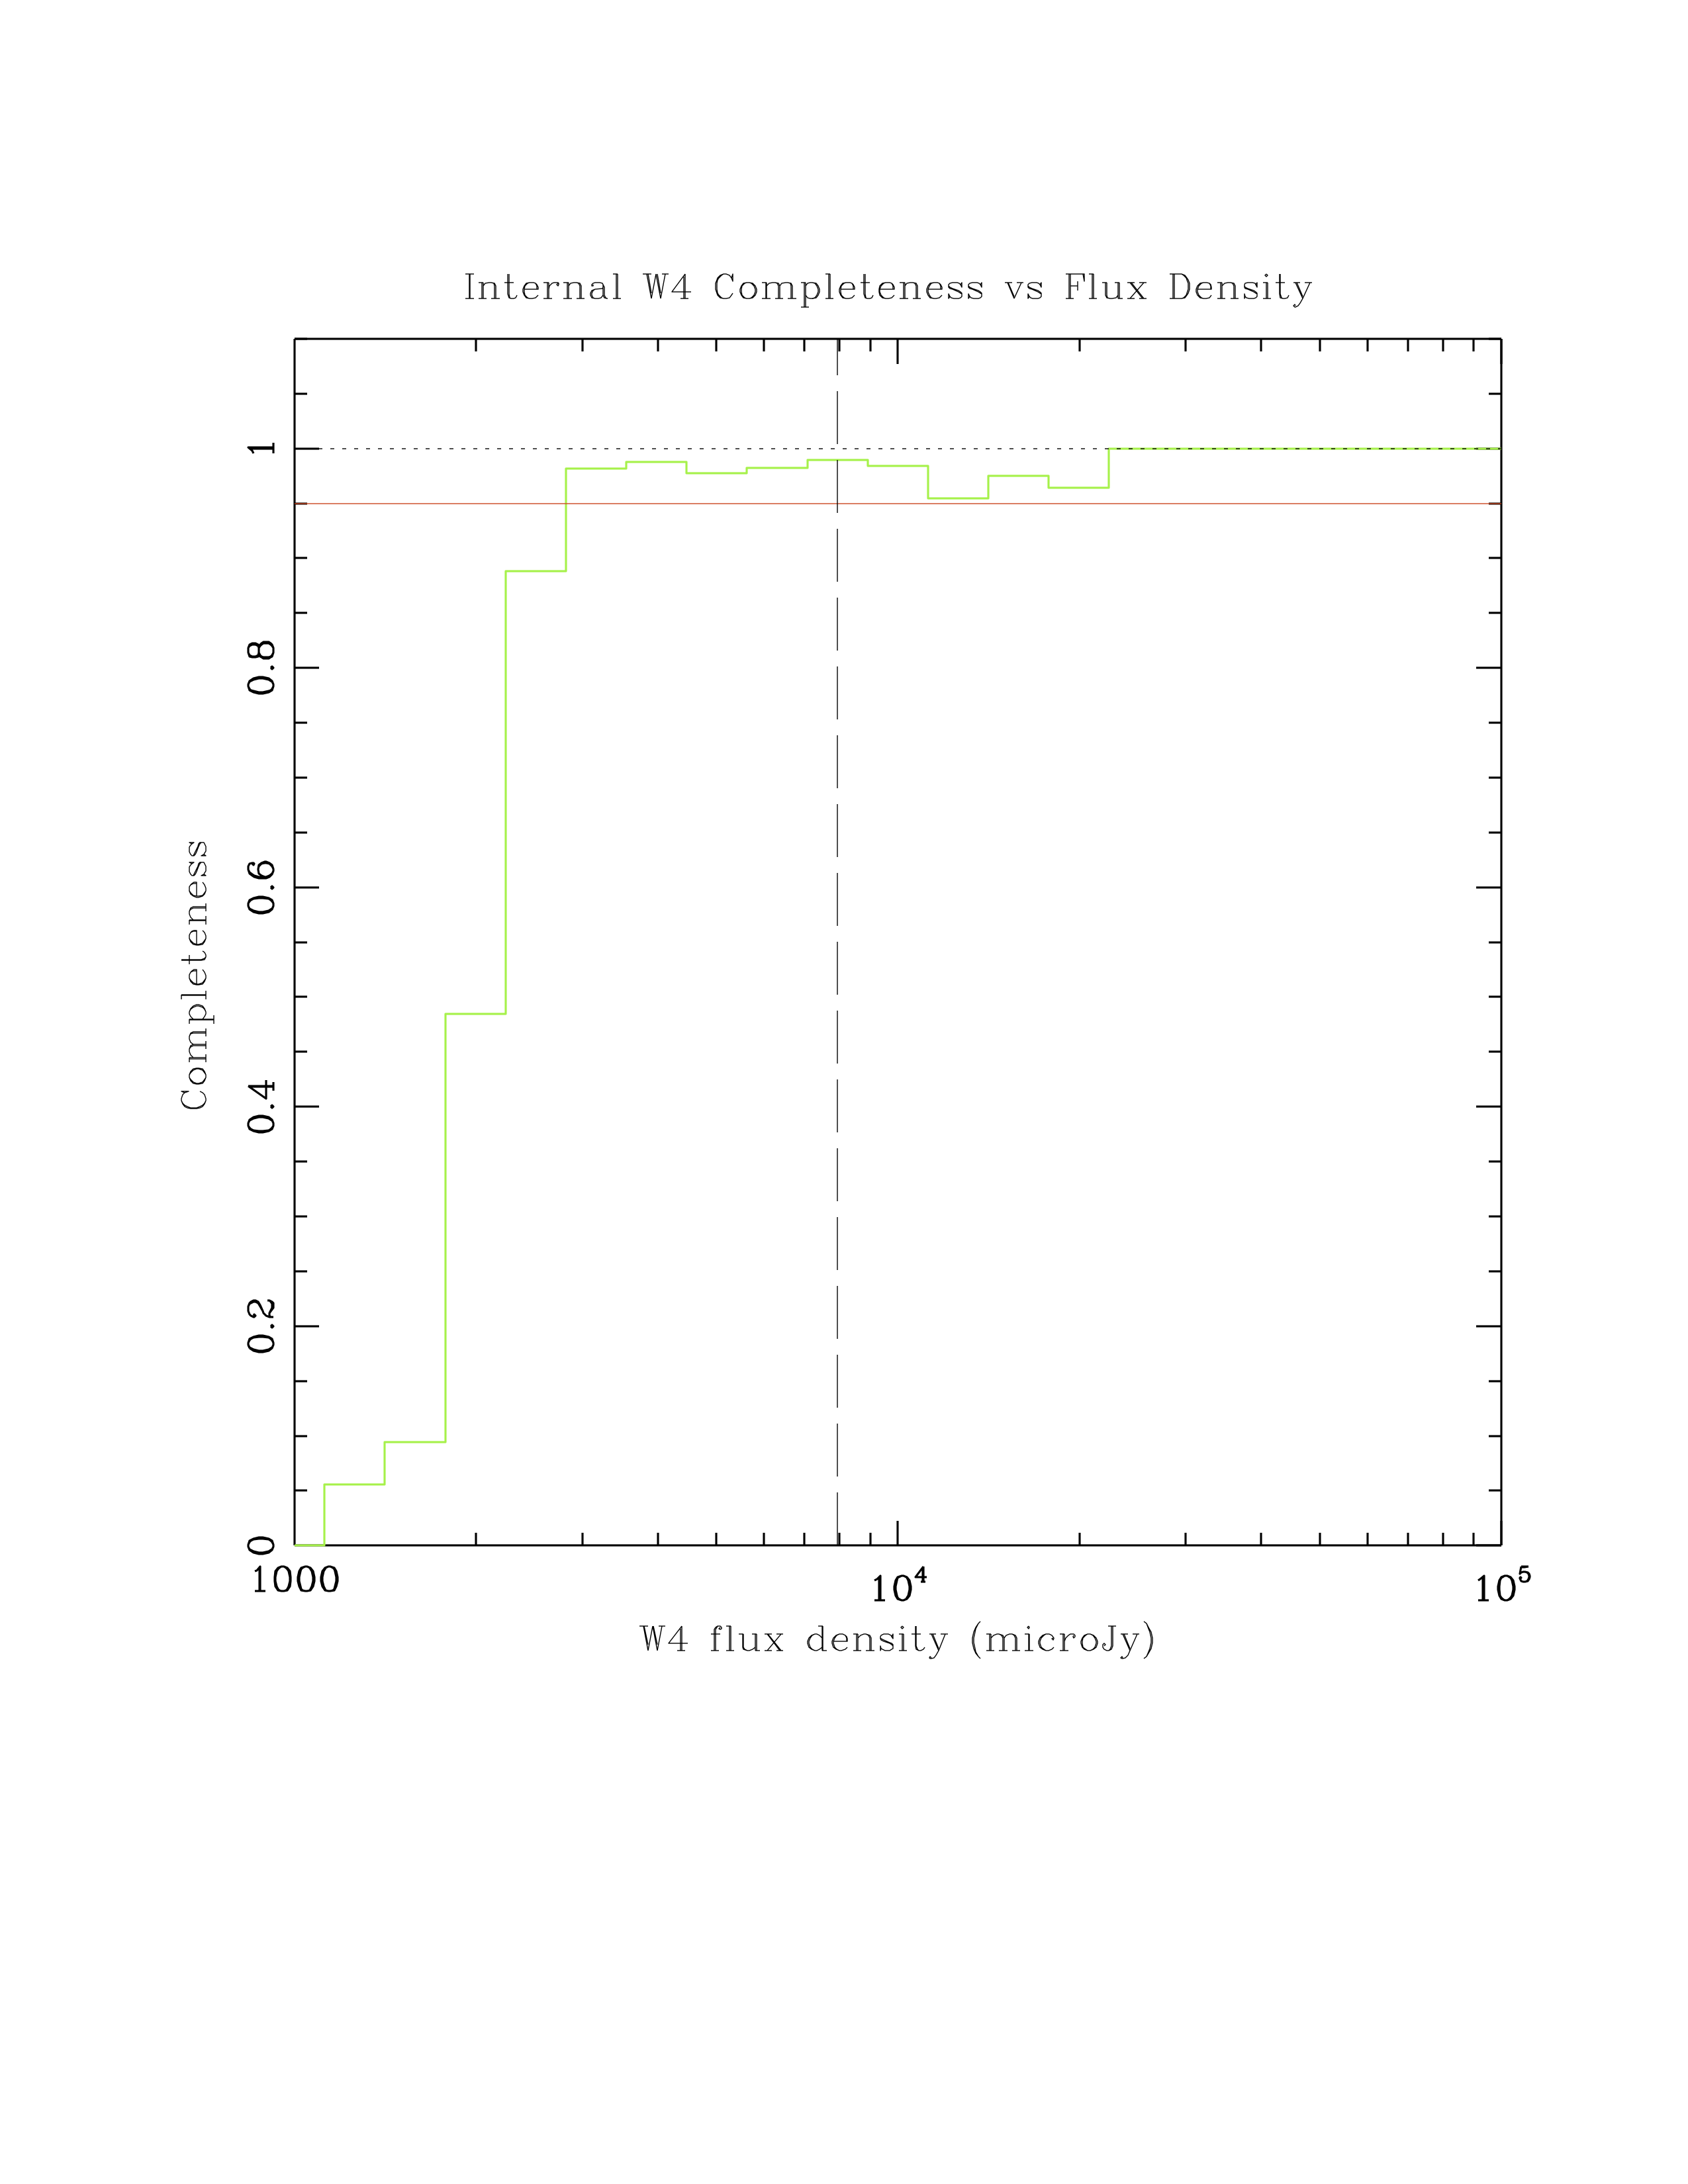 |
| Figure 4a - Completeness in W4 as a function of W4 flux density for depth=16 frames. The vertical dashed line shows SNR=20, and the horizontal red line is at 95% completeness. One sigma errorbars in each flux density bin are shown for this case. | Figure 4b - Completeness in W4 as a function of W4 flux density for depth~12 frames. The vertical dashed line shows SNR=20, and the horizontal red line is at 95% completeness. | Figure 4c - Completeness in W4 as a function of W4 flux density for depth~30 frames. The vertical dashed line shows SNR=20, and the horizontal red line is at 95% completeness. | Figure 4d - Completeness in W4 as a function of W4 flux density for depth~80 frames. The vertical dashed line shows SNR=20, and the horizontal red line is at 95% completeness. |
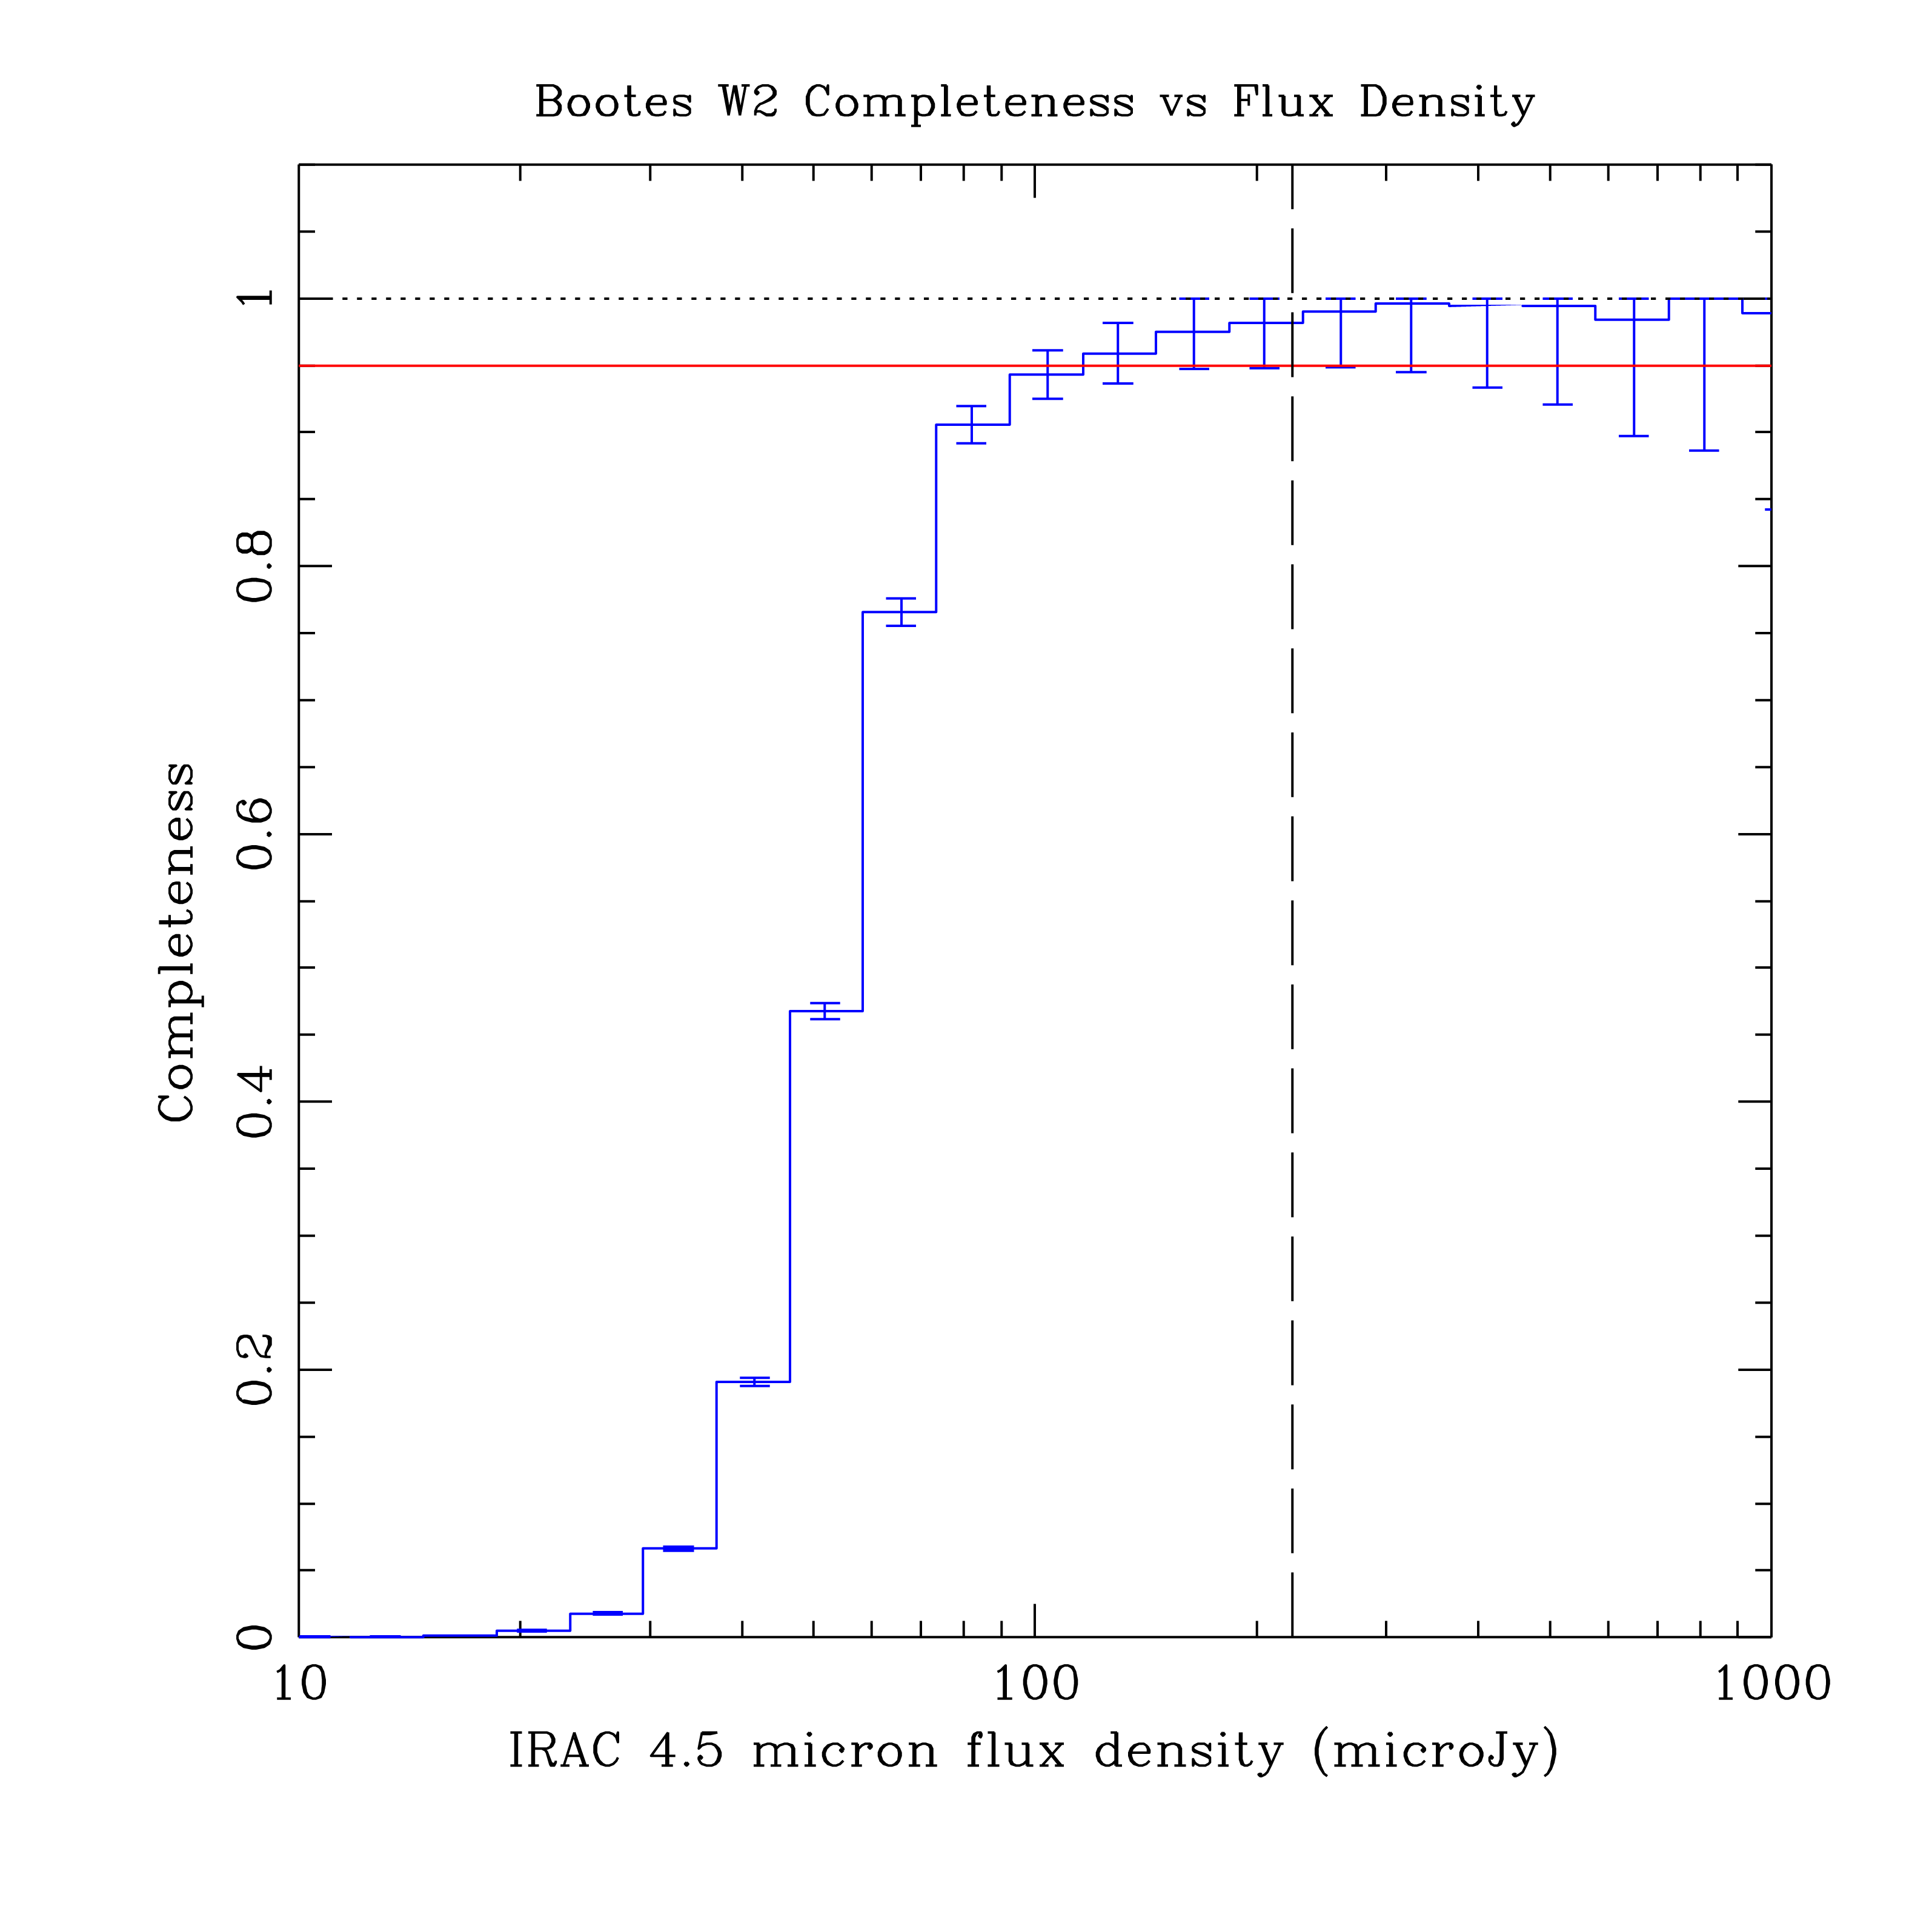
We have made use of the large amount of Spitzer data in three fields to carry out external tests of the completeness of the final data release catalog - the 9 square degree Bootes survey field, and ~1 degree areas at each of the two ecliptic poles. The W1, W2, and W4 bandpasses are similar to the IRAC ch1, IRAC ch2, and MIPS 24 micron bandpasses, the IRAC PSF is nearly 3 times smaller than the W1 and W2 PSFs, and the available Spitzer data are significantly deeper than the WISE data in the Bootes field, and somewhat deeper in the two polar fields. Thus, comparing the WISE catalogs with the Spitzer data should yield very useful constraints on the completeness. In particular, the smaller IRAC PSF allows us to test the effects of blending, due to the relatively large WISE PSF, on completeness in W1 and W2 where the source density is high enough to cause source blending.
We have used the published SDWFS data on the Bootes field (Ashby et al. 2009) for the IRAC ch1 and ch2 catalogs, and the unpublished MAGES data (Buell Januzzi, personal communication) for the MIPS 24 micron catalog. Our comparison between the WISE and Spitzer catalogs was carried out in a very similar way as described already for the internal tests. The results are shown in Figure 5, and reported in Table 4.
As expected, the WISE W1 and W2 completeness is somewhat lower, when compared with the IRAC catalogs, in the vicinity of the flux densities corresponding to SNR=20. This is due to the way that IRAC sources are blended by the WISE PSF, so that not every IRAC source is tabulated in the WISE catalogs. Still, the W1 and W2 completeness rates are at 95% or higher at the relevant SNR=20 flux densities. Note that these flux densities are somewhat lower than reported above in the median (16 frames) coverage case of the internal tests, because the average coverage in the Bootes field is 30 frames.
The W4 completeness is similar to that seen in the internal tests, reaching slightly higher levels at fainter flux densities due to the deeper coverage of the WISE data in the Bootes field compared to the median coverage case. The W4 PSF is only about twice the size of the MIPS 24 micron PSF, and the source density is far lower, so blending is not an issue in general.
 |
 |
 |
| Figure 5a - Completeness of W1 vs IRAC ch1 in the Bootes field. The vertical dashed line shows SNR=20, and the horizontal red line is at 95% completeness. One sigma errorbars in each flux density bin are shown. | Figure 5b - Completeness of W2 vs IRAC ch2 in the Bootes field. The vertical dashed line shows SNR=20, and the horizontal red line is at 95% completeness. One sigma errorbars in each flux density bin are shown. | Figure 5c - Completeness of W4 vs MIPS 24 microns in the Bootes field. The vertical dashed line shows SNR=20, and the horizontal red line is at 95% completeness. One sigma errorbars in each flux density bin are shown. |
| Band | Flux Density (milli-Jy) |
|---|---|
| W1 | 0.130 |
| W2 | 0.180 |
| W4 | 4.0 |
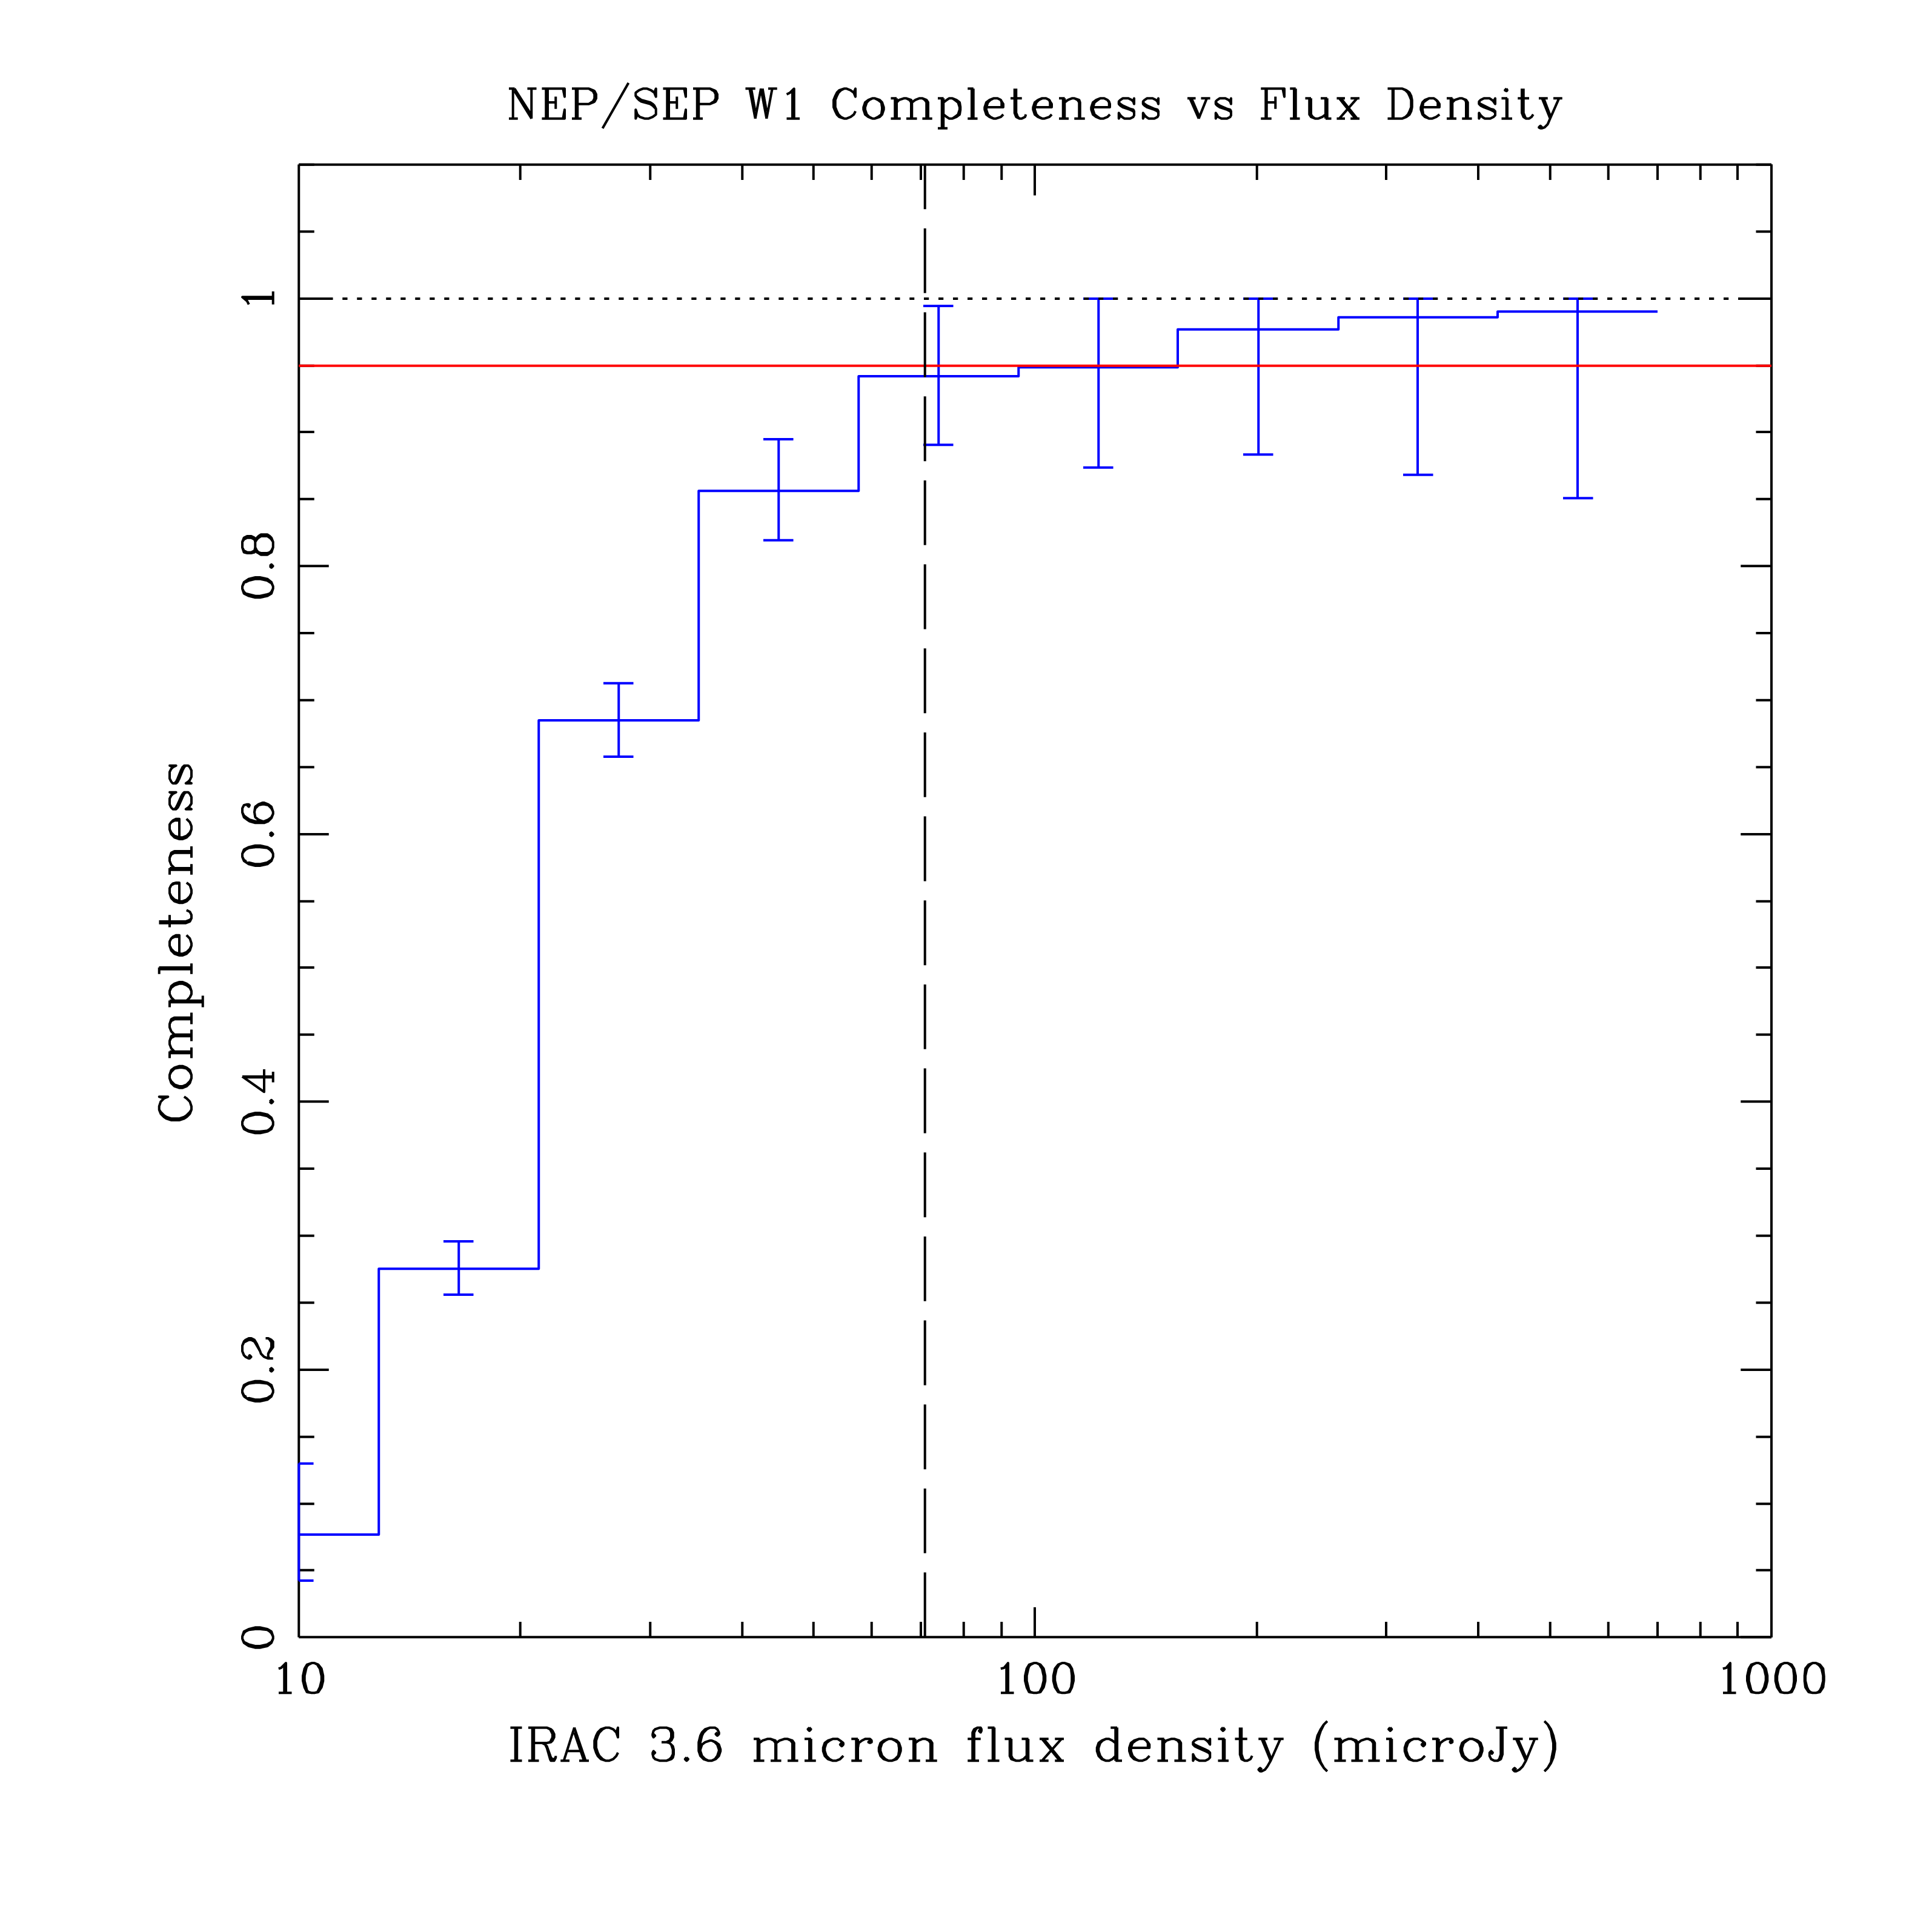
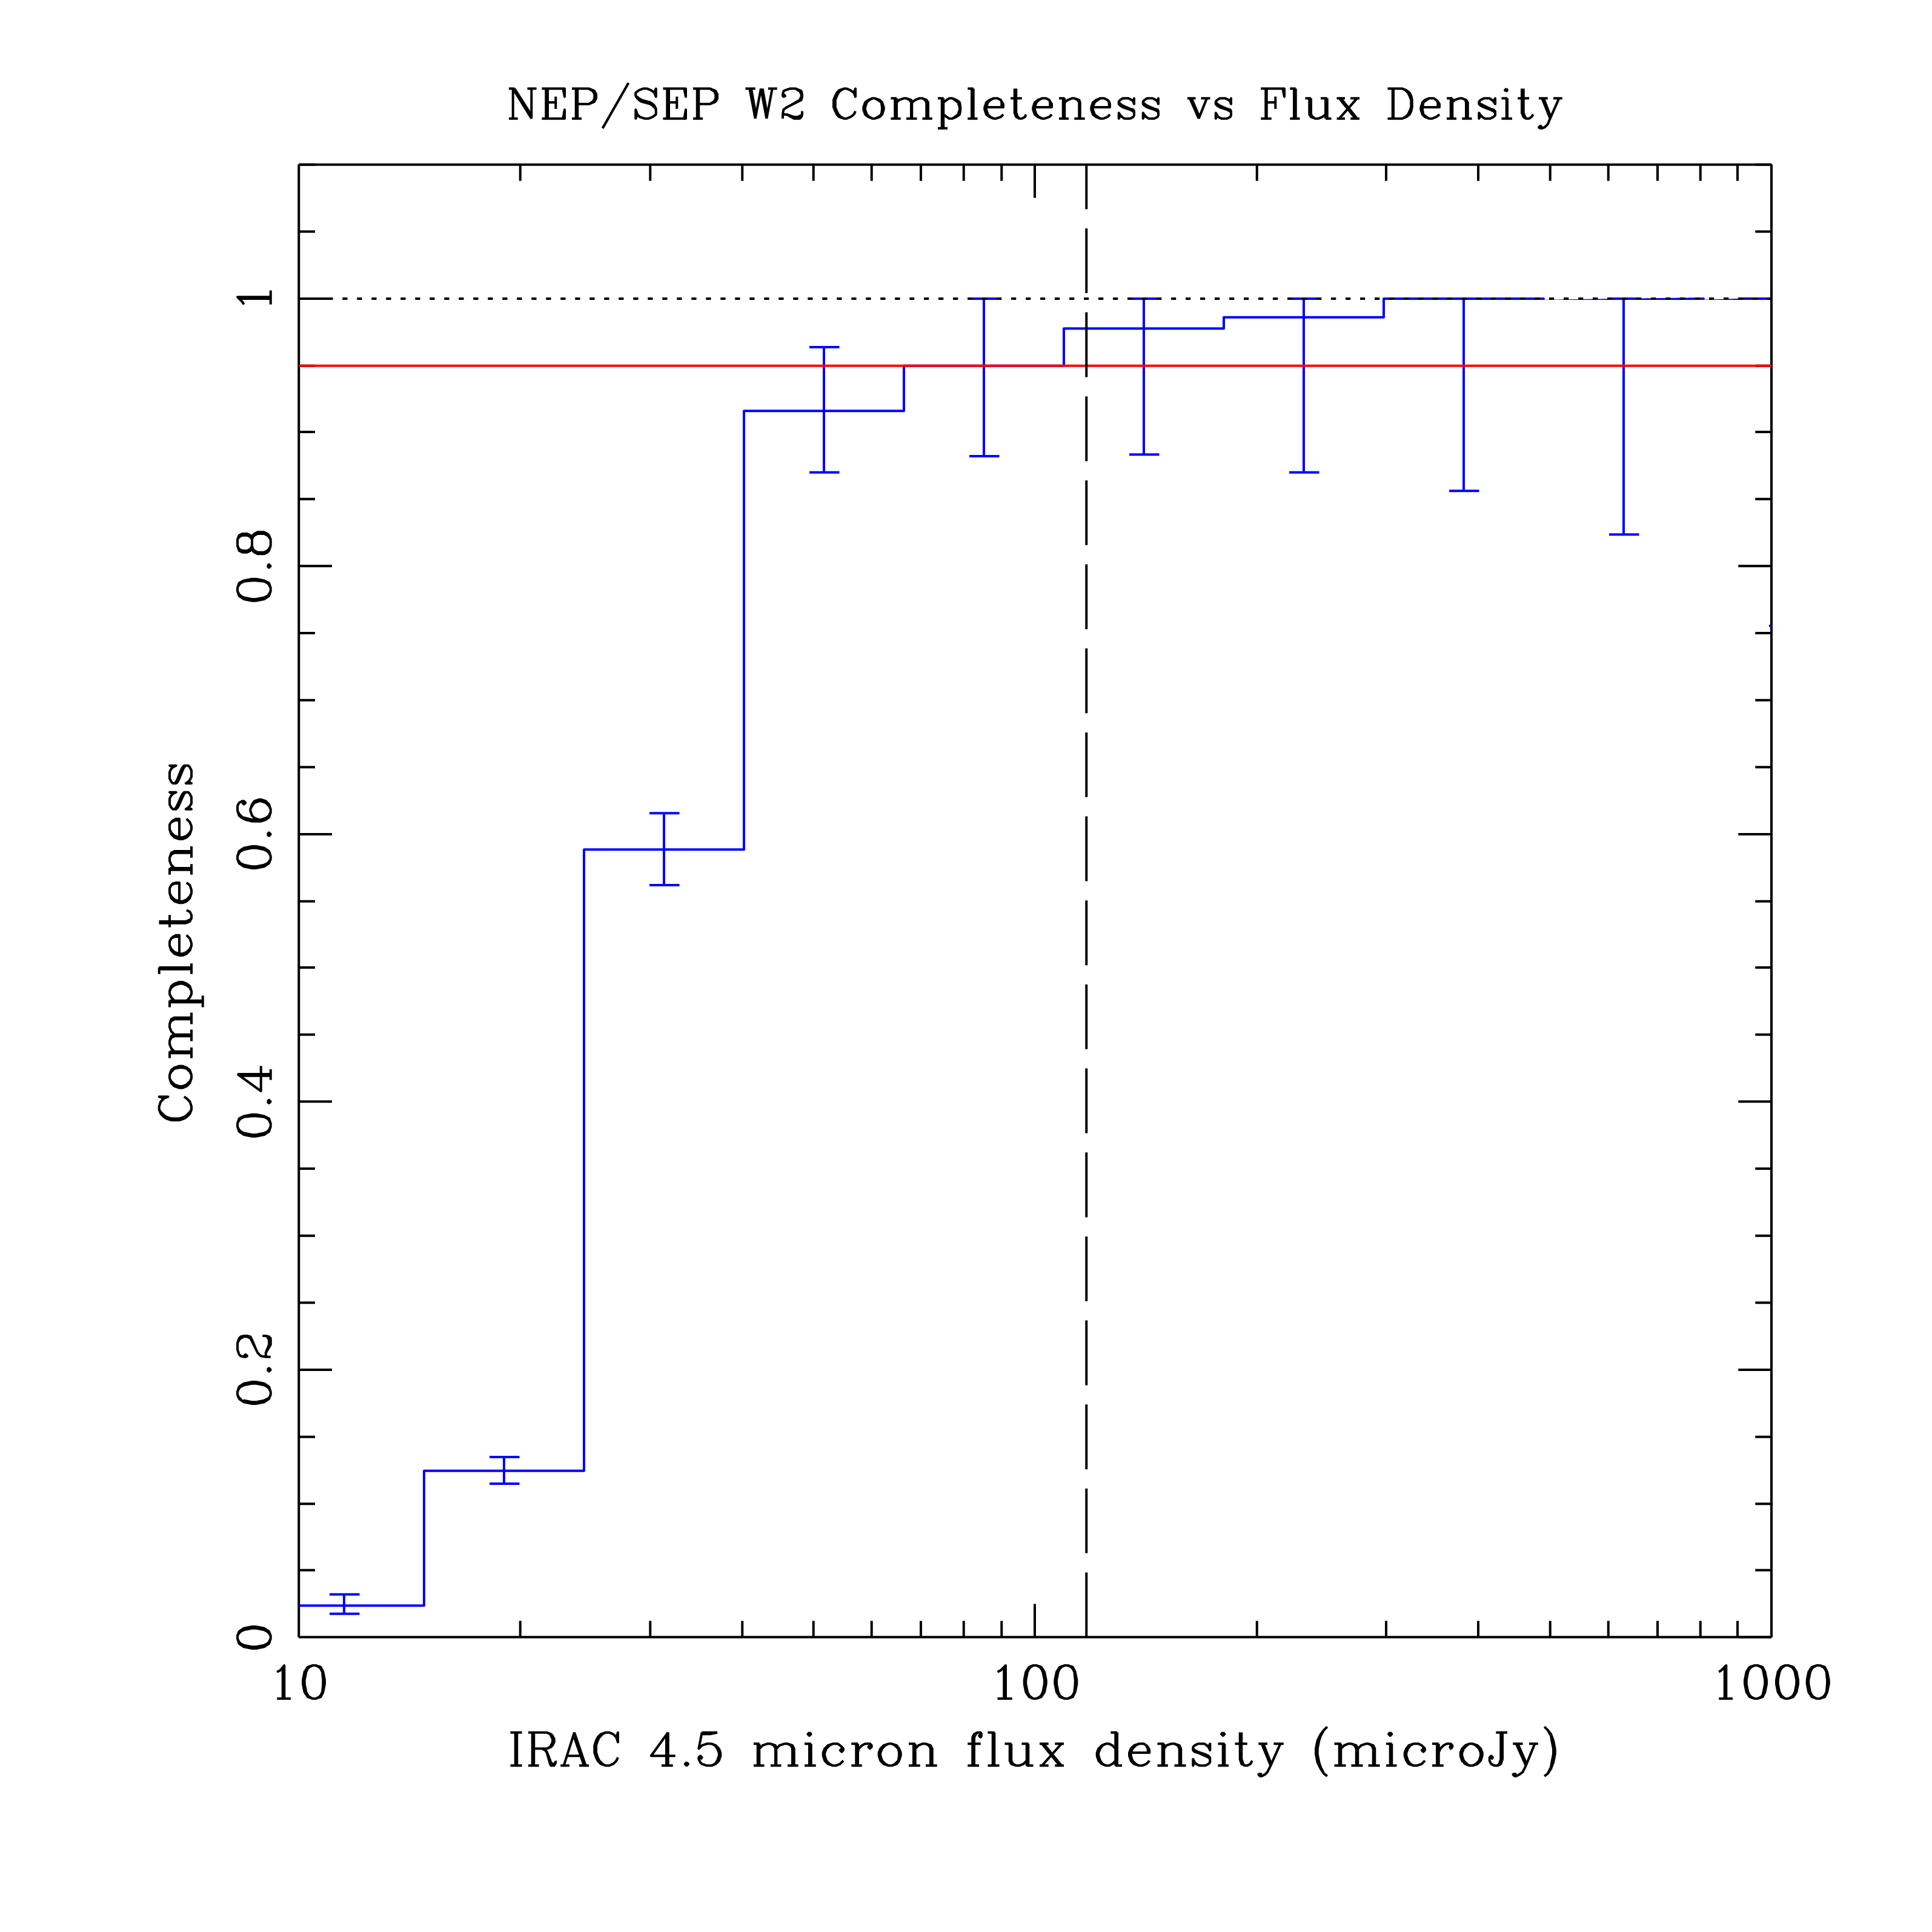
Two areas at the ecliptic poles were observed by Jarrett et al. (2010) with Spitzer as part of a program to obtain calibration information for WISE. IRAC and MIPS/24 micron catalogs were created from the Spitzer observations, and we have matched these catalogs to the WISE data in order to determine completeness in W1, W2, and W4 in a manner very similar to that described above for the Bootes field comparison.
As expected, the WISE W1 and W2 completeness is somewhat lower, when compared with the IRAC catalogs, in the vicinity of the flux densities corresponding to SNR=20, which occurs at much lower flux densities than in the case of median coverage shown by the internal tests in Figure 1 since the coverage at the poles is approximately 150 frames on average. The lower completeness is due to the way that IRAC sources are blended by the WISE PSF, so that not every IRAC source is tabulated in the WISE catalogs. Still, the W1 and W2 completeness rates are close to 95% at the relevant SNR=20 flux densities.
The W4 completeness is better than that seen in the internal tests, reaching higher levels at fainter flux densities due to the much deeper coverage of the WISE data in the polar fields field compared to the median coverage case. The W4 PSF is only about twice the size of the MIPS 24 micron PSF, and the source density is far lower, so blending is not an issue in general.
 |
 |
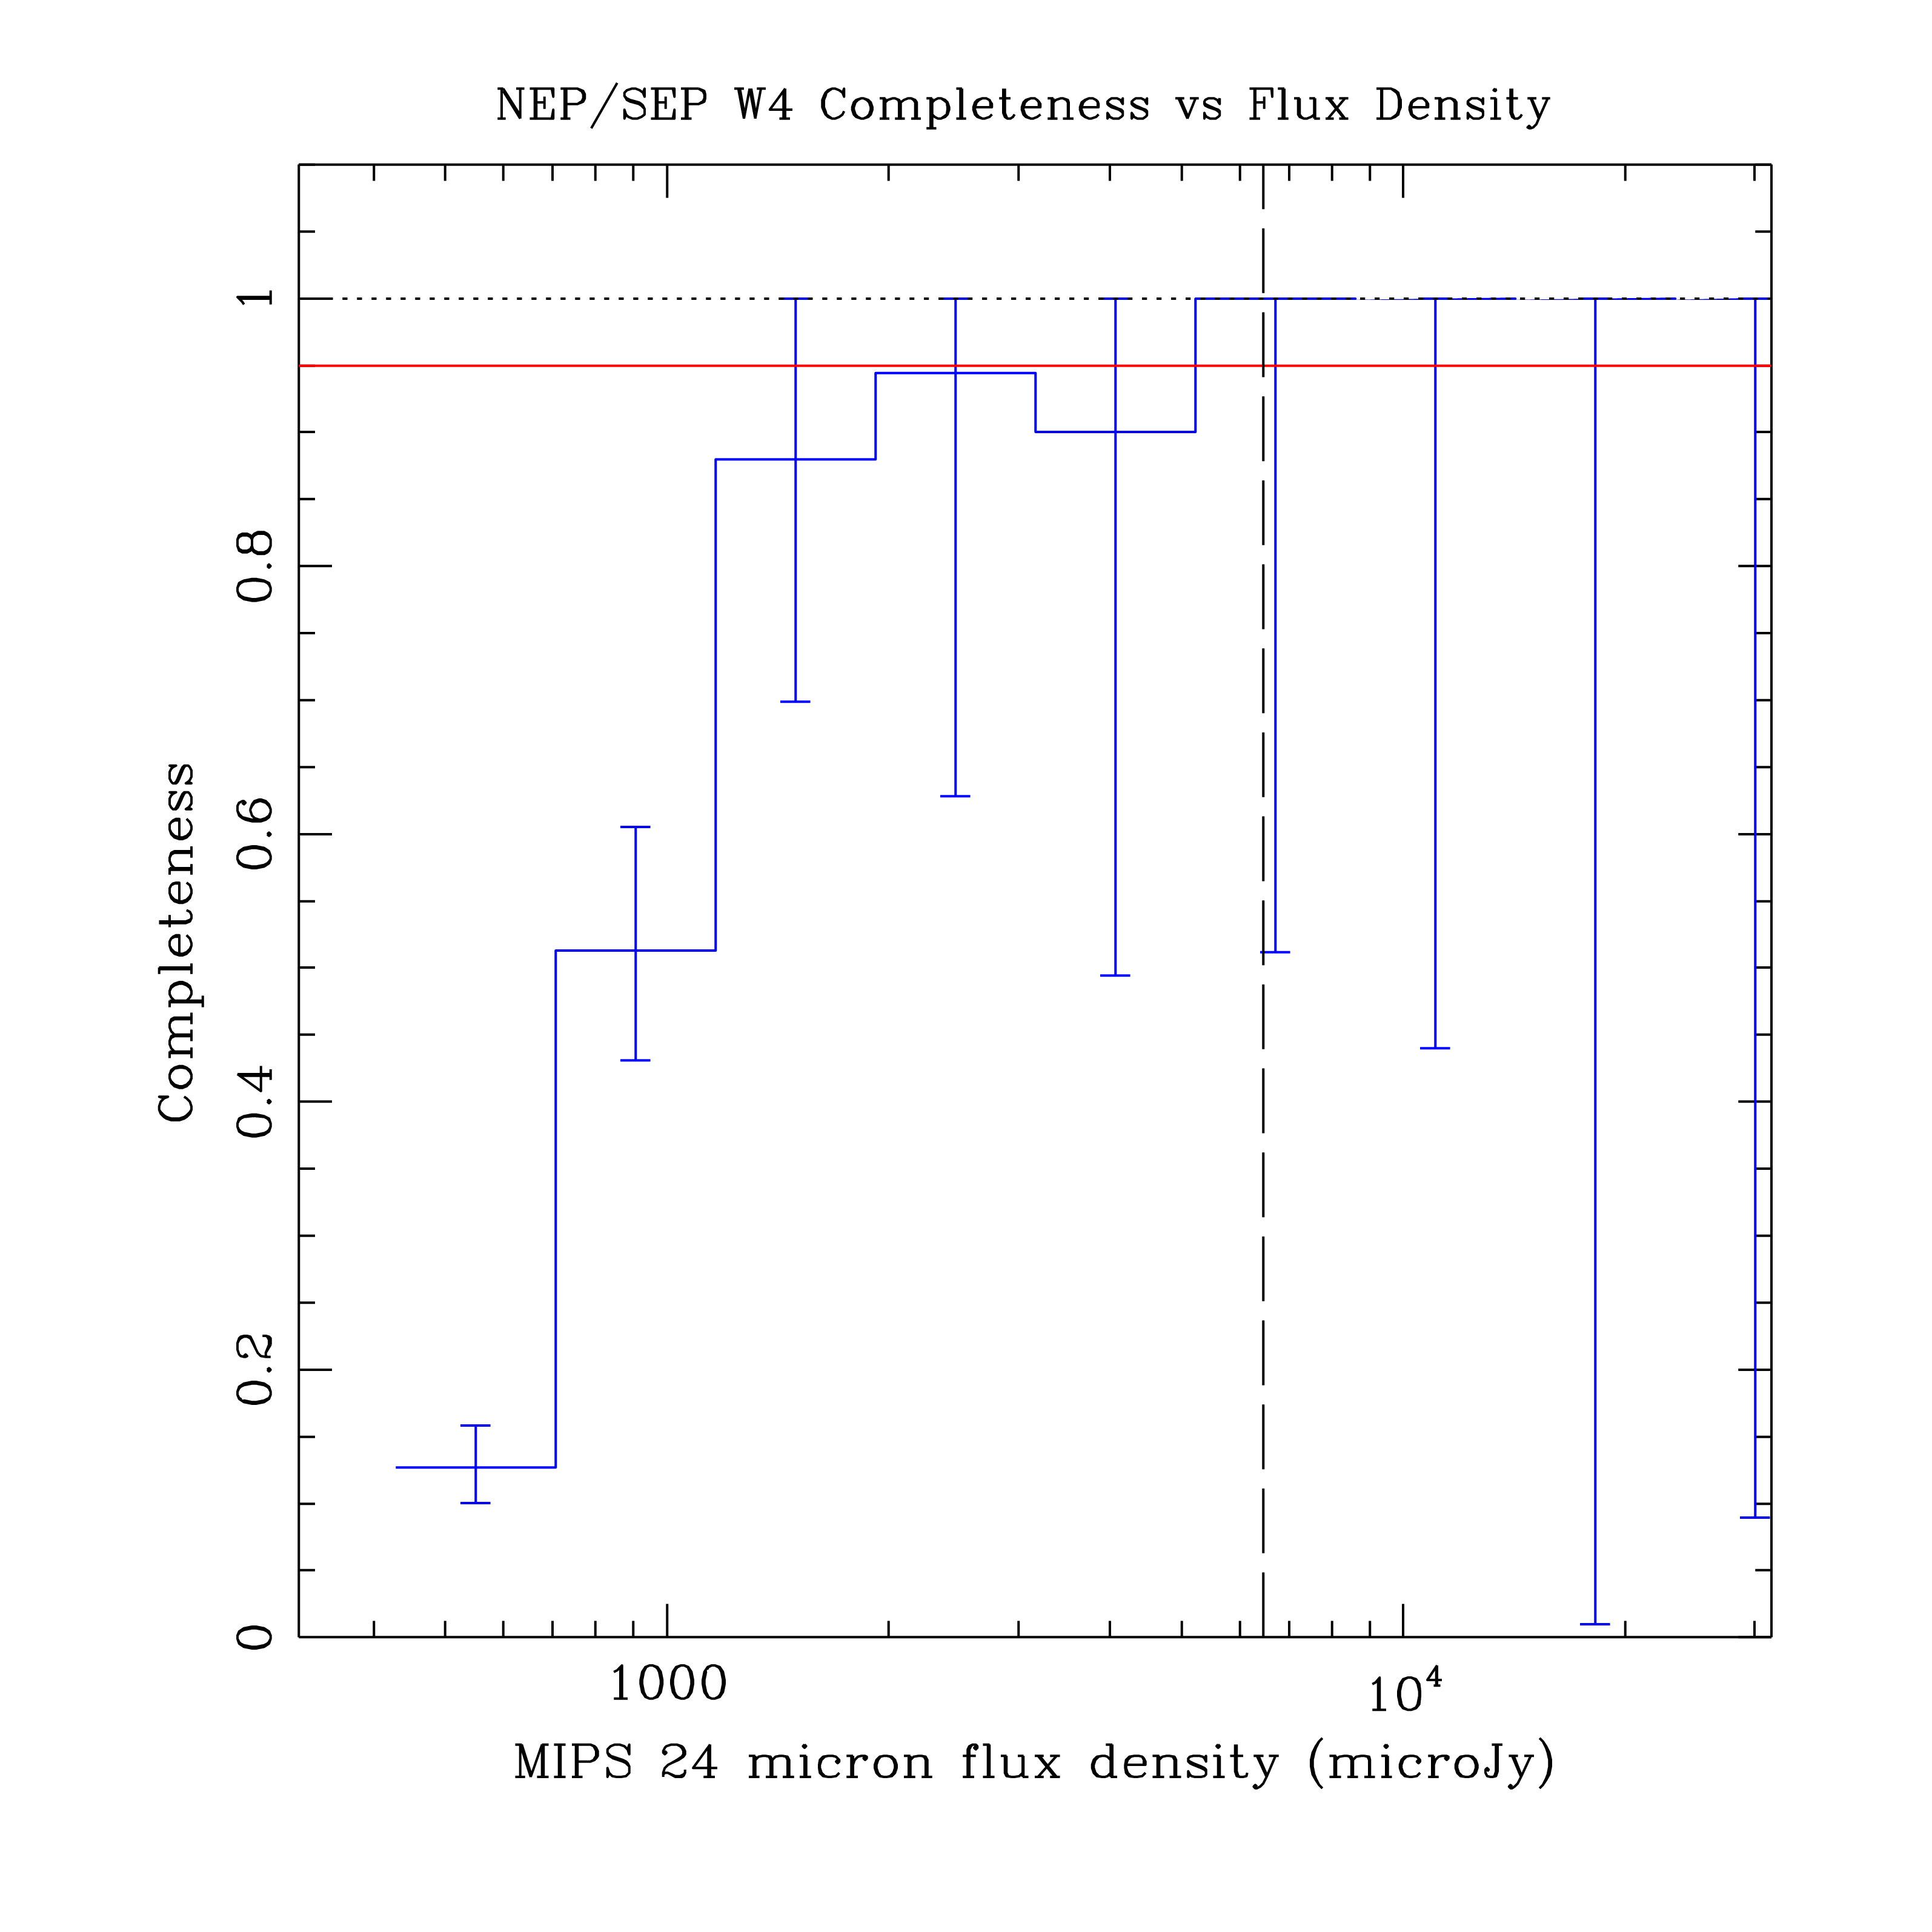 |
| Figure 6a - Completeness of W1 vs IRAC ch1 in the NEP/SEP fields. The vertical dashed line shows SNR=20, and the horizontal red line is at 95% completeness. One sigma errorbars in each flux density bin are shown. | Figure 6b - Completeness of W2 vs IRAC ch2 in the NEP/SEP fields. The vertical dashed line shows SNR=20, and the horizontal red line is at 95% completeness. One sigma errorbars in each flux density bin are shown. | Figure 6c - Completeness of W4 vs MIPS 24 microns in the NEP/SEP fields. The vertical dashed line shows SNR=20, and the horizontal red line is at 95% completeness. One sigma errorbars in each flux density bin are shown. |
| Band | Flux Density (milli-Jy) |
|---|---|
| W1 | 0.130 |
| W2 | 0.180 |
| W4 | 4.0 |
Last update: 2012 March 16