2MASS Galaxy Redshift Catalog (XSCz)
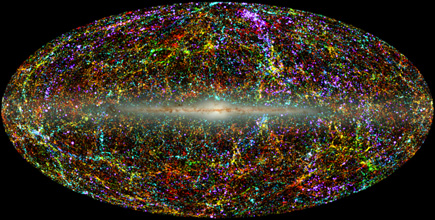
2MASS Galaxy Redshift Catalog (XSCz) |

|
Photometric redshifts are derived from optimal combination of Galactic extinction-corrected integrated flux, colors (J-K, H-K) and angular size. The typical uncertainty in any given photo-z estimate is ~25 to 30% (see Redshift Summary Table), which is indeed a crude estimate of the distance to the galaxy. The XSCz remains sharp, however, due to the inclusion of accurate radial velocities (~30% of total XSCz) to supplement the photo-zs, particularly at the low-z end of the catalogue. The following plots demonstrate the photo-z calibration and performance.
Metrics used to derive photometric redshifts:
K-correction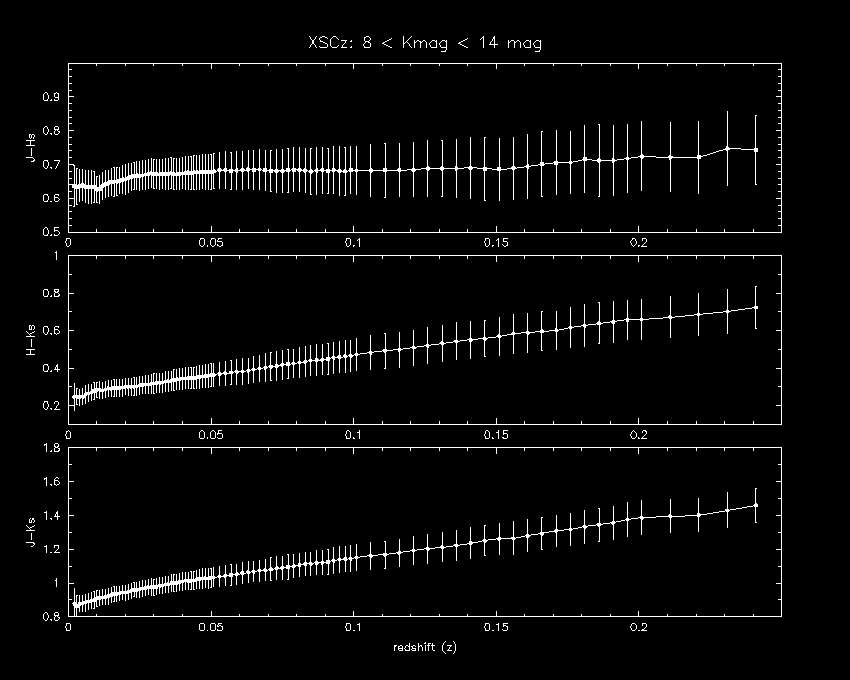 NIR colors vs. redshift. The 2MASS galaxy colors do not show the same behavior as the model templates, particularly when you view the "k-correction" curves in color-color space. |
J-K Color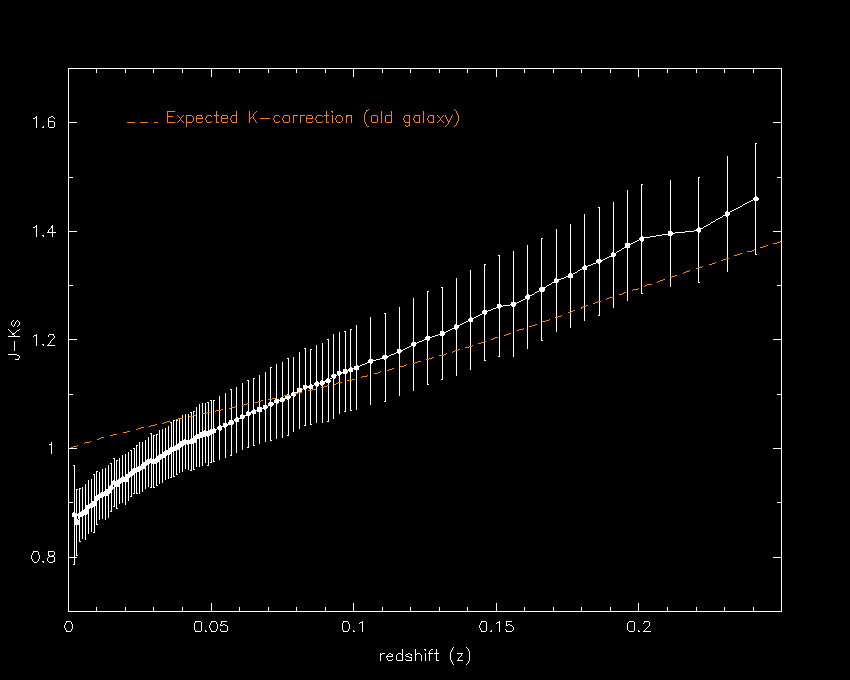 J-K color vs. redshift. The dashed line is the expected color vs. redshift for an old galaxy (GRASIL template). Note that 2MASS galaxy colors do not show the same behavior as the templates, particularly when you view the "k-correction" curves in color-color space. |
Color-Color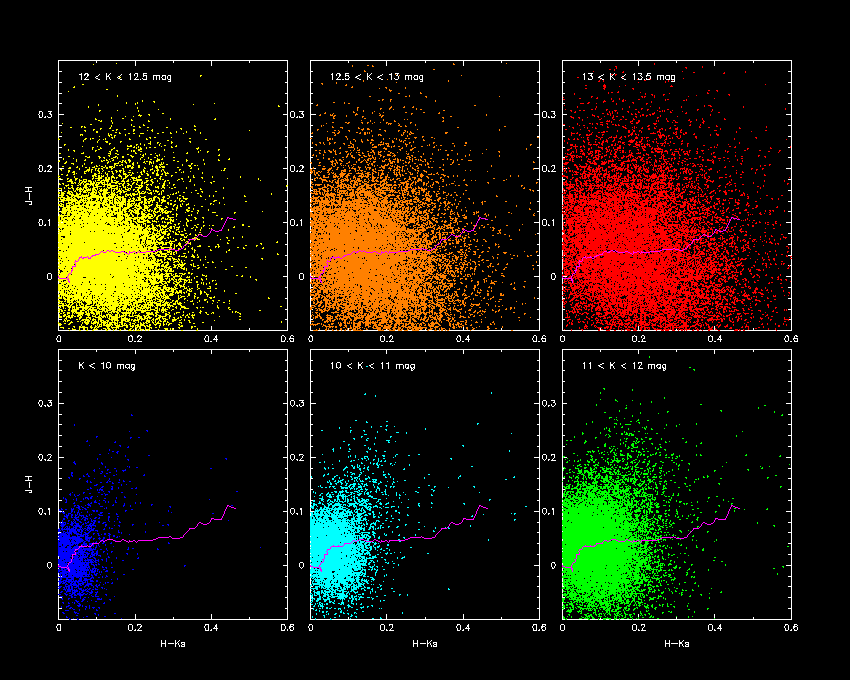 Color-Color separated by integrated flux. The magenta lines shows the expected redshift track ("k-correction"). |
Size vs. Redshift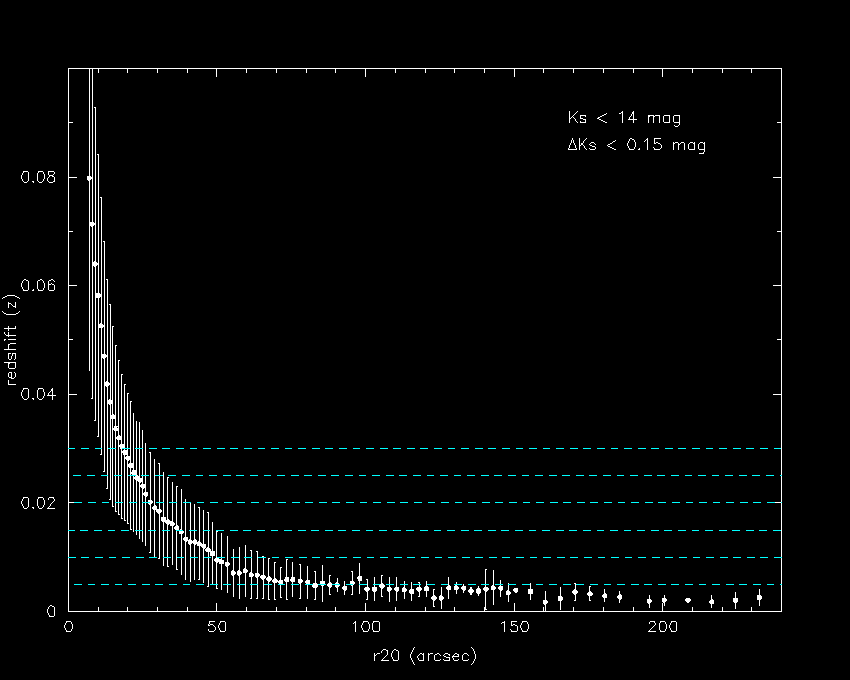 Isophotal radius vs. redshift. |
Kmag vs. Redshift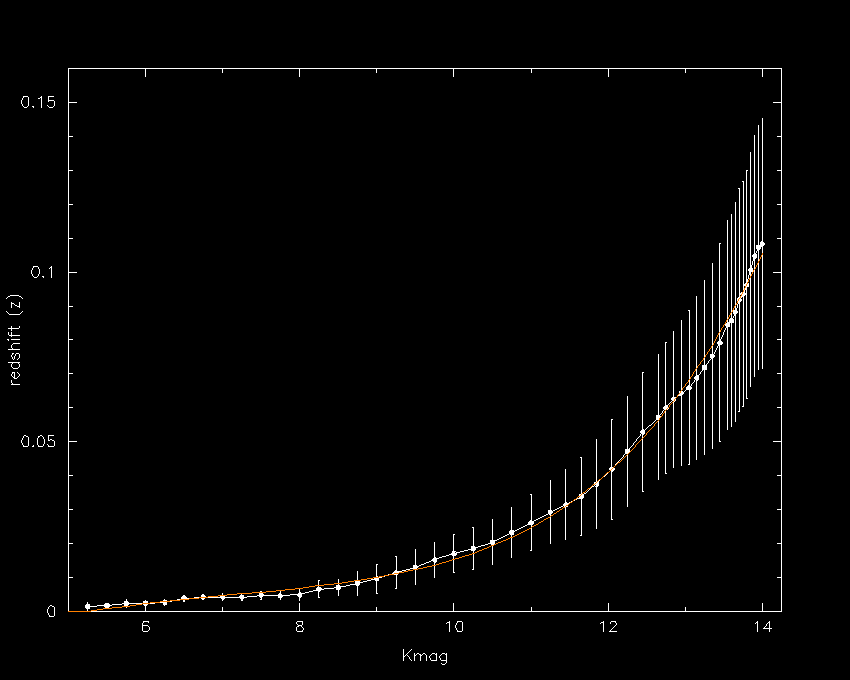 Integrated flux vs. redshift. |
Color vs. Redshift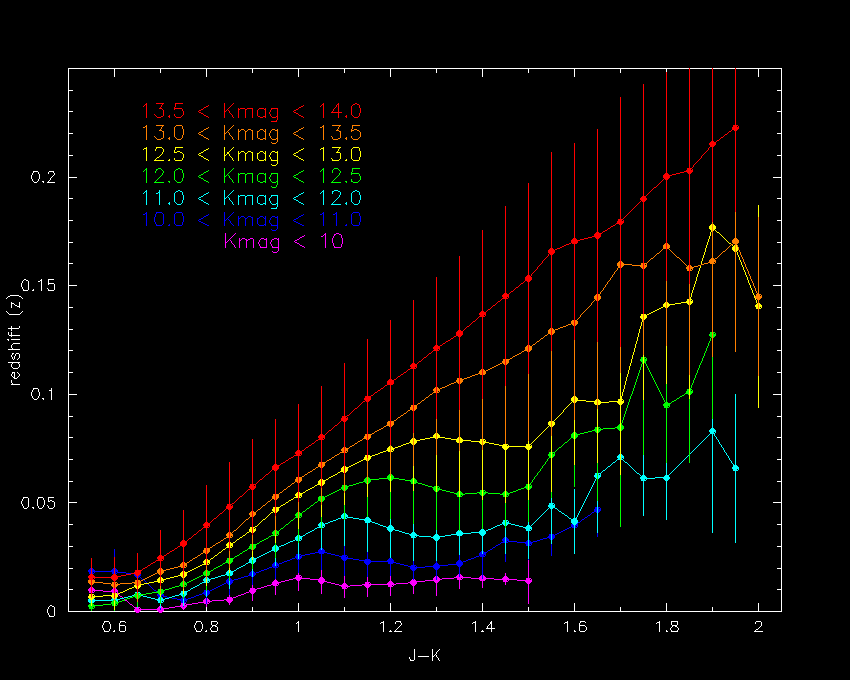 J-K color vs. redshift, separated by Kmag bins. Here is a plot showing how the JK vs. z slope linearly correlates with the Kmag. |
Discussion
Clear trends are seen in colors (notably J-Ks), integrated flux and angular size with redshift. The most important component is the integrated flux, which tracks the luminosity of galaxies with ~M* properties. For well-resolved galaxies, R20 > 25" the angular size is a powerful discriminent of distance (z < 0.02), but quickly becomes degenerate for smaller sizes. Finally, J-Ks or H-Ks color systematically tracks redshift due to the H-band peaked SED shifting into the K-band. We note that the empirical k-correction (e.g., consider J-K vs. z) is different from what would be expected assuming an "old galaxy" SED template integrated within the 2MASS filter bands. This is clearly seen in color-color redshift tracks, which show that the J-H color of 2MASS trends redward with redshift, but templates predict blueward trends with redshift. It is not known what the cause of this discrepancy between 2MASS colors and SED templates.
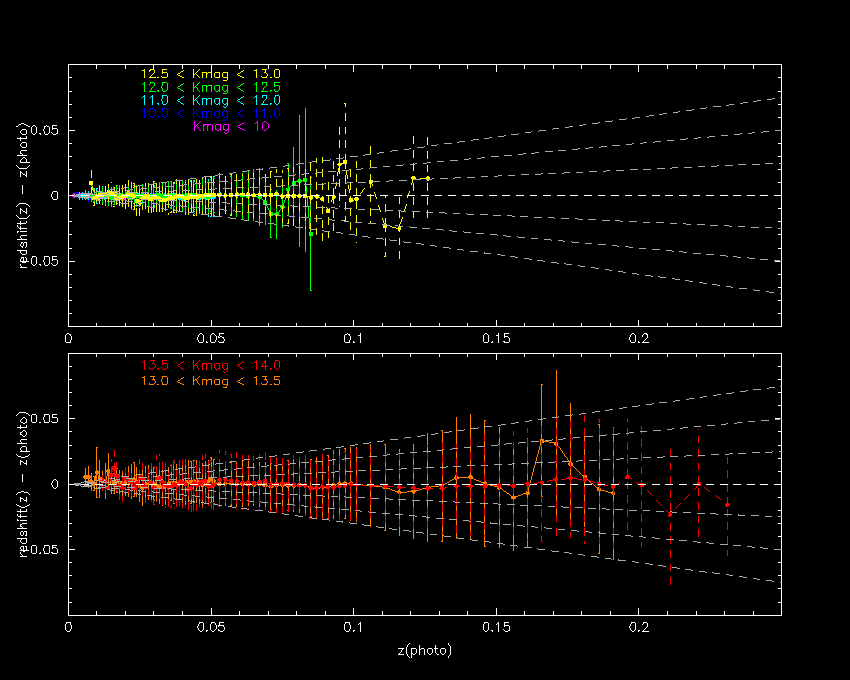 Photometric Redshift vs. Radial Velocity. |
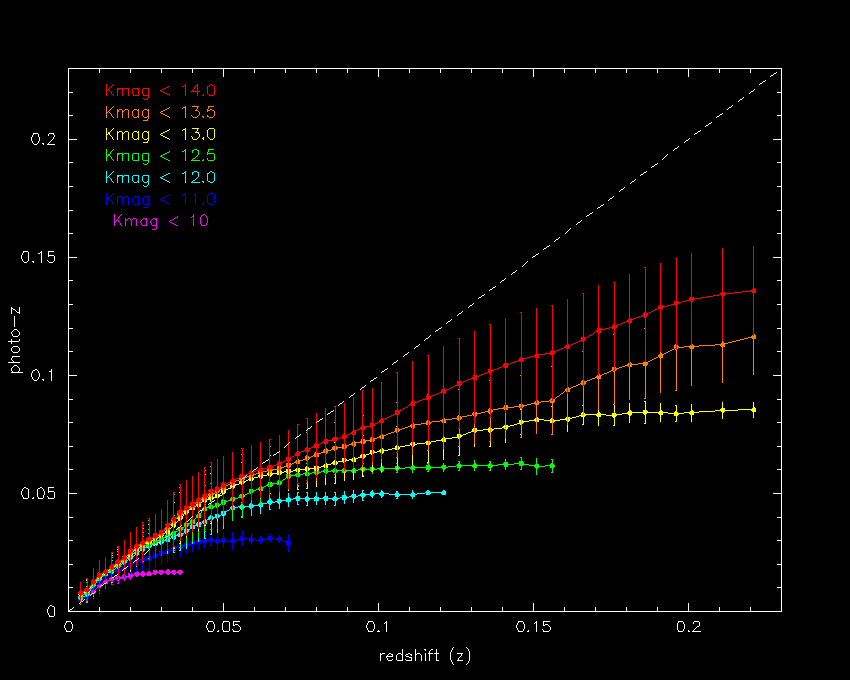 Radial Velocity vs. Photometric Redshift. Here is a differential version. |
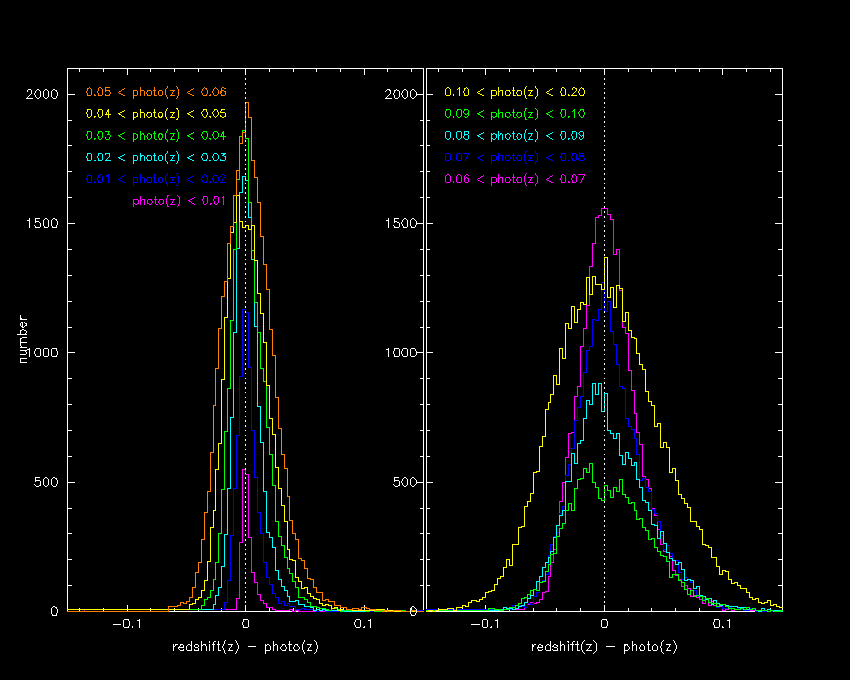 Redshift Uncertainty Distribution per photo-z bin. Here is the log distribution but separated by K mag. |
Discussion
From the photo-z frame of reference, the typical rms uncertainty in the derived photo-z is near 30% (e.g., see the Redshift Uncertainty Distribution). The photo-zs appear to be consistent across the redshift range and K-mag range of the XSCz. Hence, the photo-z calibration appears to be solid. From the radial velocity (spec-z) frame of reference, the photo-zs are accurate for galaxies with luminosities near the M* limit, which is expected due to the technique used to derive photo-zs, but systematically underestimates the true redshift at higher redshifts. For luminous galaxies, the photo-zs are systematically too small (or nearby), and for sub-luminous galaxies (typically located nearby due to the integrated flux constraints), the photo-zs are too distant. We should note that the spec-z sample itself is not uniform, but tends to be skewed towards higher luminosity galaxies because they are more easily detected (i.e., mag-limited surveys are biased to higher luminosity galaxies). So even though any given photo-z is ~25-30% accurate, the method is most accurate (low systematics) for normal color and luminosity galaxies with z < 0.1. Extreme galaxies (e.g., AGN, dwarfs) will have the most inaccurate photo-zs.
Consider a redshift shell, e.g., 0.02 to 0.03. The photo-zs within that shell will scatter about with 25-30% accuracy. Intrinsically luminous galaxies who's true redshift places them in that shell will have photo-z that are too small, instead pushing them into a closer shell (say 0.01 to 0.02). Conversely, sub-luminous galaxies (e.g., dwarf blue galaxies) which would normally be located at that distance would appear to be more distant in photo-z, placing them in larger shell (say 0.03 to 0.04). Fortunately, since most XSC galaxies fall near the M* limit (as given by the Luminosity Function), the photo-zs are accurate (with minimal systematics) for most of the galaxies in any given redshift shell. The bottom line is that the XSCz will be sensitive to galaxy clusters (with many galaxies at the same redshift that have M* properties) and field galaxies with normal properties, representing most galaxies in the XSC. The photo-z performance is summarized in the Redshift Summary Table.
The resolution to the XSCz photo-z limitations is to add another photometric band(s) to the determination, preferably a measurement in the optical window. The addition of a V, or R or I-band integrated flux would significantly improve the resultant photometric redshifts. Multi-band photometric redshifts are a routine product for the SDSS and NYU-VAGC catalogues; see Mike Blanton's impressive set of tools to derive k-corrections and photo-zs using SDSS data. Studies are now underway to add photographic (optical) fluxes from the SuperCosmos Sky Surveys and the DENIS I-band survey of the southern hemisphere.
| main | Introduction | Spectroscopic Redshifts | Statistics Summary | Finger-of-God Artifacts | Visualization Partiview | Links References |