I. Introduction
4. Cautionary Notes
c. Image Atlas
Contents
- Depth-of-Coverage Variations
- Low Coverage Areas
- Astrometric Bias
- Photometric Calibration
- Background Matching
- Image Artifacts
- Saturation
- Moon Contamination
i. Depth-of-Coverage Variations
Global and local variations in the depth-of-coverage are expected from the
nominal survey design (section I.4.a.3).
However, there are regions where the depth-of-coverage varies considerably
due to the exclusion of "bad" input frames and individual
pixels when generating the Image Atlas.
This could be due to
contamination from the moon, cosmic rays,
and/or other outliers (e.g., induced by fast moving objects),
or bad quality frames in general. The latter
are usually associated with elevated noise or degraded image quality
caused by excursions in
spacecraft tracking. For details on the frame selection process, see section
V.2.c. A general description of the
construction of the depth-of-coverage maps and the physical meaning of
pixel values therein is given in section
II.3.d.
ii. Low Coverage Areas
Examples of Atlas Images with low depth-of-coverage due to the
above-mentioned effects are shown in section
VI.2 (Figures
16 and
17).
An immediate consequence for regions with low depth-of-coverage
(covered effectively <~ 6 times) is
that the
temporal pixel-outlier rejection
process becomes unreliable.
Even though robust estimators were used in this method,
they are still relatively "noisy" when
the number of samples in the stack was low.
Strictly speaking, no temporal
pixel-outlier rejection is performed for depths-of-coverage ≤ 4.
This criterion avoided throwing away too many good pixels during the
coaddition process, with the caveat of increasing the number
of unreliable or spurious detections (cosmic rays, fast moving object trails,
and other transients).
Note that the source catalog selection process
explicitly excluded
extractions from regions with a depth-of-coverage ≤ 4.
iii. Astrometric Bias with Respect to Source Catalog
If one were to measure the equatorial (J2000) positions of sources
off Atlas Images, e.g., via a flux-weighted centroid or peak-finding algorithm,
there will be a systematic difference with the astrometrically calibrated
positions from the WISE source catalog or any
other astrometric reference catalog. For details, see section II.3.g.
The absolute (radial) differences between
Atlas Image-derived source-peaks and "true" astrometric positions
anywhere on the sky are up to 0.5 arcsec in bands 1, 2, 3, and
1.4 arcsec in band 4.
A procedure to correct the Atlas Image derived source positions and image WCS
in general is given in section II.3.g.
iv. The intensity units of Atlas Image pixels are Digital Numbers (DN)
Pixel units in the Atlas Image (and Single-Exposure Intensity images) are
not calibrated in terms of absolute surface brightness. Their units are
digital numbers (DN). The images are designed for photometric
measurements relative to a local background value using the photometric
Zero Point Magnitude (MAGZP) value provided in the Atlas Image
FITS headers. Methods on how to convert photometric
measurements made off the image products to absolute flux units are outlined
in section II.3.f.
v. Background Matching
One of the first steps in the Atlas
Image generation pipeline is
background level matching of the single
exposures.
Given the WISE mission had no requirements on the background,
we adopted a simple, fast, locally self-consistent method. Only the single
exposures touching an individual Atlas Image tile were matched with respect
to each other.
Three caveats have been identified from this method:
- Background gradients will not be continuous across Atlas tile
boundaries on the sky. I.e., systematic "step-like" patterns will result
if one attempts to stitch together several or more tiles across the sky.
- The method does not preserve natural background
variations (first-order gradients) on scales
spanning a full Atlas-tile footprint.
However,
the use of a relatively low-order fit in the background
regularization process is likely to have preserved
astrophysical variations on scales of <~ 47 arcmin, i.e.,
<~ half the linear dimension of an Atlas Image tile.
- For regions with complex and fast-varying backgrounds,
matching of the background levels between overlapping
frames is likely to be innacurate. In some cases, this caused the downstream
pixel outlier detection
step to over-flag pixels as outliers.
An example is shown in
Figure 23 of section
VI.2.iv.
- When bright extended emission exceeding ~10 arcmin across is present, the
background matching/regularization process
has a tendency to "over-fit" the background
(due to the presence of the extended emission itself). If the extended
emission is bright enough, this can lead to an
overestimate in the local background
and a dark halo surrounding
the emission can result after subtraction.
This effect is mostly seen in bands 3 and 4 (where the background is highest),
although it may
occur in any band depending on the brightness of the extended
emission relative to the local background.
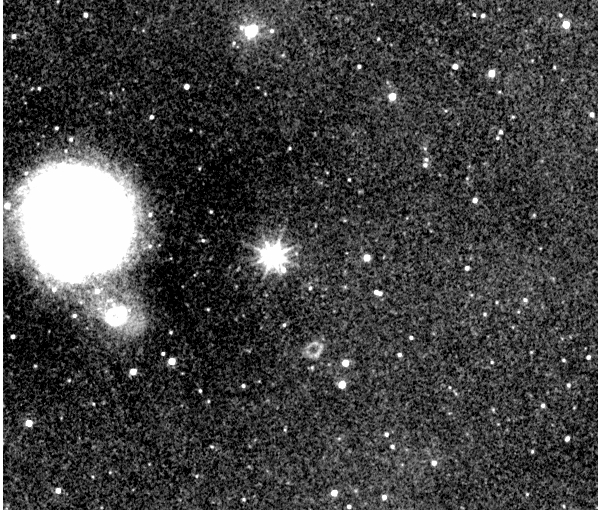
An example of this effect is shown in Figure 1.
 |
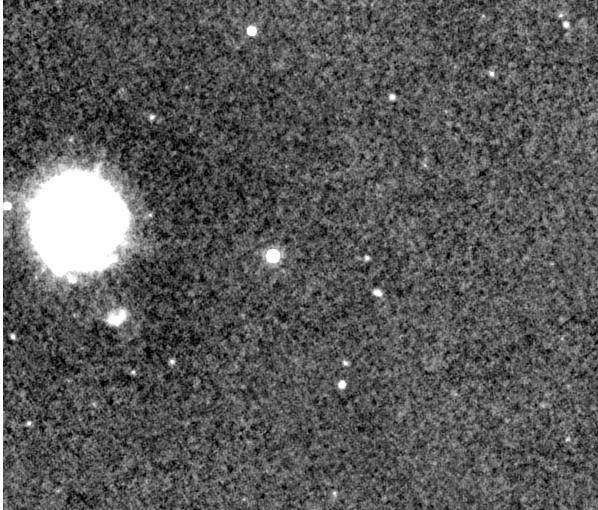 |
| Figure 1 - Section of a band 3 (left) and band 4
(right) Atlas Image measuring ~54 x 46
arcmin2 containing the M83 galaxy at far left.
Note the dark halo (depressed background)
surrounding M83. The image stretch was set to exacerbate
this depression. The depression here is ~0.5-0.6% relative
to the median background per pixel on larger scales. |
vi. Atlas Image Artifacts
The Anomaly Gallery
contains examples of the artifacts
commonly encountered in Atlas Images.
Overall, these fall in two broad categories, with much overlap between
the two:
- Artifacts present at the single-exposure level that
do not get suppressed during the coaddition process. Examples are
diffraction spikes and short-term latents.
The survey scanning strategy,
in general, does not produce randomly dithered overlapping
frames for optimal temporal
outlier detection.
These artifacts reinforce most strongly around the ecliptic plane
and "smear-out" as one approaches the ecliptic poles.
- Transients that are most apparent
in low depth-of-coverage regions, e.g.,
cosmic rays, detector-induced
electronic-noise (channel/amplifier noise in bands 1 & 2
or droop residuals in bands 3 & 4), light scattered from the moon
and other bright objects, satellite trails, fast moving objects, and
latents generated therefrom.
vii. Saturation
Saturated pixels are masked in the single exposure images and omitted
when constructing the Atlas Images.
For bright regions and sources exceeding
the saturation limits,
pixels in the Atlas Image
intensity and uncertainty maps will be associated with NaN
(Not-a-Number) values.
The corresponding depth-of-coverage map will have zero coverage in these
regions. These "holes" are typically seen at the location of the peak-emission
of sources. An example is shown here.
viii. Moon Contamination
The Atlas Image generation pipeline
includes a step to tag frames containing scattered moon-light for further
dissemination downstream (see section
IV.5.a.iv for details).
The initial moon-tagging step is done using a
moon-centric mask that indicates
regions most contaminated by the moon. A frame that hits any one
these masked regions is tagged as containing scattered moon-light.
However, following generation of the preliminary-release Image Atlas, a bug
was discovered when computing the position angle of a frame in the
moon's reference frame as defined by the mask. This error is expected
to have mis-tagged only band 3 & 4 frames that would otherwise have
landed on one of the moon diffraction-spike arms or outer ring in the
mask. Frames landing in the central
symmetric core would have been correctly tagged. Bands 1 & 2 are not
affected since the moon masks are circularly symmetric. Nonetheless, we
do not expect this error to have had a significant impact since the moon
masks only served as a prior tagging step.
It is likely that the "missed" frames would have been excluded by
the downstream frame-outlier rejection step.
Last update: 2011 May 23
Previous page Next page
Return to Explanatory Supplement TOC