VII. 3-Band Cryo Data Release
3. 3-Band Cryo Data Processing
c. Source Photometry (WPHOT)
i. Variability and Flagging
Overview
The variability flag, var_flg, is a four-character string with one character per band, consisting of integers, that gives a measure of the probability that the catalog source is variable in each band. The flag is generated by analyzing single exposure measurements in the multiframe pipeline, but does not use the level 1b flux measurements. A value of "n" indicates insufficient or inadequate data to make a variability determination. Values of "0" through "9" indicate increasing probabilities of variability. Values of "0" through "5" can generally be regarded as non-variable sources in that band. Values of "6" and "7" can be regarded as potentially variable with small amplitudes. Objects with a value of "8" or "9" are most likely flux variables in the given band. Band 3 was not flagged in the 3-Band Cryo release due to the difficulties in dealing with multiple exposure-time changes and non-optimal linearity corrections. Thus, only W1 and W2 can have non-null values, and W3 and W4 are always "n."
Method
The method is functionally identical to the 4-band var_flg processing . This document only points out the changes in the processing between the 4-band and 3-band flagging. The main difference is the exclusion of W3 and W4 in the flagging, as well as slightly different interpolation tables and magnitude limits. As in the 4-band flagging, the following are the pre-filters used and a brief purpose of each:
| w?nm / w?ndf > 0.4 | Reliability of single-frame measurements: this helps to ensure that there is a detection of the source in the level 1b image. These parameters ensure that at least 40% of the frames have a single-exposure 3σ detection at the location of the source in the multiframe image. However, this does not ensure that there are also Level 1b flux detections for the source, as the Level 1b and the multiframe fluxes are measured at slightly different positions. |
| w?nm > 4 | This helps to ensure significant single-frame detections in the case of low depth of coverage. |
| cc_flags = 0 or cc_flags = [a-z] in at least one band | Artifacts, especially diffraction spike artifacts, can produce variability since the artifact location and intensity can vary between frames. Variability flagging is unreliable in the presence of artifacts and is avoided. Lower-case artifact flags, denoting contaminated, but not spurious sources, and accepted as many sources are over flagged. |
| w?ndf > 6 | Small depth of coverage produces unreliable statistics since outliers have a larger effect on the overall variability. This filter helps to ensure the variability is significant. |
| w?snr > 5 | The coadd SNR must be significant, otherwise there will be no Level 1b detections. This filter ignores sources which are too faint to have any Level 1b detections. |
| na = 0 | Eliminates sources with active deblending, which indicates one more more close neighbors which can produce false variability. |
| w?sigmpro not null | There must be a multi-frame detection of the source in the band. |
Magnitude range
3.5 < w1mpro < 17.75
3.5 < w2mpro < 16.50
| Effective magnitude range for reliability of variability statistics. See discussion below. |
The standard deviation of the population, σ, is determined in each band by taking the 65th percentile of w?sigp1 in magnitude bins of 0.50 of approximately 5 million randomly selected sources. These distributions are saved as a look-up table as functions of M and magnitude. They are later interpolated upon retrieval. The number of sources passing the pre-filters falls off dramatically outside of the magnitude ranges listed in the above table. With insufficient data to construct the population σ for these magnitude bins, sources outside of this range are given the value of 'n' for the variability flag in the appropriate band.
Below are the interpolation tables used in generating σ:
The first component of the variability flag, Fσ, is computed in the same manner as the all-sky release, using the new tables above.
The second component of the variability flag is the band to band correlation significances, Fc. The band to band correlations are calculated in the multiframe pipeline and given as a percentage in the columns rho12 and rho23. Since W3 is not used in the flagging, rho23 is ignored. However, the column is still available for use. The well-motivated user who wants to find W3-only variables might find this column useful. Given the aforementioned non-linearity issues, however, only very high-amplitude W3 variation is significant. The correlation significance per band, Fc, is equal to q12.
The final variability flag for a given band, F, is calculated from the following:
If Fσ ≥ Fc then F = Fσ
If Fσ < Fc then F = (2Fc + Fσ)/3 where F is rounded to the nearest integer and clipped at 9.
The Fσ criterion ensures that many types of variable phenomenon are correctly flagged. Low-amplitude flux variations that are significant can be missed by the band to band correlations
Results
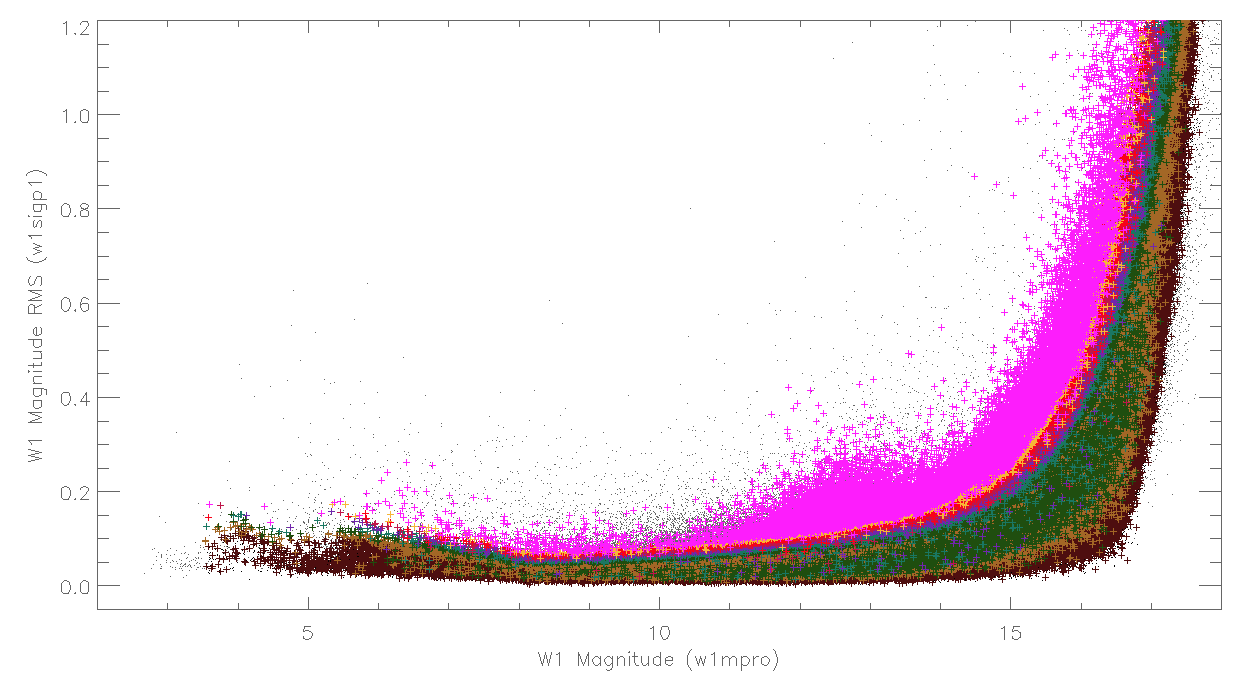
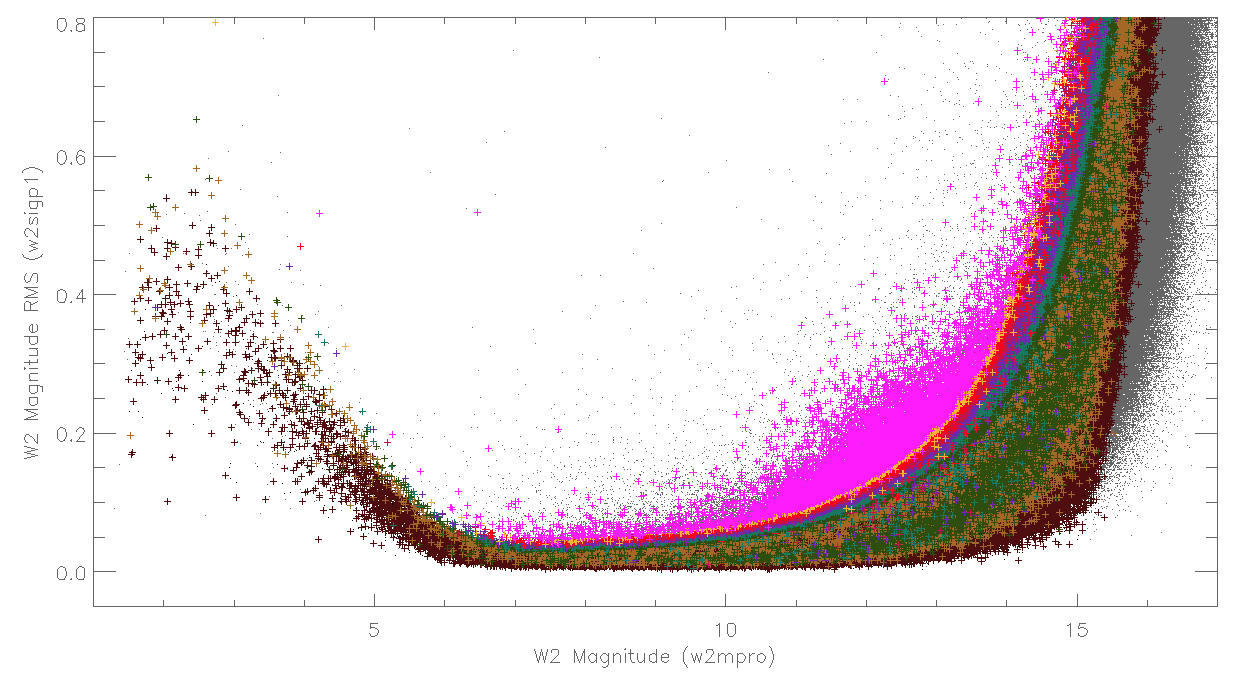
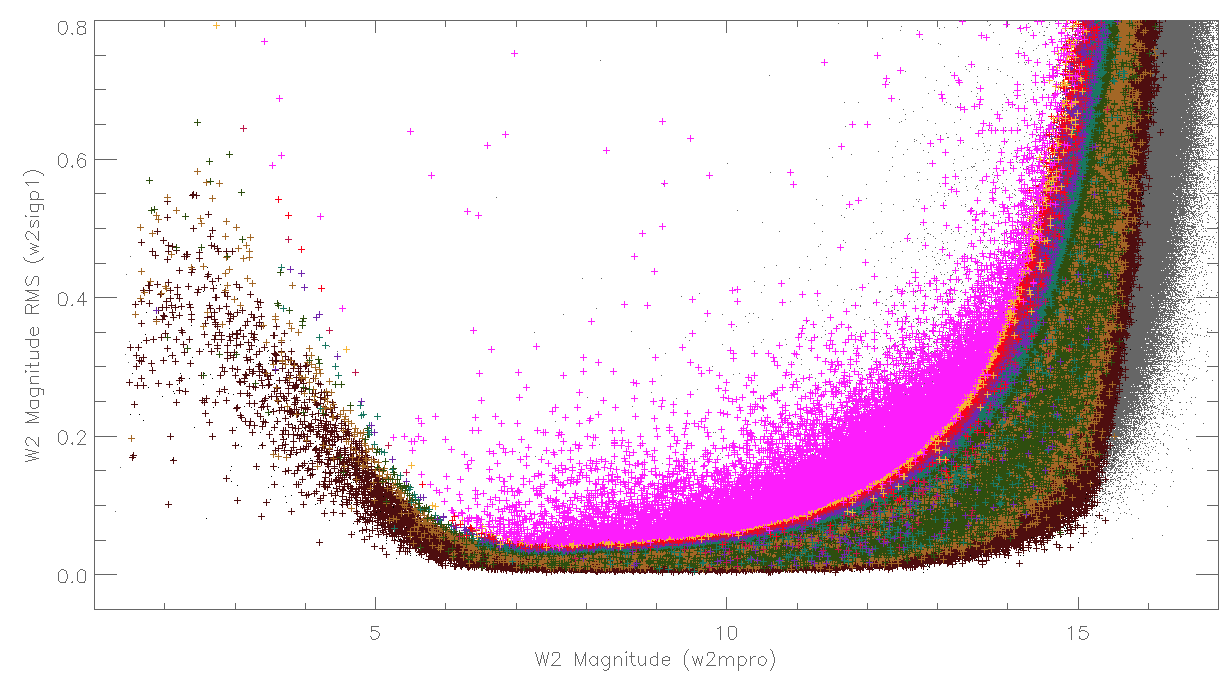
Figures 1 and 2 are graphical representations of the method applied to a large fraction of the sources in the 3-band release. In each plot, the magnitude and w?sigp1 are plotted for sources. The small grey dots are catalog sources with F = 'n', thus have inadequate or insufficient data to make a variability determination. F = 'n' sources dominate the distribution, as M ≤ 10 coverage is very common, as are artifacts, and confusion. The different colors represent different F values that are non-null, ranging from F = 0 (black) to F = 9 (magenta). Known variables are generally safely in the F = 9 region, with large amplitude variations.
Extended sources (those with ext_flg ≠ 0) tend to have characteristics consistent with true variable sources. However, these variations are usually due to poor PSF fitting on the extended or confused source and not to intrinsic variability. Thus to greatly increase reliability, one should exclude extended sources. In Figures 1 and 2, the effect of excluding extended sources is shown.
 |
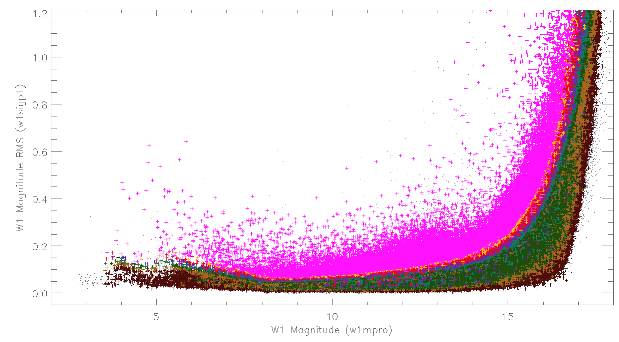 |
| Figure 1a - Plot of approximately 5 million sources from the 3-band data in band 1. Grey dots are sources with F=n. Black dots are F=0 sources. Maroon crosses correspond to low variability sources (F=1). Different colors represent different F-values to to F=9 (magenta crosses). |
Figure 1b - Same as Figure 1a, but excluding sources with ext_flg ≠ 0. |
 |
 |
| Figure 2a - Same as Figure 1a for band 2. |
Figure 2b - Same as Figure 1b for band 2. |
Out of the roughly 261 million sources in the 3-band catalog, 139,233,349 (53%) have non-null var_flg values. Sources with F > 7 can generally be regarded as safely variable. Sources with F = 7 have approximately a 40% false-positive rate with ext_flg = 0. The total number of sources in the catalog flagged with F > 6 in at least one band is 5,157,779 (1.97% of all catalog sources). The number of sources with F > 6 and ext_flg ≠ 0 is 4,345,226 (1.66%). Thus approximately 47% of all catalog sources have var_flg = 'nnnn', which differs greatly from the 27.7% in the all-sky 4-band release. This difference is mainly due to the lack of W3 and W4 variability flagging in the 3-band release.
Known Issues
There are some known limitations with the variability flagging algorithm, and are the same as the 4-band flagging. The list is reproduced below.
- Nebulosity around the source can create false variability. Because the multiframe and Level 1b source locations are slightly different, the multiframe measurement of the single-exposure frames is affected by slight variations in the nebulosity intensity as each frame probes slightly different locations.
- Unflagged artifacts (mostly from off-frame sources) contribute to variability.
- Flagging of artifacts is sometimes too aggressive, which leads to many F=n variability flag values where light curves are generally unaffected.
- Sources with a contaminated artifact flag (lower-case letters) generally have unreliable flux measurements, thus are more likely to be flagged as variable. Caution should be used when encountering sources flagged as both variable and contaminated with artifacts.
- A close companion can increase the noise of the measurements, increasing the variability. This is reduced greatly by the na constraint, but some still make it through.
- Sources with ext_flg > 0 can have unreliable variability flagging due to poor PSF fitting.
- The population distribution of w?sigp1 does not follow a gaussian or chi-square distribution, but is close to a chi-square. The upper-percentile cut for σ is a correction. Fainter magnitudes tend to more closely follow a chi-square distribution. See the next section for more details.
- The method is not sensitive to short-lived, low-amplitude, transient events.
- Sources that are saturated can be falsely flagged as variable. This is due to inaccurate PSF matching of the wings. For maximum reliability, exclude saturated sources.
Using the Variability Flag in Searches
When incorporating the variability flag into catalog searches, remember that the flag is a string. The user will likely need to make use of SQL code in searches. For example, to limit your search to sources with F > 7 in W1 and F > 5 in W2, the search string after the "where" clause would be: "var_flg[1]='[8-9]' and var_flg[2]='[6-9]'". The search "var_flg matches '[8-9][6-9]??'" would also execute the same search in a more compact form. In most cases, it is best to place a constraint on both W1 and W2 to lower the likelihood of one of the known issues driving the variability.
For maximum reliability of identifying variable sources, one should also pick sources that have ext_flg = 0. This will exclude extended sources and sources will high chi-squares due to confusion and unflagged artifacts. Requiring high q12 values also increases reliability, especially for periodic variables. Saturated sources can also have unreliable flux measurements and can be falsely flagged as variable. Thus, a very reliable search for variables in band 1 would be: "var_flg[1] = '9' and ext_flg = 0 and q12 = 9 and w1mpro > 8".
Last update: 2012 July 26