


Although not official requirements for AllWISE, the original WISE astrometric requirements remain guidelines and are repeated here for reference. The WISE Level 1 astrometric requirements state:
"The root mean square error in WISE catalog positions with respect to 2MASS catalog positions shall be less than 0.5 arcsec, for sources with SNR > 20 in at least one WISE band, where the noise includes flux errors due to zodiacal foreground emission, instrumental effects, source photon statistics, and neighboring sources. This requirement shall not apply to sources that are superimposed on an identified artifact."
A Level 4 requirement clarifies that the 0.5 arcsec accuracy applies to each axis (that is, R.A. or Declination independently).
Note that the original WISE astrometric requirements were with respect to the 2MASS catalog and that catalog includes no proper motions to account for the decade between the 2MASS and WISE epochs. Tying the WISE solution directly to 2MASS meant that the effects of systematic proper motion shifts between the two catalog epochs, which approached 200 mas in some sky positions, was imprinted on the All-Sky positions. AllWISE addresses this issue by making use of proper motion data from the UCAC4 catalog to adjust 2MASS positions before they are used as reference stars. Limiting the reference stars used to those which have good quality UCAC4 proper motions reduced the number of reference stars available below the 2MRef subset of 2MASS used for All-Sky but this was offset by the use of frame overlap information (see section V.2.b for a description of MFPRex).
In order to evaluate the AllWISE catalog astrometry relative to the International Celestial Reference Frame (ICRF), AllWISE is compared to three sets of references:
Moving from reference sets 1 to 3, the astrometric quality increases as the number of available references drops. Taken as a whole they provide a good picture of the quality of the AllWISE catalog astrometry overall, as well as how it varies with magnitude and position on the sky. A direct comparison to 2MASS is not included since in order for it to be meaningful UCAC4 proper motions would have to be added anyway. Adding those proper motions to the UCAC4 positions provides a higher quality reference set than adding them to the 2MASS positions. In keeping with the mandate to use 2MASS as the reference catalog, this was not done during AllWISE processing itself.
Selection criteria for the two levels of UCAC4 proper motion quality are as follows:
The heavy cull ("hvyPMcul") selection criteria includes:
The minimum cull ("minPMcul") set applies the same selection criteria but without the magnitude constraint.
Matching the selected UCAC4+pm sources to the AllWISE catalog resulted very large global set of matches with ~64 million for minPMcul and ~10 million for hvyPMcul. Note that the hvyPMcul matches are also included in the minPMcul set.
Figure 1 plots magnitude (w1mpro) histograms of the minPMcul set in blue and the hvyPMcul set in red. Note that the former extends out to nearly a w1mpro value of 16, whereas the latter drops out around magnitude 13.
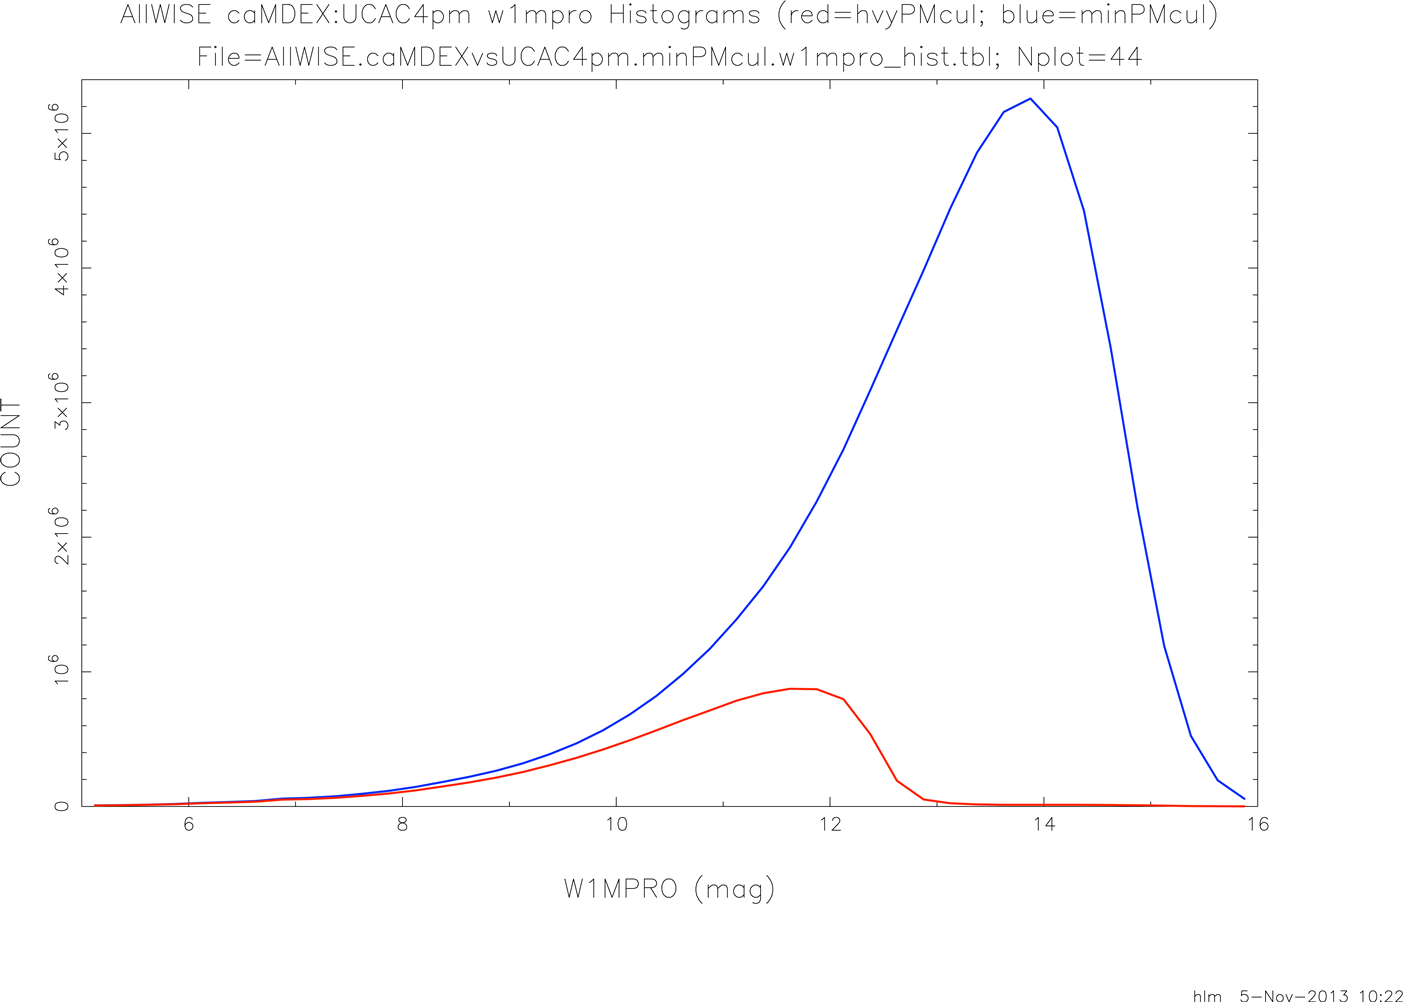 |
| Figure 1 - Magnitude (w1mpro) histograms of the minPMcul set in blue and the hvyPMcul in red |
Histograms of dRA AllWISE-UCAC4+pm differences comparing the hvyPMcul matches (red) with the minPMcul matches (blue) are presented in Figure 2. In order to make this a more meaningful comparison the two histograms have been normalized to have the same area under the curve (100,000). It can be easily seen that the hvyPMcul is better. The sigma has decreased from 157.0 mas down to 86.2. Mean values for dRA remain small at -5.9 mas for minPMcul and -3.1 mas for hvyPMcul. Figure 3 repeats with a dDEC histogram comparison showing very similiar results. Here the sigma drops from 158.2 mas to 86.9 and the mean remains small at 6.4 mas for minPMcul and 7.6 for hvyPMcul.
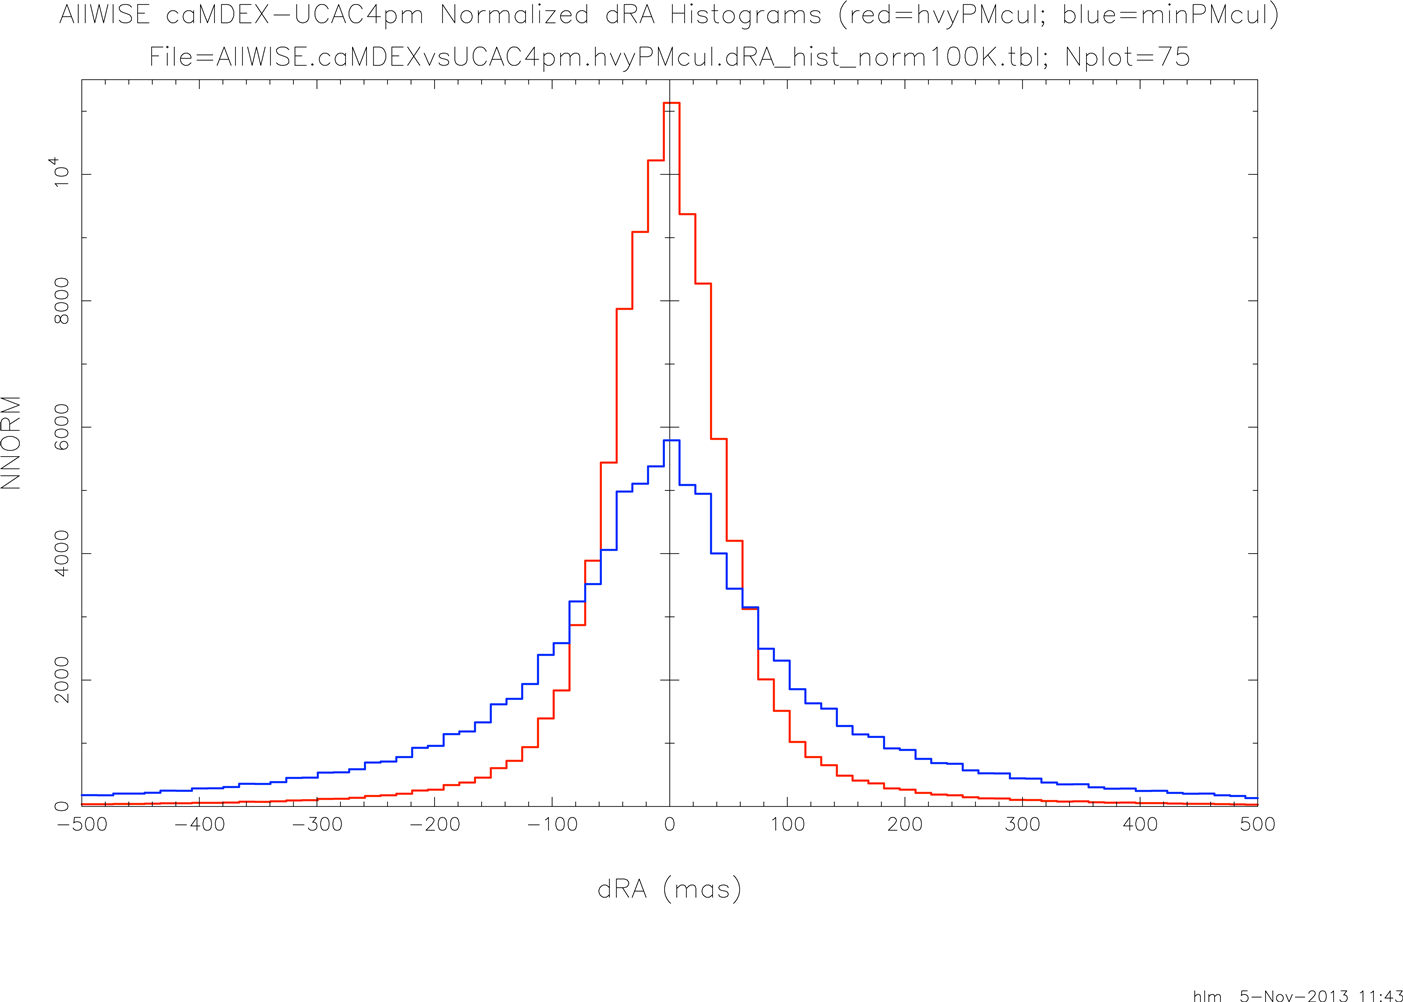 | 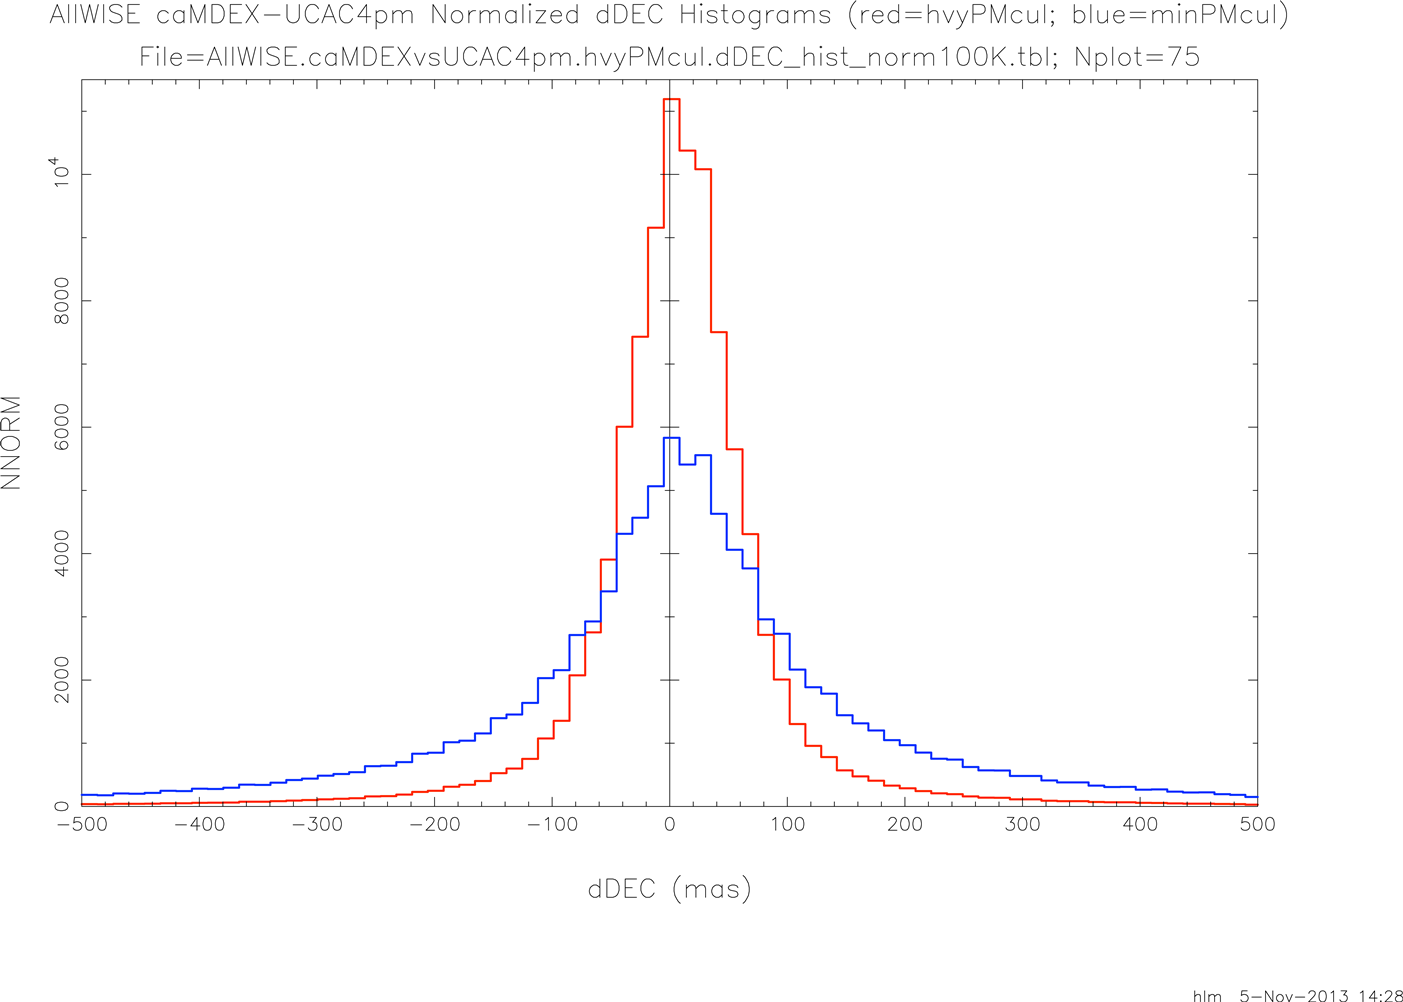 |
| Figure 2 - Normalized AllWISE-UCAC4+pm dRA difference (mas) histograms with minPMcul set in blue and hvyPMcul in red | Figure 3 - Normalized AllWISE-UCAC4+pm dDEC difference (mas) histograms with minPMcul set in blue and hvyPMcul in red |
Figure 4 and Figure 5 address the question of whether there are any magnitude dependent biases present in the AllWISE catalog positions for RA and DEC, respectively. In each case mean differences for the hvyPMcul are plotted in red and for minPMcul in blue, both vs magnitude (w1mpro). Note that the hvyPMcul and minPMcul results are in good agreement up to the point where hvyPMcul drops out near w1mpro=13. This agreement lends credibility to the minPMcul mean differences which extend out another three magnitudes. Overall the biases are not large but are most noticeable at the bright end.
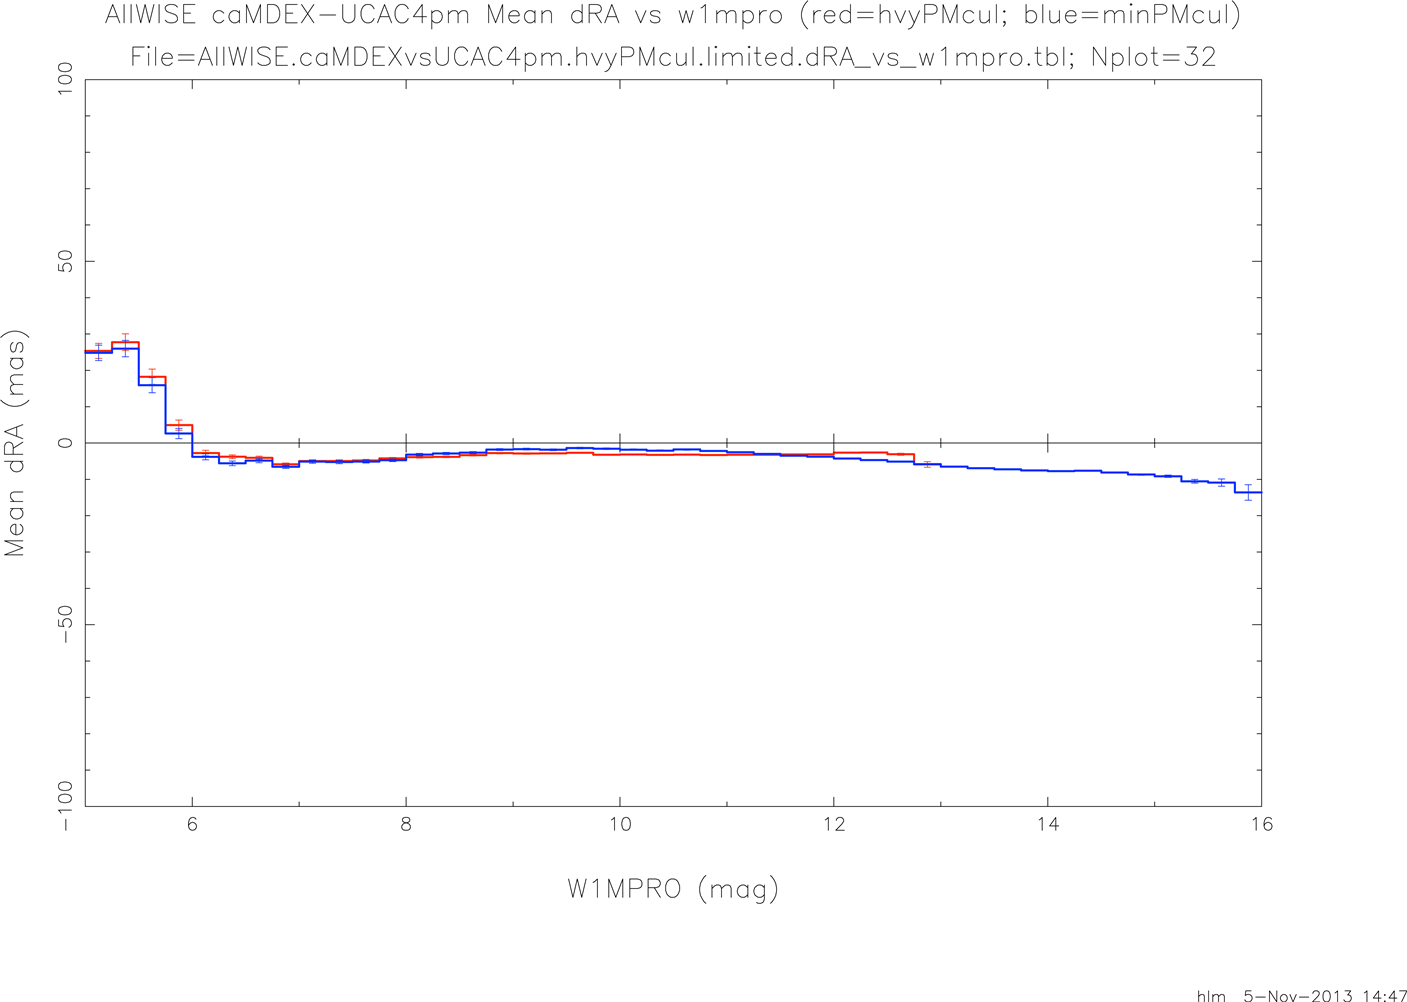 |  |
| Figure 4 - Mean AllWISE-UCAC4+pm dRA difference (mas) vs magnitude (w1mpro) with minPMcul set in blue and hvyPMcul in red | Figure 5 - Mean AllWISE-UCAC4+pm dDEC difference (mas) vs magnitude (w1mpro) with minPMcul set in blue and hvyPMcul in red |
Figure 6 and Figure 7 present the corresponding measured sigmas with the same color coding for RA and DEC, respectively. The sigma plots for the two axes are very consistent. For both hvyPMcul and minPMcul along both axes there is a bump at the bright end (w1mpro<6). Sigma values reach a minimum between 6 and 7 and then ramp up slowly. The minPMcul values do not drop as low as the hvyPMcul values and the increase is steeper with increasing magntude.
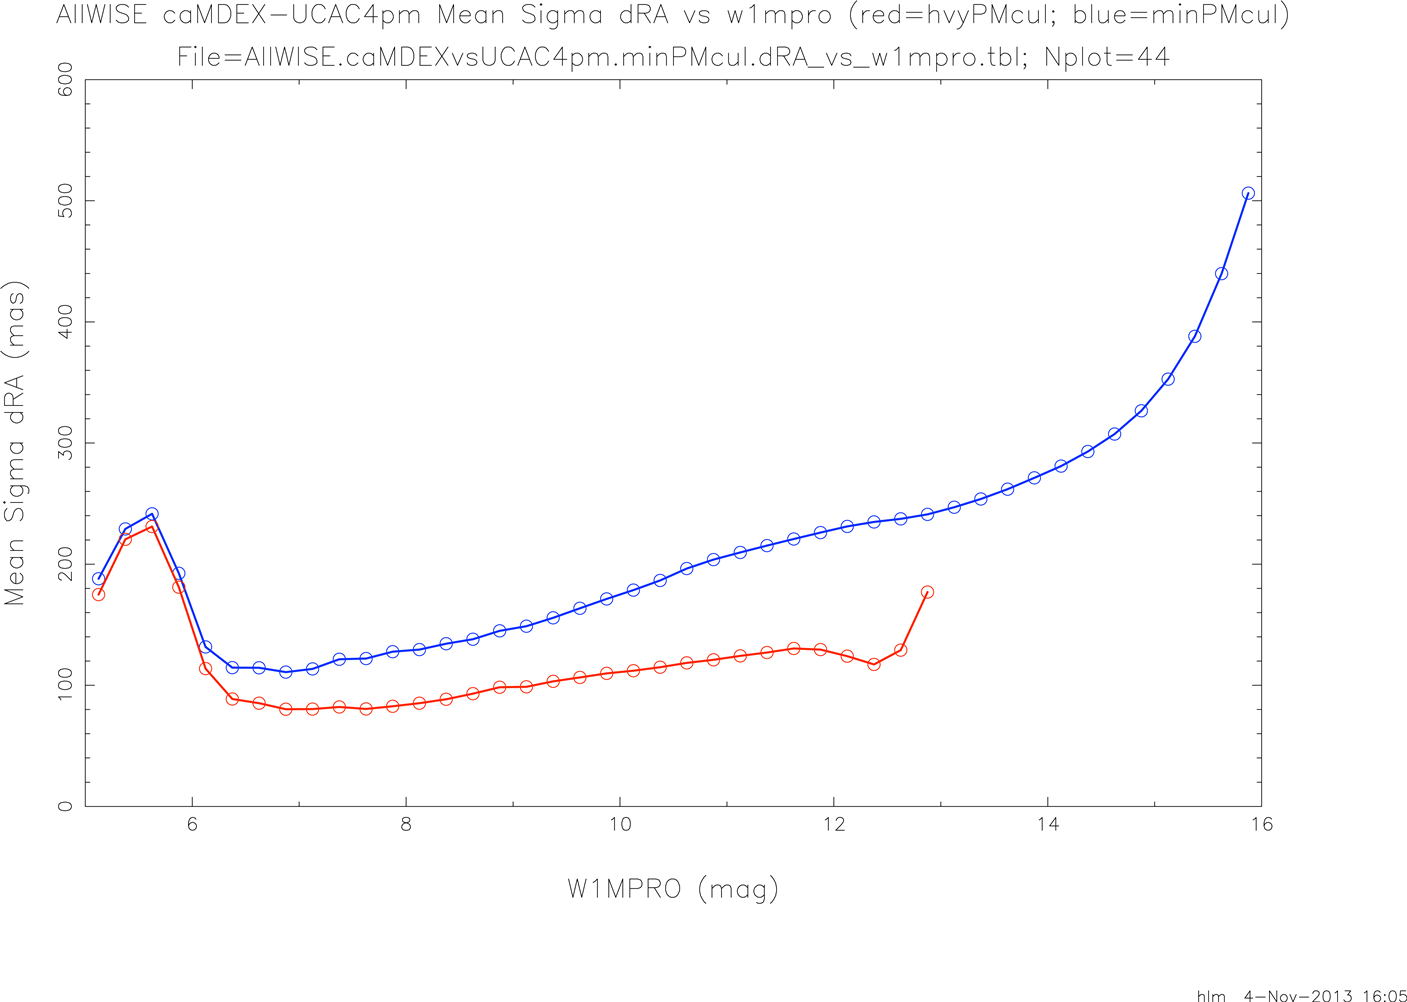 |  |
| Figure 6 - Mean AllWISE-UCAC4+pm dRA difference sigma (mas) vs magnitude (w1mpro) with minPMcul set in blue and hvyPMcul in red | Figure 7 - Mean AllWISE-UCAC4+pm dDEC difference sigma (mas) vs magnitude (w1mpro) with minPMcul set in blue and hvyPMcul in red |
In order to investigate AllWISE catalog position biases as a function of sky position the nearly 10 million AllWISE:UCAC4+pm position differences from the hvyPMcul set were broken down by tile with means and sigmas computed for each tile. Figure 8 and Figure 9 present global color coded maps in galactic coordinates for the mean dRA and dDEC differences, respectively. Note that the amplitude of the color coded scales is less than 50 mas and that the majority of tile means have an amplitude less than 20 mas. This constitutes a large improvement over the global All-Sky Release Catalog astrometry.
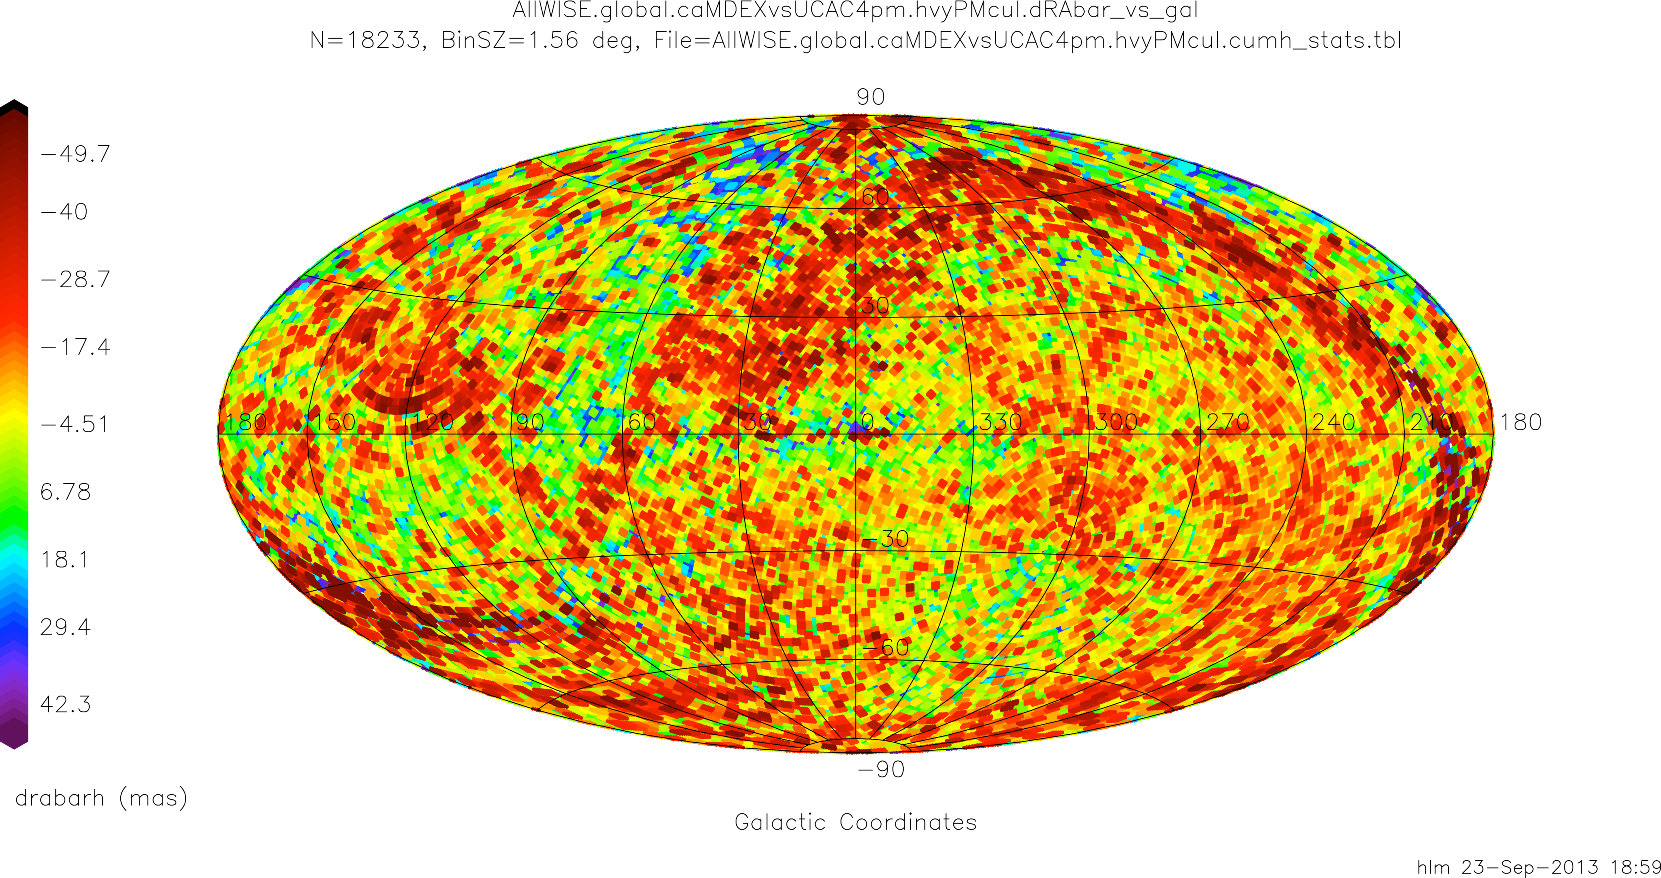 |  |
| Figure 8 - Tile-level AllWISE-UCAC4+pm mean dRA difference (mas) vs global sky position in galactic coordinates | Figure 9 - Tile-level AllWISE-UCAC4+pm mean dDEC difference (mas) vs global sky position in galactic coordinates |
Figure 10 and Figure 11 present the corresponding global plots of mean tile-level AllWISE:UCAC4+pm position difference sigmas for RA and DEC, respectively. The two figures are very similar indicating position quality in two axes are essentially the same with maximum amplitudes near 180 mas. More typical values are around 75 mas.. The most prominate feature on both plots shows increased sigmas in the high density regions near the galactic center.
 | 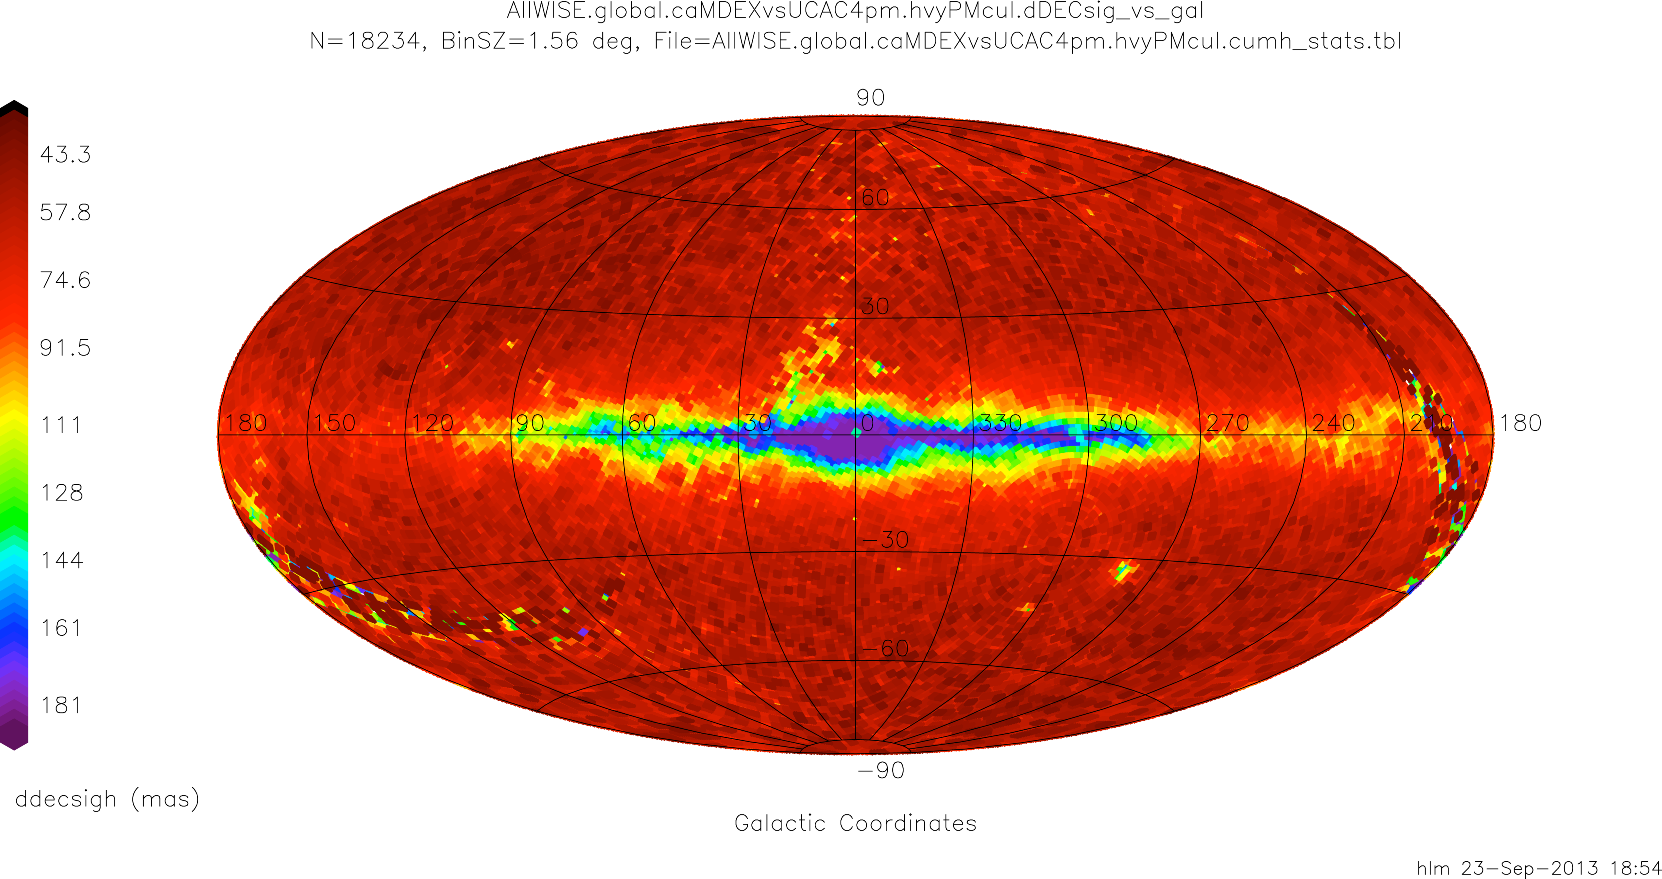 |
| Figure 10 - Tile-level AllWISE-UCAC4+pm mean dRA difference sigma (mas) vs global sky position in galactic coordinates | Figure 11 - Tile-level AllWISE-UCAC4+pm mean dDEC difference sigma (mas) vs global sky position in galactic coordinates |
Matching AllWISE to quasars provides direct measure of how good the AllWISE catalog positions are w.r.t. the ICRF. They have the huge advantage that any possible proper motions can be ignored due to their great distance. In order to get a pristine set of AllWISE:quasar matches the following selection criteria were used:
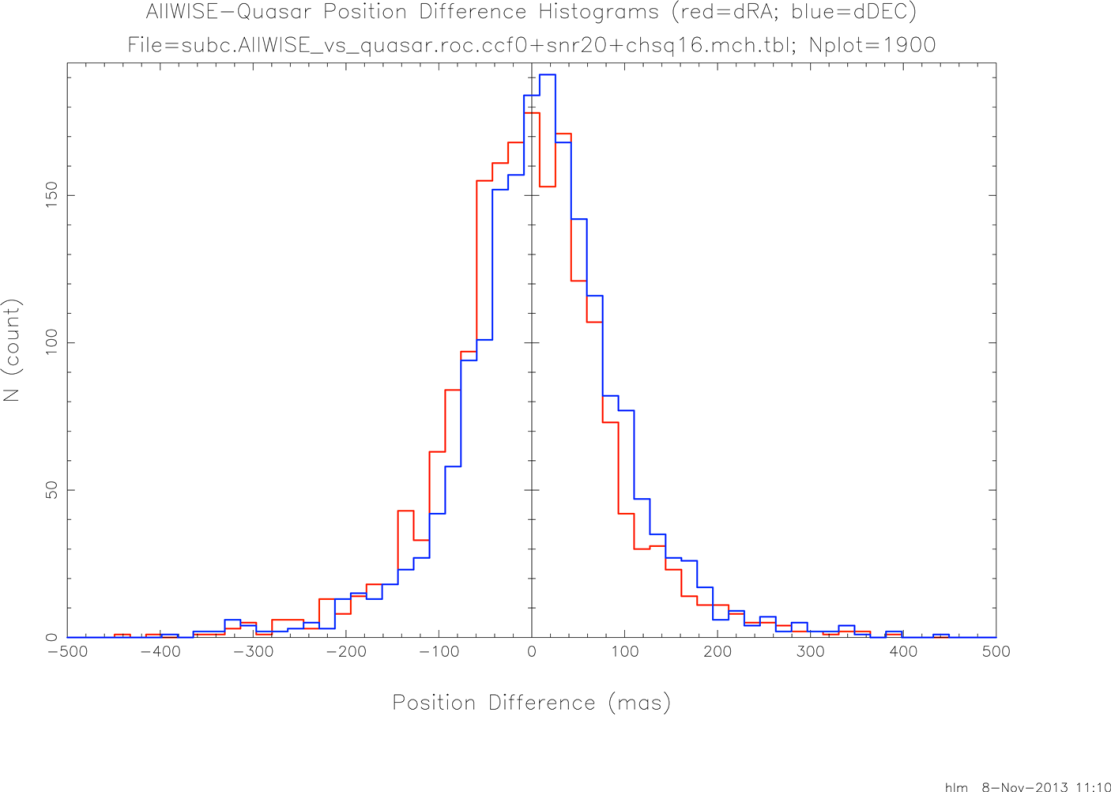
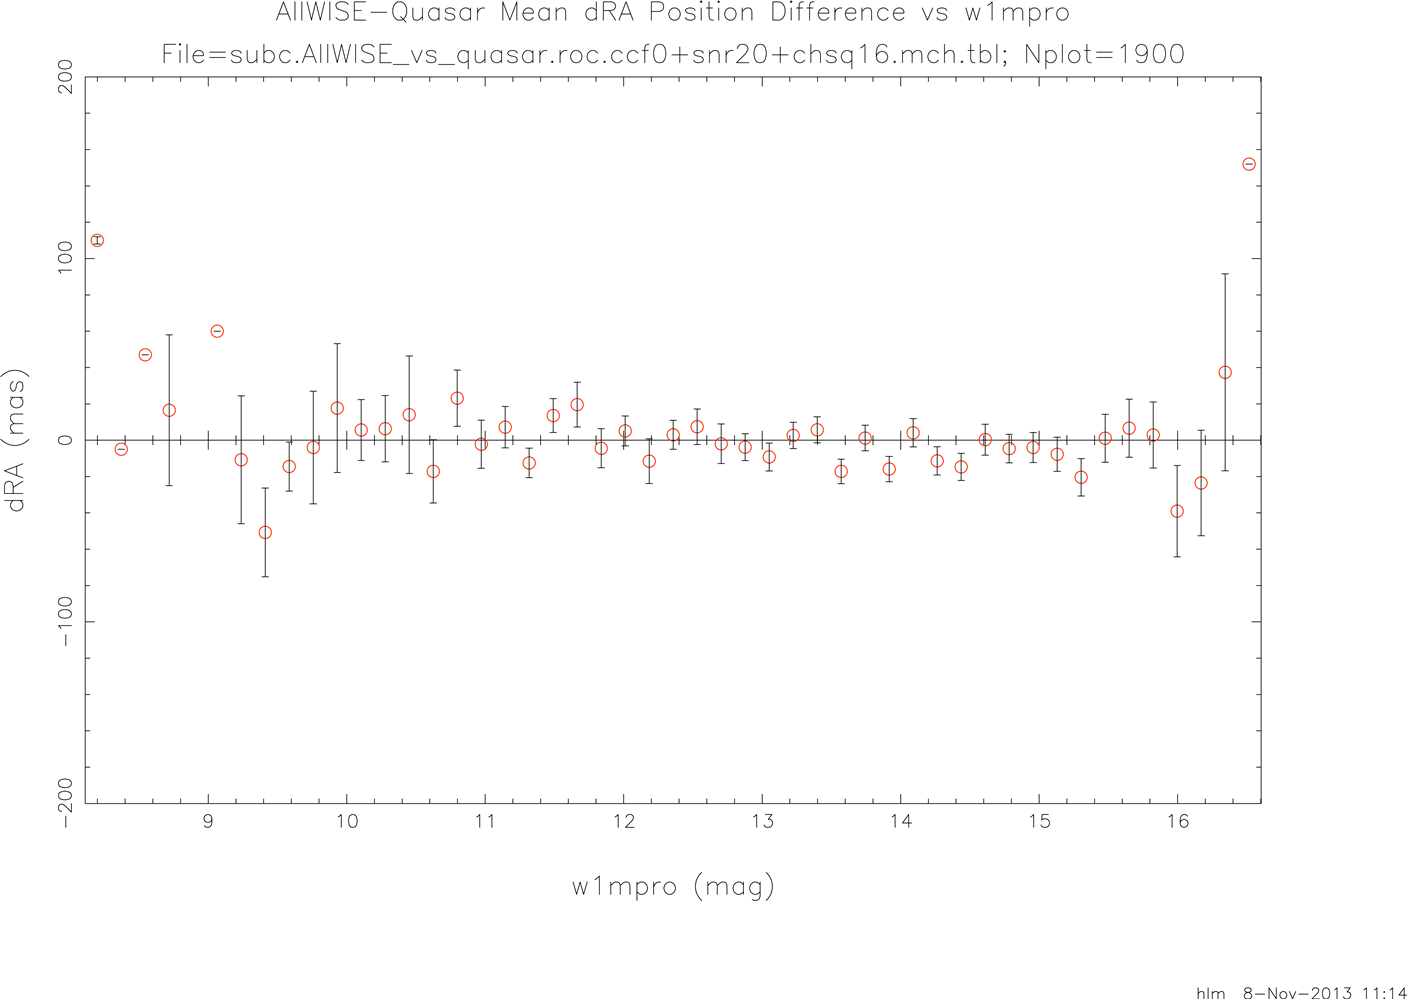
This resulted in 1,900 AllWISE:quasar matches which were used to generate the plots to follow. Figure 12 presents AllWISE-quasar position difference histograms for dRA (red) and dDEC (blue). The corresponding stats are dRA (mean=-4.5 mas; sigma=90.2 mas) and dDEC (mean=10.1 mas; sigma=91.6 mas). Figure 13 and Figure 14 plot mean AllWISE-quasar differences vs magnitude (w1mpro) in RA and DEC, respectively. Note that the AllWISE:quasar matches don't kick in until around a w1mpro magnitude of 8 and extend a little beyond magnitude 16, There is no indication of systematic position biases over that range.
 |
 |
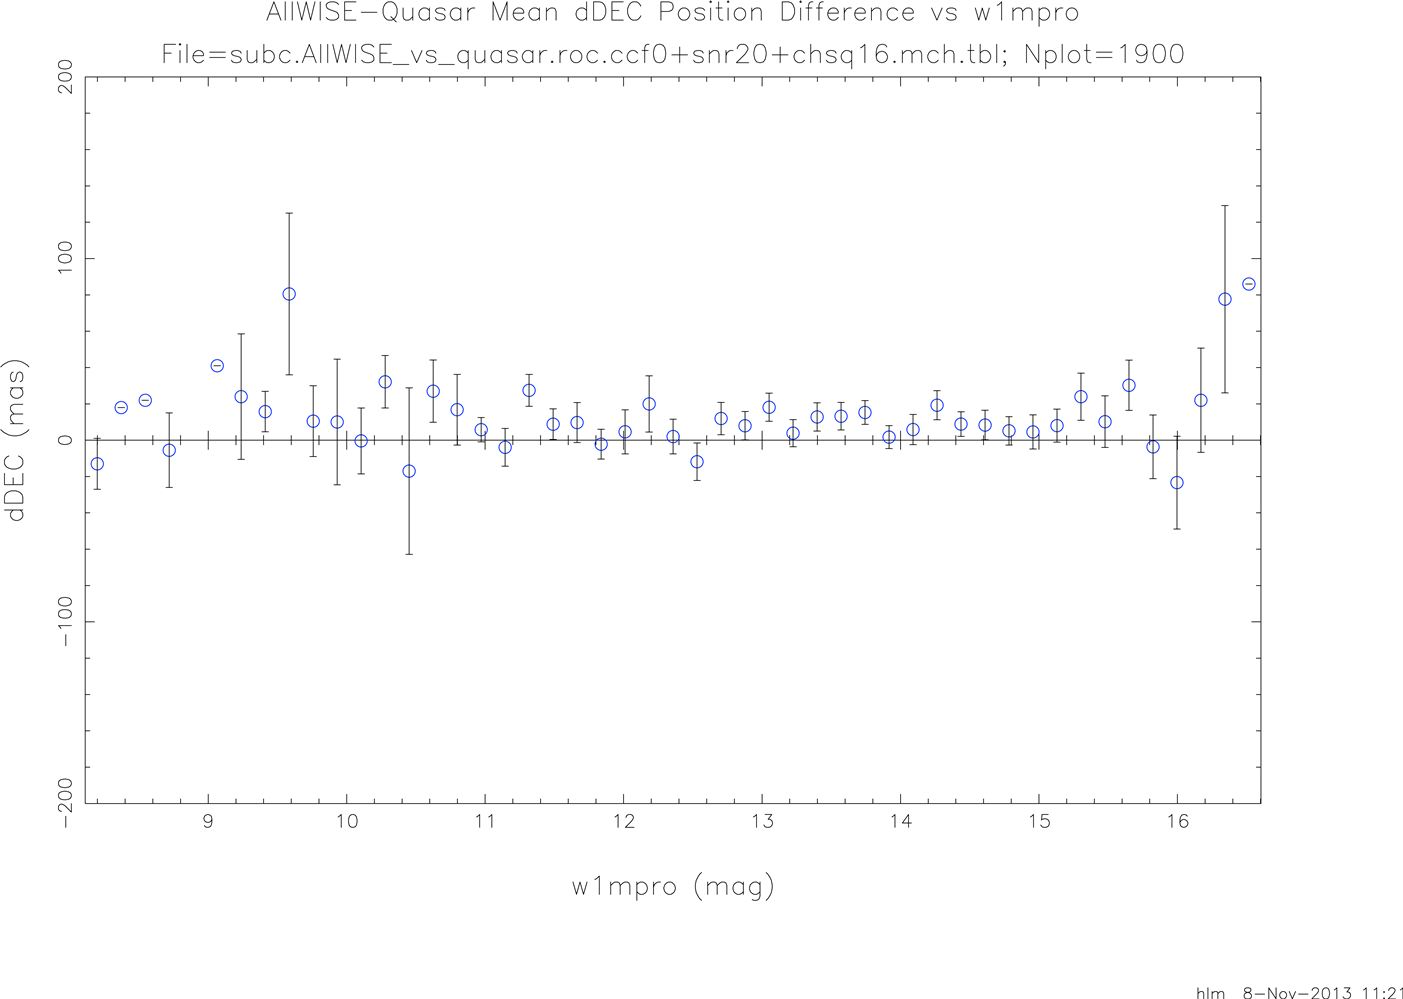 |
| Figure 12 - AllWISE-quasar position difference (mas) histograms with dRA in red and dDEC in blue | Figure 13 - Mean AllWISE-quasar dRA position difference (mas) vs magnitude (w1mpro) with vertical bars indicating sigma of the mean | Figure 14 - Mean AllWISE-quasar dDEC position difference (mas) vs magnitude (w1mpro) with vertical bars indicating sigma of the mean |
Figure 15 presents a log10 plot of AllWISE:quasar mean radial difference values vs magnitude in black along with corresponding AllWISE:UCAC4+pm plots for hvyPMcul (red) and minPMcul (blue). The floor for the quasar log10 difference values is about 1.7 which corresponds to 50 mas. The intrinsic position errors for the quasars is extremely small; intrinsic errors for the hvyMcul selected from UCAC4+pm are greater and the errors for minPMcul are greater yet. Since the mean radial difference values reflect the reference catalog errors as well as the AllWISE errors this progression makes sense. It's also possible that some of the improvement seen for the AllWISE:quasar matches over the AllWISE:UCAC4+pm matches is driven by a more stringent selection of matches used.
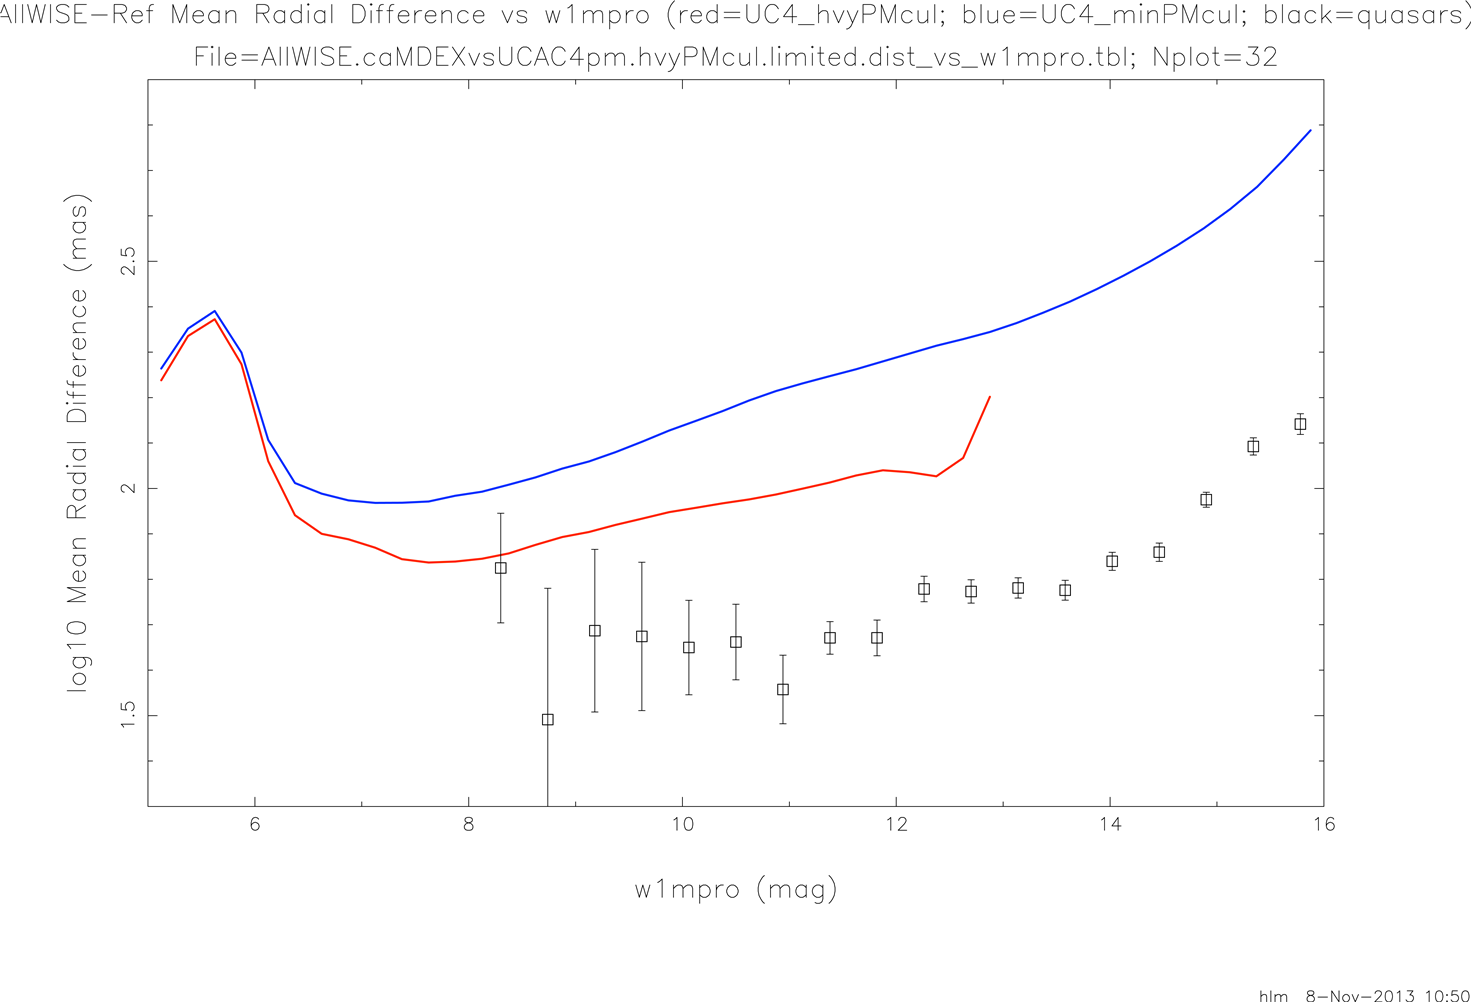 |
| Figure 15 - Log10 of mean radial AllWISE position difference (mas) vs magnitude (w1mpro) with respect to UCAC4+pm (minPMcul) set in blue, UCAC4+pm (hvyPMcul) in red and quasars in black. |
Although the individual band-frame alignments feed the frame-level MDEX positions, due to the way multi-band positions are generated no individual band source positions are output. In order to evaluate band-to-band alignments, the single band-frame SDEX source positions were mapped onto the sky using the final MFPRex band-frame positions and then differenced. Since this is a resource-intensive operation it was executed on only a randomly selected 5% of the MFPRex bundles. Statistics were generated for the W2-W1, W3-W1 and W4-W1 differences in X and Y frame coordinates (dXf and dYf). That 5% selection resulted in 177.2 million W12 matches taken from 134,200 frames sets. For W13 these numbers were 7.9 million matches from 90,386 frames and for W14 1.0 million matches from 70,982 frames.
Normalized histograms of the position difference values for W2-W1 (blue), W3-W1 (green) and W4-W1 (red) are plotted in Figure 16 for dXf and Figure 17 for dYf. One thing these plots bring home immediately is how much the scatter goes up as the wavelength increases.
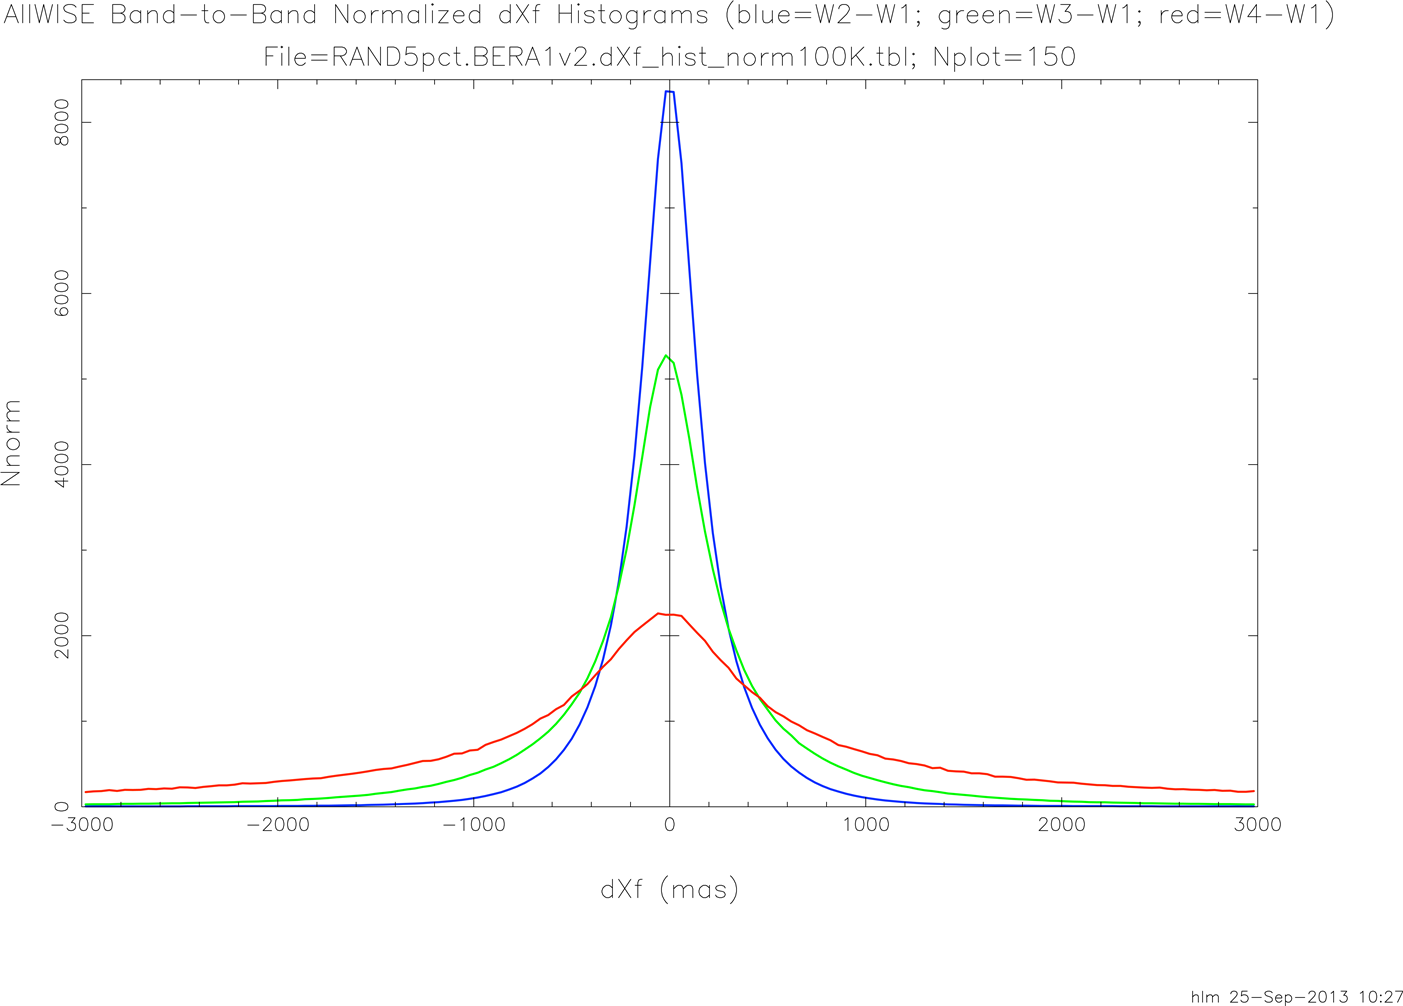 | 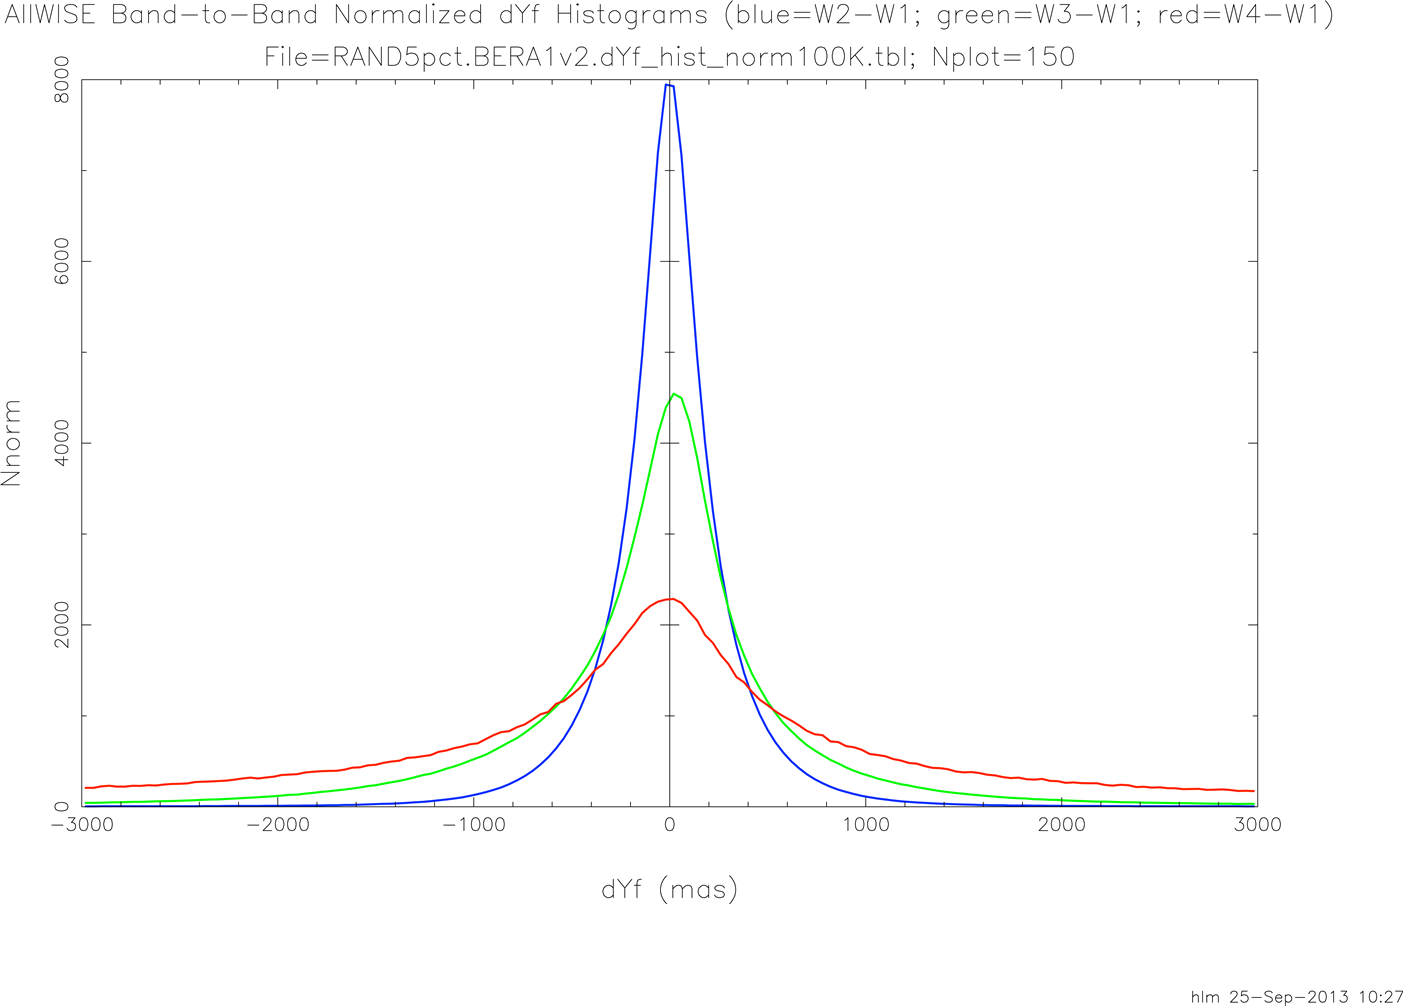 |
| Figure 16 - Normalized band-to-band dXf position difference (mas) histograms with W2-W1 in blue, W3-W1 in green and W4-W1 in red. | Figure 17 - Normalized band-to-band dYf position difference (mas) histograms with W2-W1 in blue, W3-W1 in green and W4-W1 in red. |
A table of means and sigmas for the various band-to-band combinations follows:
| mean dXf | sigma dXf | mean dYf | sigma dYf | |
|---|---|---|---|---|
| W2-W1 | 0.2 mas | 296.3 mas | -6.1 mas | 312.0 mas |
| W3-W1 | -15.5 mas | 641.6 mas | -65.6 mas | 716.1 mas |
| W4-W1 | -18.4 mas | 1139.5 mas | -71.8 mas | 1162.5 mas |
Unfortunately, the mean dYf values for W3-W1 and W4-W1 are not much better than they were for All-Sky, despite efforts to improve them. Fortunately, the effect is generally quite small since most source positions are dominated by W1. It should be kept in mind for sources only showing up in the longer wavelengths. Given that frame reconstruction is done using W1 sources it could result in a small bias for long-wavelength-only sources.
Torque-rod activation area difficulties are discussed in section IV.2.c.i. Basically, in these limited areas (one in the north; one in the south), a number of smeared frames slipped through QA resulting in, among other things, astrometry problems, particularily at the frame level. A complicating factor is that many of the frames involved have strongly magnitude-dependent source position shifts not seen in normal frames. Therefore the frame adjustments done in MFPRex, which use only brighter sources, are unable to null the biases at the faint end, which can reach several tenths of an arc-second. Fortunately the effect is somewhat mitigated when multiple frames are combined to generate the AllWISE catalog positions. Another consequence of these biased source positions at the frame level is that they can result in spurious motions being computed in low coverage areas.