The 2MASS Galaxy Catalog
The extended source catalog (XSC) contains over 1.6 million spatially
resolved astronomical sources: primarily >98% galaxies, and to a lesser
extent Galactic diffuse nebulae, H II regions, stellar clusters, planetary
nebulae and young stellar objects. The galaxy catalog was constructed to
satisfy the survey science requirements (Jarrett et al 2000a), most important
being the reliability (~99%) and completeness (>90%) for unconfused regions
of the sky, |b| > 20 deg. These requirements are achieved for sources brighter
than Ks = 13.5 mag (~2.7 mJy) and resolved diameters larger than ~10-15 arcsec.
The differential source counts,
Figure 3, illustrate the depth and areal coverage
of the 2MASS galaxy catalog for unobscured regions of the sky. The Ks-band
counts linearly increase to the faint-end limit ~14 mag, where the faint end is supported by the more
sensitive J-band observations (which appear to be complete down to 15.3 mag).
Morphology -- As a function of Hubble or morphological type, 2MASS is most
sensitive to early-type spirals and ellipticals (whose light is dominated
by the older population of stars emitting in the near-infrared), and less
sensitive to late-type spirals (whose light is dominated by the younger,
hotter disk population), dwarfs (low surface brightness) and compact objects
(resolution limitations of 2MASS); see Jarrett (2000), Bell et al (2003), and Jarrett et al (2003).
Consequently, the 2MASS galaxy catalog is partial to
"old" galaxies,
which are typically lower in mass-to-light compared to gas-rich spiral
galaxies (see also Rines et al 2004 for a 2MASS study of the M/L ratio
for clusters and inter-cluster regions).
Zone of Avoidance -- A primary science driver of 2MASS was to penetrate
the dust mask of the Milky Way. At near-infrared wavelengths, the opacity
of dust is significantly smaller (~1/10) compared to that of optical wavelengths,
and thus amenable to penetrating observations. The Galactic "zone of
avoidance" (ZoA) is still, however, a formidable
barrier due to the sheer
number of stars that produce a foreground (confusion) "noise".
Near the center of the Milky Way the confusion noise
is extreme, blocking nearly 100% of the background light; whereas far from
the Galactic center the confusion noise is minimal and the veil of the Milky Way
is lifted at near-infrared wavelengths (see also
Kraan-Korteweg & Jarrett 2004). As is shown in
Figure 4, 2MASS
penetrates deep into the ZoA away from the Galactic Center, extracting galaxies well down to |b| ~ 5 degrees,
where detection completeness declines by ~0.5 mag (Jarrett et al 2000b).}
All Sky Galaxy Distribution -- Simply by counting the number of galaxies
along the line of sight it is a straightforward exercise to create a crude
map of the local Universe. Spatial over-densities from galaxy clusters
trace the large scale structure; see for example the beautiful maps of
Courtois et al (2004) who reconstructed the extragalactic sky using galaxies
archived in LEDA. A more instructive way to map the surface density of
galaxies is to integrate the 2µm flux from all galaxies along the line
of sight, thereby weighting the nearest structures and producing contrast
between the Local Supercluster (cf. Tully 1982; Tonry et al 2000) and the more
distant "cosmic web" structures; see
Figure 5. This technique mitigates
the biasing effects of non-uniform incompleteness due to surface brightness
differences and galaxy morphology (see above). The figure illustrates how
2MASS creates a uniform view of the local Universe, except for the extreme
Galactic Center, bridging the two hemispheres above and below the plane
of the Milky Way (center region of figure).
A further enhancement to the all sky maps is to color-code the galaxies
according to their total integrated flux.
Since the integrated flux is
strongly correlated with the distance to the object (assuming 2MASS galaxies
have roughly the same luminosity; see the next section), the color-coding
effectively adds depth to the surface density maps.
In this way a qualitative view of the 3-D galaxy distribution is created,
illustrated in Figure 6
using a Supergalactic projection. This simple
and effective method delineates real large scale structure in the local
Supercluster and beyond (Figure 6). We can marginally improve upon
the "photometric redshift" by correcting the luminosity estimate
using the K-correction deduced from the
near-infrared colors,
described in the next section.
|

Figure 3.
Total number of galaxies per deg^2 per mag
internal for |b| > 25 deg
(total area: ~24,000 deg^2).
The J, H and Ks source counts are represented with blue, green and red lines,
respectively. For comparison, the narrow (but deep) K-band galaxy counts of
Glazebrook et al (1994) and Gardner et al (1997) are shown in black.
Figure 4.
Cumulative number of galaxies per deg^2 with Galactic latitude.
Three Ks-band flux limits are shown: 12.5 (black), 13.0 mag (green) and 13.5 mag (blue).
All longitudes are used to draw the galaxy sample. For comparison,
the integrated counts per deg^2 for a field deep in the ZoA (l=50 deg,
b= 2 deg)
is indicated with a green triangle. See also
Kraan-Korteweg & Jarrettt 2004
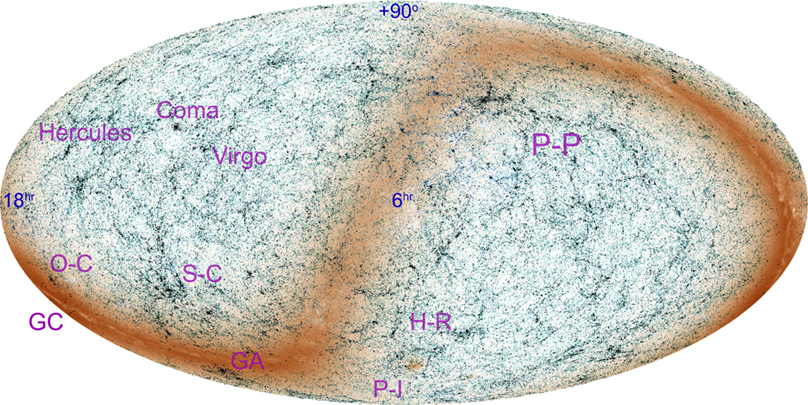
Figure 5.
Equatorial view of the 2MASS galaxy catalog
(6hr RA at center). The grey-scale represents the total integrated
flux along the line of sight -- the nearest (and therefore brightest) galaxies
produce a vivid contrast between the Local Supercluster (center-left) and
the more distant cosmic web. The dark band of the Milky Way clearly demonstrates
where the galaxy catalog becomes incomplete due to source confusion.
Some well known large-scale structures are indicated:
P-P = Perseus-Pisces supercluster, H-R = Horologium-Reticulum supercluster,
P-I = Pavo-Indus supercluster, GA = "Great Attractor",
GC = Galactic Center, S-C = Shapley Concentration,
O-C = Ophiuchus Cluster, Virgo/Coma/Hercules = Virgo-Coma-Hercules
superclusters.
The Galactic "anti-center" is front and center, with
the Orion and Taurus Giant Molecular Clouds forming the dark circular band
near the center. See also Fig. 1 for a Galactic projection of the local universe.
|
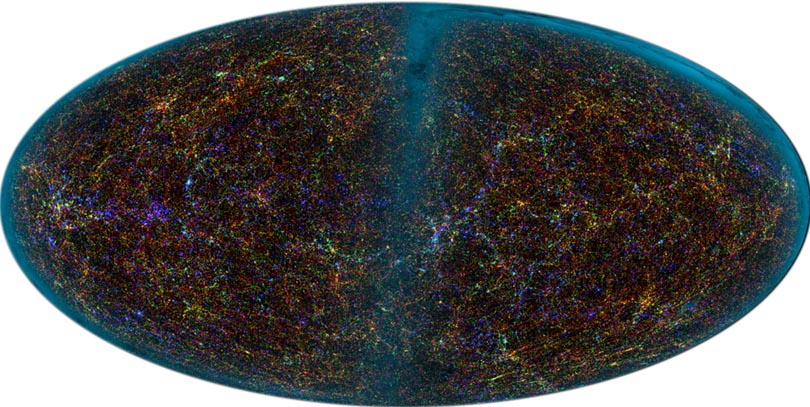
Figure 6.
Supergalactic projection of the 2MASS galaxy catalog. Sources
are RGB color-coded according to their Ks-band integrated flux: brightest
galaxies (Ks < 10) are blue, moderately bright galaxies (10 < Ks < 12.5)
are green, and the faintest (Ks > 12.5) are red. The Local Supercluster
as defined by de Vaucouleurs et al (1976) extends along the equator
crossing through the Virgo galaxy
cluster (bright blue cluster, left-center of image). The Milky
Way is shown with a cyan color scale, crossing the center of the image
and outer boundary. The Perseus-Pisces supercluster extends
from the center right (northern Galactic hemisphere) down into the ZoA
and out the other side to the southern Galactic hemisphere.
|
The Local Universe
The current generation of large and uniform redshift surveys (e.g., CfA-RS,
2dF, SDSS, 6dFGS) provide a means to construct the 3-D space density of
galaxies for volumes vastly exceeding those of the pioneering works from
the 1980's. In the coming years new "radial velocity machines," such as
Echidna (Moore, Gillingham & Saunders 2002), have the potential to increase
redshift catalogs by an order of magnitude. Nonetheless, imaging surveys,
including 2MASS, SWIRE, GOODS, and in the coming years, WISE (Eisenhard &
Wright 2003) catalog far more sources than the redshift surveys can ever
handle. Velocity measurements will always be in the position of catching
up with broad-band imaging.
Moreover, broad-band photometric redshift techniques are improving as
galaxy SEDs are expanded and refined to include the optical-NIR-MIR-FIR
windows and different Hubble Types, driven by the large surveys from
HST, SDSS and Spitzer. A three-dimensional reconstruction of the local universe
is therefore possible and within our reach using broad-band photometry from
large-scale surveys. Here we use only the 2MASS galaxy catalog to
create a first-look version of the local universe. With the coming of
optical and mid-infrared broad-band and spectroscopy surveys, this view
will sharpen and reach greater depths.
Photometric Redshifts --
The 3-band near-infrared photometry of 2MASS is
used to estimate luminosity distances to galaxies. Although this technique is
crude in terms of accuracy, it does provide a means to generate qualitative
maps of the spatial distribution of galaxies and thereby construct an all
sky "big picture" view of the local Universe. Here we adopt the technique
devised by Kochanek et al (2003). The fundamental
assumptions of this method are that galaxies have roughly (1) the same luminosity
and (2) their near-infrared colors are modified by cosmic reddening
(Figure 7).
The measured integrated flux is the
primary component, while the
near-infrared colors adds secondary information.
This method is particularly adept at revealing galaxy clusters since the
redshift uncertainty declines with the square root of the number of cluster members
detected by 2MASS. We have determined that the
photometric redshift of galaxy clusters is typically
accurate to ~20% using only 2MASS photometry.
By assuming that galaxies are standard candles, the distance or redshift
is derived from the integrated flux, distance modulus and luminosity distance.
Here we correct for Galactic extinction and incorporate the cosmic reddening
"k-correction", Figure 7,
into the distance calculation for self-consistency
between the measured colors and the inferred luminosity distance. Note that
the scatter in the color vs. redshift (Fig. 7) is large, comparable to the
k-correction itself; hence, near-infrared colors alone
are an insufficient discriminant of
distance.
Independent studies of the K-band luminosity function (Cole et al 2001;
Kochanek et al 2001; Bell et al 2003)
reveal consistent Schecter Function parameters (assuming H0 = 72 km/s/Mpc):
M* = -24.0
mag with a faint end slope index of about -0.8 to -1.0 (note that Bell et al 2003
derive a slightly flatter slope than Kochanek et al due to correction
for incompleteness in the 2MASS XSC for low surface brightness galaxies).
We adopt M* as the standard candle for 2MASS galaxies. For the faintest
2MASS galaxies, K=14 mag, the implied distance is 400 Mpc or z ~ 0.1. The
actual distribution of Ks-band luminosity for all 2MASS galaxies with known
redshifts is shown in Figure 8.
The histogram peaks at -24.4 mag or so,
implying that 2MASS is sensitive to intrinsically luminous (early-type)
galaxies. The fall-off in sources at the faint end
is due in part to the sensitivity limit of redshift surveys.
(Cautionary note: the 2MASS-NED redshift sample comes from a
variety of surveys, each with their own biased selection effects -- a prime
motivation to carry out uniform and minimally-biased redshift surveys, such
as that of the 6dFGS). Approximately 10^5 2MASS galaxies have radial velocity
measurements, representing a small fraction (~8%) of the total, but a significant
fraction for the largest (nearby) galaxies.
A comparison of the photometric-derived redshifts with radial-velocity
redshifts is shown in
Figure 9,
where we plot the redshift as a function
of the Ks-band flux.
The photometric redshifts appear to accurately
predict the mean
radial-velocity redshift per mag interval from the brightest (nearby) to
the faintest (distant) galaxies. However, note the large scatter in the
redshift distribution per mag interval -- this is due to galaxies with
intrinsically different luminosity -- from the brightest ellipticals to the
faintest dwarf galaxies. What this means is that 2MASS-only photometric redshifts
provide the correct answer on average, but for any given galaxy the uncertainty
is large, which is particularly severe for the faint end of the distribution.
And so we find that near-infrared photometric redshifts
should provide an adequate, if qualitative,
representation of the local Universe.
Combining the 10^5 radial-velocity
redshifts with the 10^6 photometric redshifts, a 3-dimensional construct
of the distribution of galaxies comprising the local Universe is created.
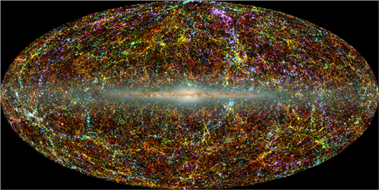
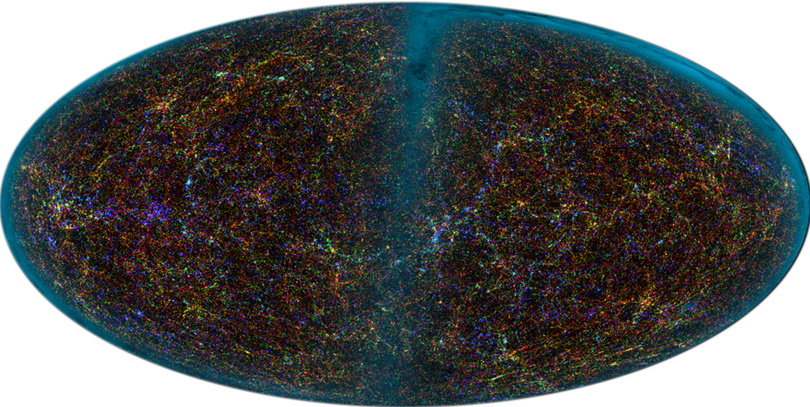
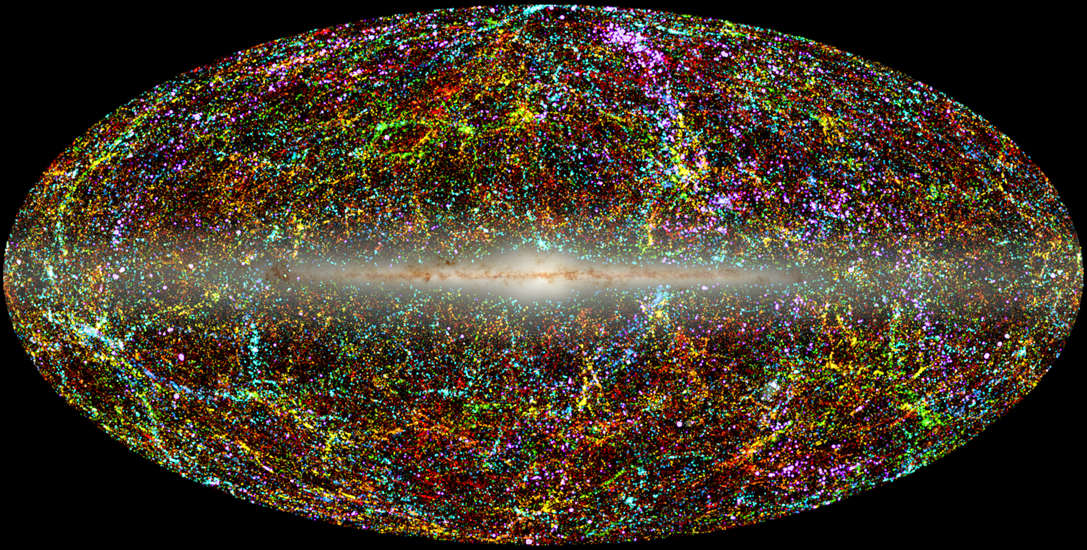
Figure 1 represents a view into this 3-D construct. Here the 2MASS galaxies
are projected onto a Galactic coordinate (equal-area) Aitoff grid with 3
arcmin pixels. Distance is denoted with color coding, where blue represents
the nearest galaxies (z < 0.01), green at moderate distances (z ~ 0.03)
and red the most distant objects (z > 0.06). To enhance the contrast between
the nearest clusters (e.g., Virgo) and the distant universe, the pixel
intensity is modified by the integrated flux along the line of sight (analogous
to
Figure 5).
The effect is to brighten the colors of nearby galaxy clusters
(e.g., the Virgo cluster appears
Finally, the
2MASS point source catalog, representing the Milky Way, is incorporated
into
the projection. Near the galactic center region (center of image),
the confusion noise completely swamps out detection of background extragalactic
objects (see Figure 1).
|
Figure 7.
Galaxy near-infrared colors as a function of redshift.
Cosmic reddening is the result of shifting of
galaxy light from the H-band (1.6 µm) into the Ks-band (2.2 µm).
The observed scatter (error bars) relative to the slope indicates that
near-infrared colors alone are an inadequate discriminant of redshift.
Figure 8.
Luminosity distribution of 92,000 2MASS galaxies as computed
from redshift-derived distances.
The redshifts were extracted from NED, the bulk of which come from the
RC3, UGC, CfA, LCRS, 2dF, 6dFGS and SDSS surveys.
The faint end of the curve is subject to incompleteness
due to the sensitivity limit of the redshift surveys.
Figure 9.
Redshift vs. 2MASS Ks-band integrated flux.
Photometric redshifts (black curve) are derived assuming L*
properties for 2MASS galaxies. These are compared to the radial-velocity
redshifts (blue points). The error bars represent the scatter in redshift
vs. Ks-band integrated flux (i.e., ranging from luminous to sub-luminous
galaxies). Note that the assumption that all galaxies have L* luminosity works
better for bright galaxies than for faint (low S/N) galaxies.
|
The Cosmic Web -- Figure 1
beautifully unveils the background extragalactic
sky from the obscuring foreground Milky Way. Galaxies are color-coded by their inferred redshift (or distance from the Sun),
thereby providing depth to the surface distribution of galaxies.
Large-scale structures are
clearly discerned, from the Local Supercluster (Virgo/Hydra/Centaurus) to
the Perseus-Pisces (P-P) and Pavo-Indus (P-I) superclusters.
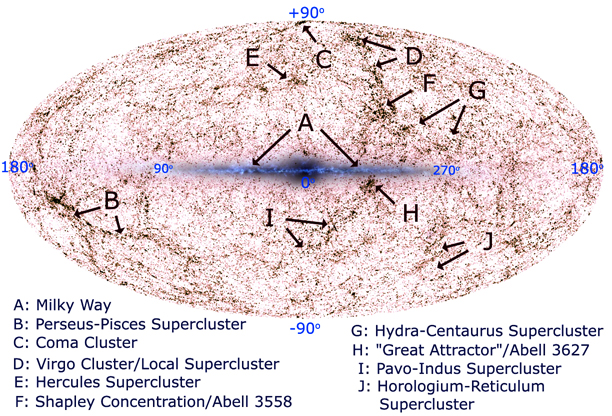
(Figure 2, a
key to the large scale structures). Probing orthogonal to this 3-D surface
reveals the redshift distibution along the line of sight; an example is shown in
Figure 10
for the Shapley Concentration (discussed below).
The strong clustering seen
at angular scales that span from arc-minutes (groups and clusters) to
several degrees (super-clusters)
confirms the
result of Maller et al (2003a) who measured
the angular correlation function of galaxies in the 2MASS XSC,
finding a slope of -0.76 with an amplitude of 0.11 at 1 degree scale
(out to four degrees). Their results also indicate that higher
surface brightness galaxies are clustered more strongly, consistent
with the finding that early-type galaxies dominate massive clusters
(the "nodes" of the cosmic web).
As seen in Figure 1, a continuous chain of structures seems
to wrap around Hydra/Virgo, up to Coma to the north, through Hercules to
the east, down through P-P and around to P-I to the west, then extending
up through the ZoA into the Shapley concentration. This is more easily
seen when each redshift layer is shown separately;
Figure 11.
The Milky Way and Magellanic Clouds occupy the first (z = 0) redshift layer.
The second layer (z < 0.01) is dominated by the Virgo, Fornax and Hydra-Cen
superclusters.
The third layer (0.01 < z < 0.02) is dominated by the P-P
supercluster (left side of image) and the P-I supercluster extending up
into the ZoA terminating as the Great Attractor region (notably Abell 3627)
disappears behind a wall of Milky Way stars. An intriguing "ring" or chain
of galaxies seems to circle/extend from the northern to the southern Galactic
hemisphere (see also
Figure 1). It is unknown whether this ring-like structure
is physically associated with the cosmic web or an artifact of projection.
The fourth layer (0.02 < z < 0.03) is
characterized by compact galaxy clusters, including Coma (extreme top of image),
Abell 3627 in the ZoA, the Ophiuchus cluster directly to the north of the Milky
Way center, and clusters associated with P-P. The "great wall" of galaxies
extends from Coma down toward Bootes and Hercules.
The fifth layer
(0.03 < z < 0.04) is dominated by the Hercules supercluster (top, left of image),
the "great wall," Columba supercluster (bottom right of image), and the
massive Shapley Concentration is beginning to appear. The sixth layer
(0.04 < z < 0.05) showcases Abell 3558 of the enormous Shapley Concentration
that lurks behind the nearby Hydra-Cen supercluster, and the Sculpter
supercluster (bottom of image) makes its first appearance.
The massive size and peculiar velocity field of the Shapley Concentration region
suggests that it may be the most dominant "attractor" in the local Universe;
indeed the IRAS PSCz dipole (Rowan-Robinson et al 2000) and
2MASS galaxy cluster dipole (Maller et al 2003b) are located
near this great structure.
The seventh layer
(0.05 < z < 0.06) contains the backside of the Shapley Concentration, while
the Sculpter supercluster dominates the southern hemisphere. The eighth and
final layer (z > 0.06) contains the most distant structures that 2MASS
resolves, including the Pisces-Cetus (located behind P-P), Bootes (located
behind Hercules), Horologium and Corona Borealis galaxy clusters. At these faint
flux levels, the photometric redshifts are losing their ability to discern
the cosmic web beyond 300 Mpc, smearing and degrading the resolution of
the 3-D construct.
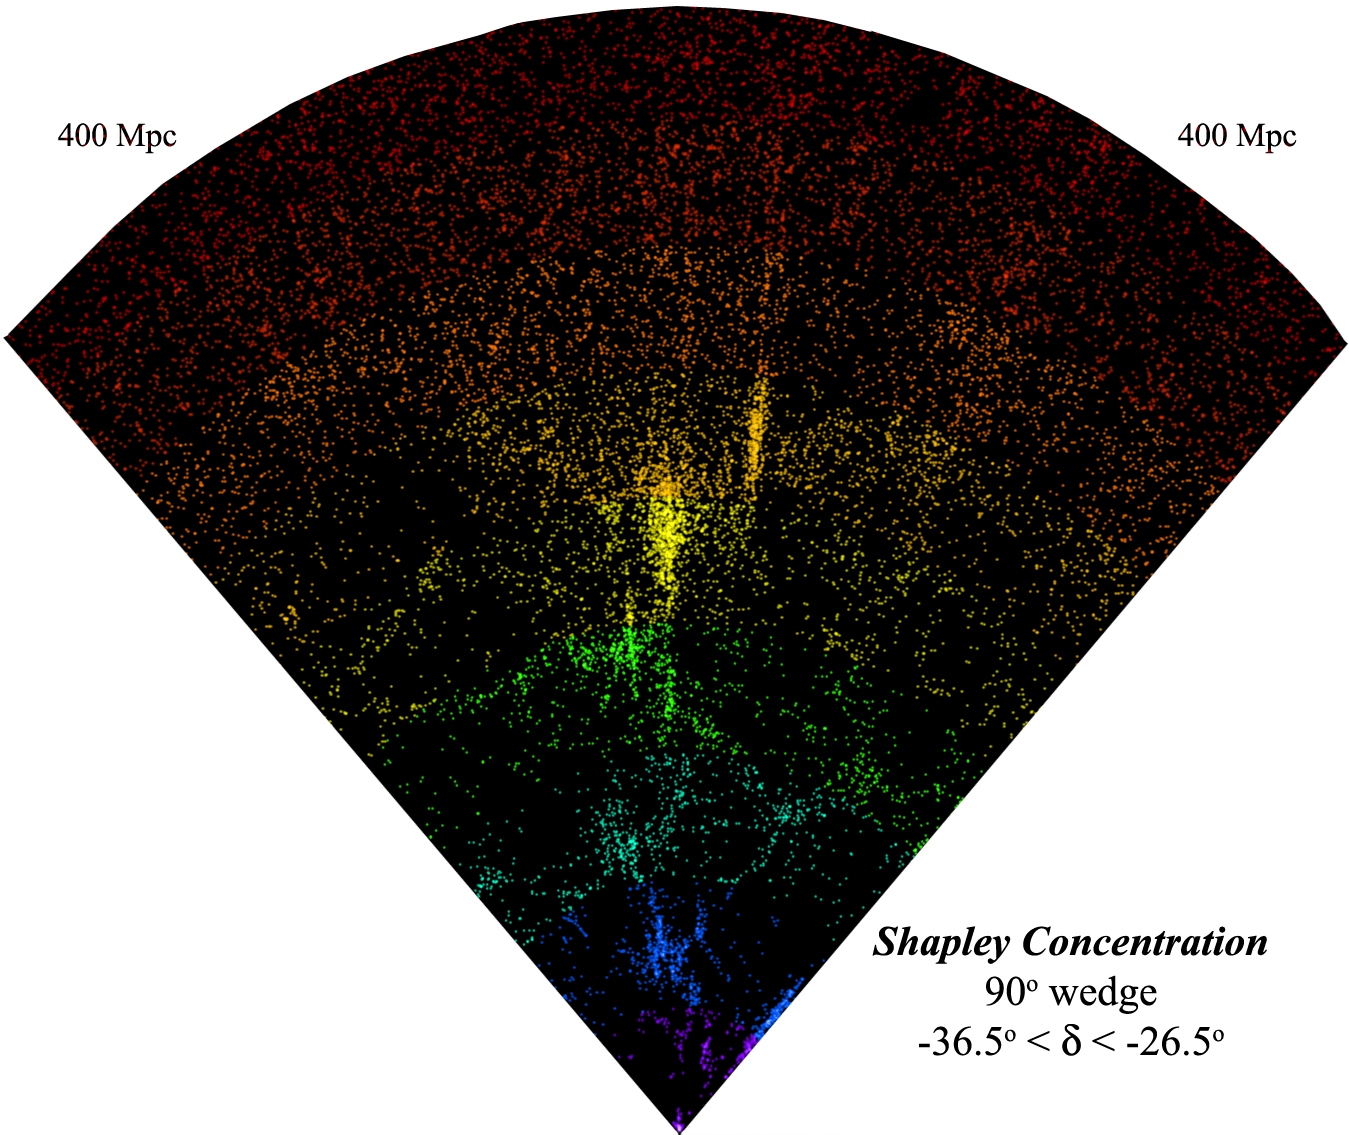
This is clearly demonstrated in
Figure 10,
where we show the redshift
distribution for the Shapley Concentration region in a constant declination
slice across the equatorial axis. The nearby galaxy clusters (Hydra-Cen)
are easily discerned (note the radial velocity "fingers of god"), as are the rich galaxy
clusters of Shapley (center of image), but beyond z > 0.06 the distribution
is smoothing out as the uncertainties in the photometric redshifts begin
to dominate. But the
intricate web of large scale structure extends
well beyond this volume limit, as unmistakably demonstrated by the 2dF
and SDSS galaxy surveys. But with the addition of optical and or mid-infrared
photometry from future all sky surveys (e.g., WISE), the photometric
redshifts may be greatly improved, allowing reconstruction of the local
Universe beyond 300 to 400 Mpc. Moreover, large redshift surveys (e.g., 6dFGS)
will provide accurate distance estimates for large regions of the sky,
further sharpening our view of the cosmic web.
Final Thoughts
The 2MASS catalog has proven to be quite versatile to
the astronomical community: supporting observation and future mission
planning, seeding studies of star formation and morphology in nearby galaxies,
penetrating the zone of avoidance, providing the base catalog of redshift
and Tully-Fisher HI surveys, and so on. But perhaps its most important
function is to provide the "big picture" context for analysis and interpretation
of data concerning galaxy clusters, large scale structure and the density
of matter in the Universe. And so the primary motivation of this work,
with the construction of qualitative "road" maps to the local Universe,
is to provide a broad framework for studying the physical connection between
the local Universe (Milky Way, Local Group, Local Supercluster, "Great Wall",
etc) and the distant Universe where galaxies and the cosmic web first formed.
The best is yet to come.
|
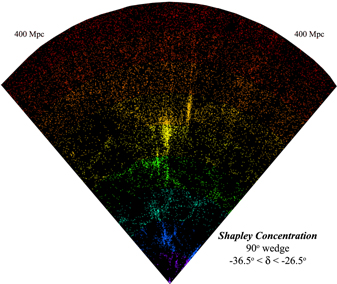
Figure 10. Redshift slice of the Shapley Concentration region,
extending to the limit of the 2MASS galaxy catalog, z ~ 0.1 (400 Mpc).
The equatorial RA slice is 90 deg between a declination boundary of
-36.5 deg < Dec < -26.5 deg. The points are color-coded by redshift (see
Figure 1). The "finger of god" radial velocity artifacts trace galaxy
clusters, including Abell 3558 (center, yellow). The Hydra-Cen
supercluster is foreground (blue fingers) to the Shapley Concentration.
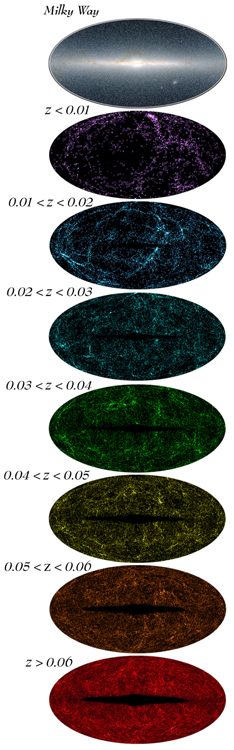
Figure 11.
2MASS galaxy distribution separated by redshift layer.
The color scheme, when combined, creates the panorama shown in
Figure 1.
An animation that shows the cosmic web separated by
sliced redshift is given
here-animation (beware: this is 8MB in size).
|
Acknowledgments
The author would like to thank Joe Mazzarella (NED) and John Huchra (CfA)
for kindly providing galaxy redshifts. Discussions with Roc Cutri,
Mike Skrutskie, John Lucy and Renee Kraan-Korteweg were very helpful.
The referees of
this paper are kindly thanked for their helpful suggestions.
And a special thanks to Joss
Bland-Hawthorn for organizing the LSS workshop (in honor of Brent Tully)
that inspired this paper.
This publication makes
use of data products from 2MASS, which is a joint project
of the Univ. of Massachusetts and the Infrared Processing and Analysis Center, funded by
the NASA and the NSF. This work was supported in part by the
Jet Propulsion Laboratory, California Institute of Technology, under a contract with NASA.
References
Bell, E., McIntosh, D.H., Katz, N., & Weinberg, M.D. 2003, ApJS, 149, 289.
Cole, S. et al 2001, MNRAS, 326, 255.
Courtois, H., Paturel, G., Sousbie, T., & Labini, F. 2004, A&A (in press).
Cutri, R.M., et al 2000, The 2MASS Explanatory Supplement.
De Vaucouleuers, G. , De Vaucouleuers, A., & Corwin, H. 1976, 2nd RGC (Austin: Univ. of Texas Press).
Eisenhardt, P, & Wright, E. 2003, Proceedings of the SPIE, 4850, 1050.
Gardner J.P., Sharples M.R., Frenk C.S., & Carrasco, B.E. 1997, ApJ, 480, L99.
Glazebrook, K., Peakcock, J.A., Collins, C.A., & Miller, L. 1994, MNRAS, 266, 65.
Huchra, J., Davis, M., Latham & Tonry, J., 1983, ApJS 52, 89.
Jarrett, T.H, Chester, T., Cutri, R., Schneider, S. & Huchra, J. 2003, AJ, 125, 525.
Jarrett, T.H., 2000, PASP, 112, 1008.
Jarrett, T.H., Chester, T., Cutri, R., Schneider, S., Skrutskie, M. & Huchra, J. 2000a, AJ, 119, 2498.
Jarrett, T.H., Chester, T., Cutri, R., Schneider, S., Rosenberg, J., & Huchra, J., 2000b, AJ, 120, 298.
Jones, D.H., et al 2004, MNRAS (accepted).
Kochanek, C. S., White, Martin, Huchra, J., Macri, L., Jarrett, T. H., Schneider, S. E., M
ader, J. 2003, ApJ, 585, 161.
Kochanek, C. S., White, Martin, Huchra, J., Macri, L., Jarrett, T. H., Schneider, S. E., Mader, J. 2003, ApJ, 585, 161.
Kochanek, C.S., et al 2001, ApJ, 560, 566.
Kraan-Korteweg, R. & Jarrett, T.H. 2004, ASP Conference "Nearby Large-Scale Structures a
nd the Zone of Avoidance", eds. A.P. Fairall and P.A. Woudt, in press.
Lineweaver, C., Tenorio, L., Smoot, G., Keegstra, P.,
Banday, A., & Lubin, P. 1996, ApJ, 470, 38.
Maller, A.H., McIntosh, D.H., Katz, N. & Weinberg, M.D. 2003a, (astro-ph/0304005)
Maller, A.H., McIntosh, D.H., Katz, N. & Weinberg, M.D. 2003b, ApJ, 598, L1.
Moore, A.; Gillingham, P.; Saunders, W. 2002, ASP Conference Proceedings, 280,
"Next Generation Wide-Field Multi-Object Spectroscopy",
eds. Michael J. I. Brown and Arjun Dey, 109.
Rines, K., Geller, M.J., Diaferio, A., Kurtz, M. & Jarrett, T.H. 2004, AJ, 128, 1078.
Rowan-Robinson, M. et al 2000, MNRAS, 314, 375.
Skrutskie, M., et al 1997, in The Impact of Large-Scale Near-IR Sky Surveys, ed. F. Garzon et al (Dordrecht: Kluwar), 25.
Tonry, JL, Blakeslee, JP, Ajhar, EA, & Dressler, A. 2000, ApJ, 530, 625.
Tully, R. 1982, ApJ, 257, 389.
Watson, F., et al 2001, ASP Conf. Series vol. 232, Clowes, Adamson and Bromage eds., p. 421.
Related Links
As part of NASAĆs Origins Program, 2MASS is funded by NASAĆs Office of Space Science and the National Science Foundation. Results from 2MASS will benefit future Origins missions, including the Space Infrared Telescope Facility (SIRTF) and the Next Generation Space Telescope (NGSS). JPL manages the program for NASAĆs Office of Space Science, Washington, DC. JPL and IPAC are a division of the California Institute of Technology, Pasadena, CA.

 Infrared Universe: IRAS/COBE vs. 2MASS
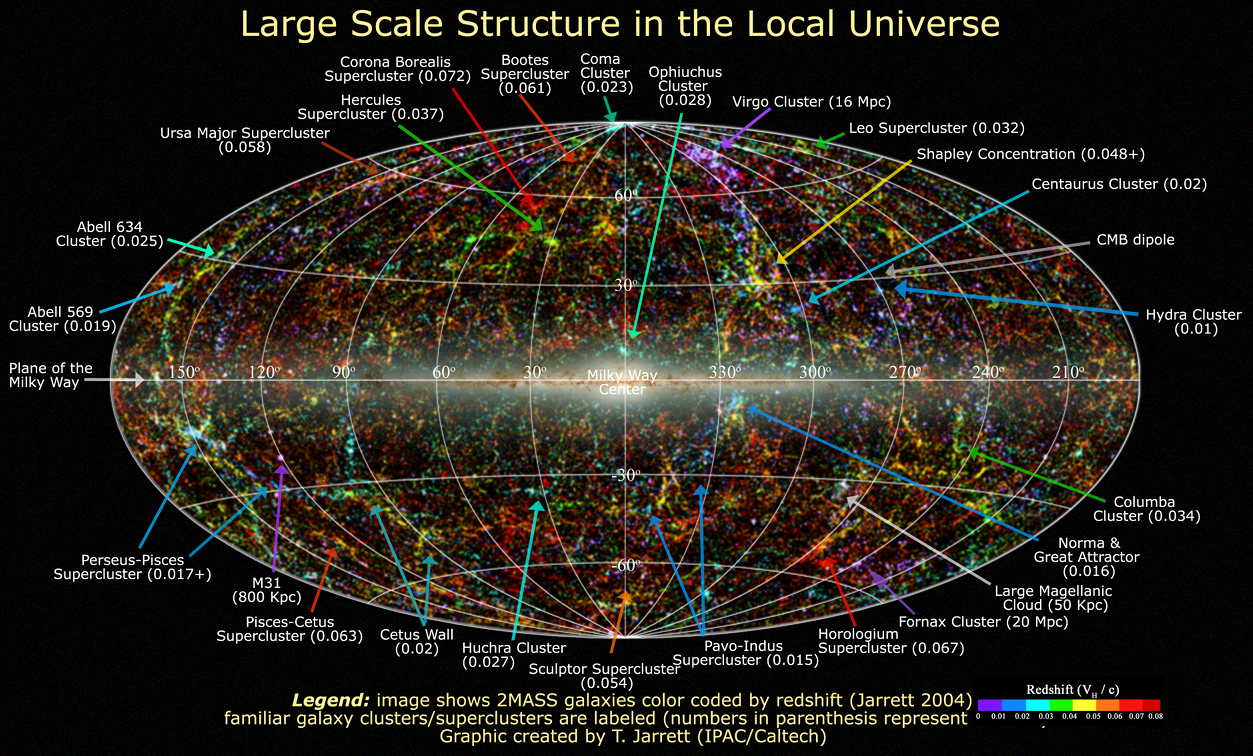