 Galactic Structure: COBE-DIRBE image of the sky at 1.25, 2.2, and 3.5 um. Learn more about COBE. |
 Galactic Structure: 2MASS image of the sky at 1.2 - 2.2 um. The Milky Way dominates the counts, with over 500 million stars. Lost in the haze is another 4 to 6 million galaxies. Learn more about 2MASS. |
 Extra-galactic Structure: Panoramic view of the entire near-infrared sky reveals the distribution of galaxies beyond the Milky Way. The image is derived from the 2MASS Extended Source Catalog (XSC)--more than 1.5 million galaxies, and the Point Source Catalog (PSC)--nearly 0.5 billion Milky Way stars. More details are given in Jarrett 2004. |
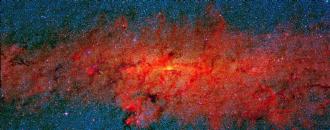
 Galactic Plane Structure: A false-color composite of the center of the Milky Way. Learn more about MSX. |
 Galactic Center Structure: Composite of 2MASS J (blue), Ks (green), and MSX Band A (6 - 11 um; red) image of the Galactic Center. |
 In the future, WISE will fill this hole -- revealing the whole sky as seen in the mid-infrared (tracing both starlight and hot dust from stars and distant galaxies). Patience ... |
 Galactic Structure: IRAS view of the far-infrared sky. |
 Galactic Structure: Using a combination of COBE and IRAS data, Finkbeiner, Davis & Schlegel (1999) derived models for thermal dust emission at microwave and submillimeter frequencies. This image, 94 GHz Model Dust Map, comes from LAMBDA. |
 Extra-galactic Structure: The IRAS PSC redshift survey is a redshift survey of some 15,000 galaxies detected in the IRAS Point Source Catalogue over 83% of the sky. PSCz velocity field is shown in this animation, where the density represents the galaxies moving outwards in increasingly distant shells in redshift (Dark colours show underdense regions, bright colours are overdense.) The image comes from the IRAS PSCz Redshift Survey of Will Saunders et al. |
 Density fluctuations in the Early Universe WMAP view of the infant Universe. The image shows: " The first detailed, all-sky picture of the infant universe. The WMAP image reveals 13 billion+ year old temperature fluctuations (shown as color differences) that correspond to the seeds that grew to become the galaxies. Encoded in the patterns are the answers to many age-old questions, such as the age and geometry of the Universe." The image comes from the NASA/WMAP Science Team. Here is an animation that compares the Early Universe to the Current State of the Universe. |