This work represents our first efforts to verify the functionality and design of the 3-channel version of GALWORKS. Since the GALWORKS package was ready for full scale tests sans real 3-channel data (as of late 1996), we 'created' a 3-channel dataset using a set of scans from the prototype camera 1995 observing run. This memo describes some of the key results from these "3-channel" tests. In particular, we focus on the GALWORKS algorithm 1 results -- normal galaxies and extended sources. A later memo will describe results from algorithm 2, the low central surface brightness galaxies. In the first section we describe how the experiment was constructed, the second section describes the "seeing" conditions of the data set, the third section provides an image gallery of various objects in the study, the fourth describes the various scoring parameters used to distinguish galaxies from stars, and the final section presents the overall reliability of the GALWORKS output.
Some examples of galaxies found in the SA57 field. The first column is the J band image, second column the H band image, third column the K band image and the fourth column is the DSS optical image. The dark blue elliptical contour represents the 20 mag per sq. arcsec isophotal area, and the light blue contour the "flux growth" elliptical area. Sources that had been "subtracted" from the object fields are circled in red with the size of the circle given by the subtraction radius. Sources circled with a green circle/ellipse represent sources that were previously processed and subsequently blanked from the object field (blanked pixels are then substituted with corresponding isophotal values given by the object of interest, thereby recovering pixel information).
A number of parameters are used to distinguish stars
(point sources) from galaxies (extended sources). There are
three basic kinds of parameters to this end: (1) the
peak flux versus integrated flux, (2) radial profile, and
(3) emission located beyond the central peak and wings
of a stellar PSF, and various combinations thereof.
The central surface brightness to total brightness parameter
is referred to as "mxdn". The radial profile parameters
derive primarily from the radial profile function:
The following plots show the scoring results for the
SA57 GALWORKS candidated galaxies. Every candidate was
visually inspected using the JHK images as well as the
DSS images and POSS prints (when necessary) in order
to classify/verify the objects as follows:
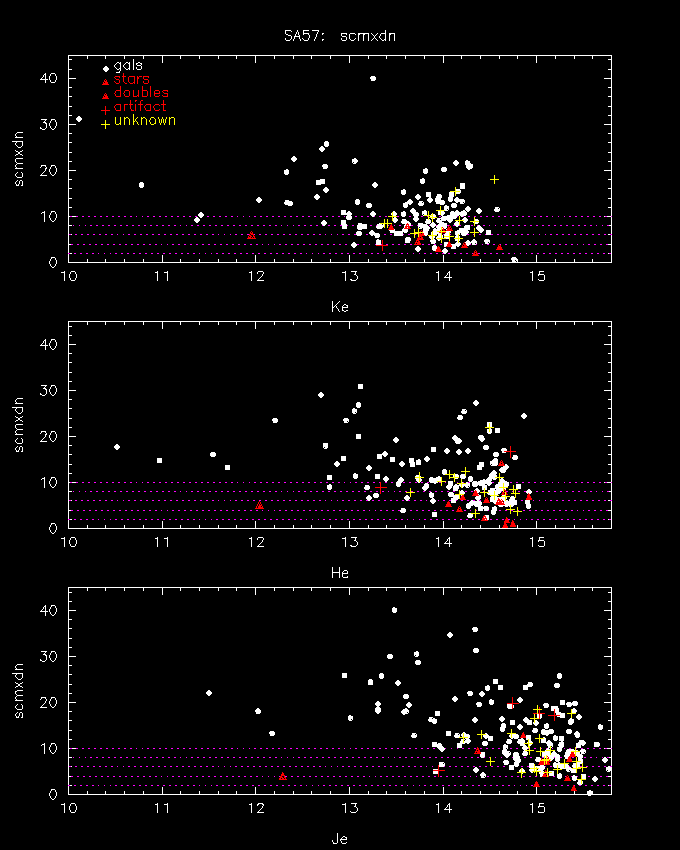
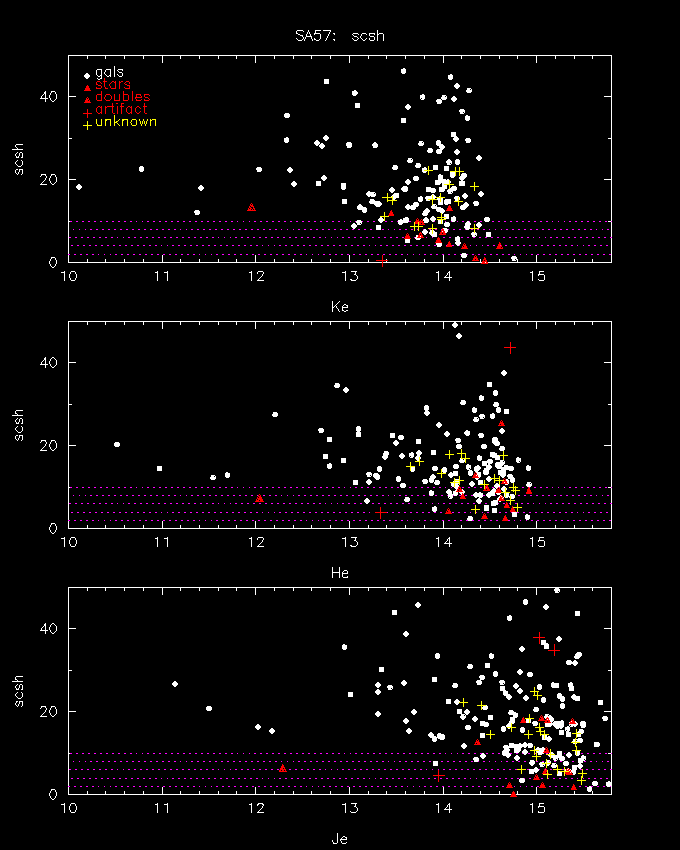
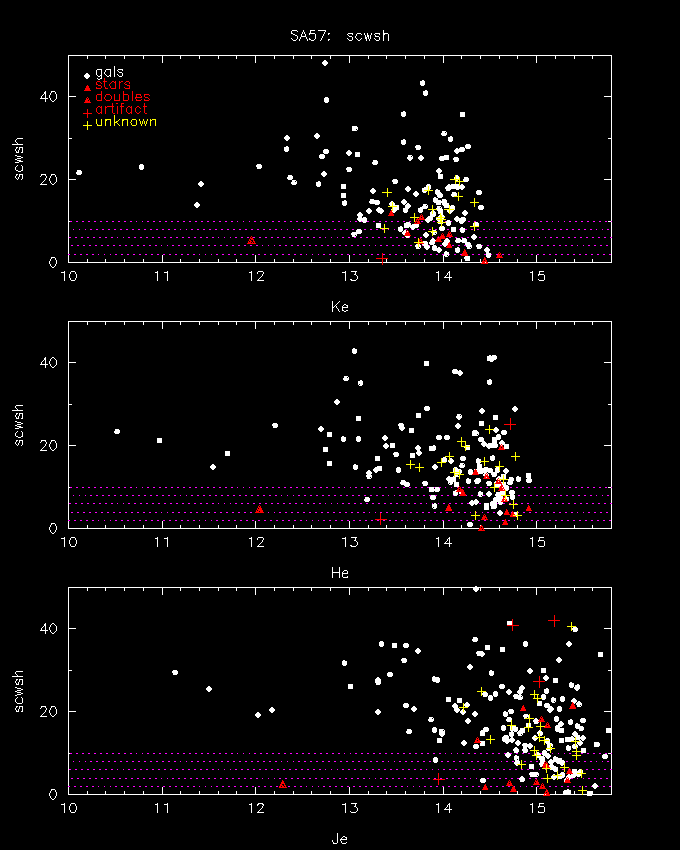
Many "false" galaxies (i.e, stars) are misclassified as extended objects when the seeing changes more rapidly than can be tracked by SEEMAN. Since the H band data is rather poor, as is the J data, there are a number of "false" galaxy candidates since GALWORKS requires only one of the band's parameters to "pass" any scoring threshold (e.g., if an object has an H-band score that passes its threshold, then it is considered to be a galaxy candidate even if the J and K scores fail the same score threshold). The following figures suggest just this unique problem with the SA57 data set. Still, the reliability is rather good (as presented in the last section of this memo) even with the poor seeing conditions.
SCMXDN vs Mag : "mxdn" score
The "mxdn" score is derived from the peak pixel brightness versus the integrated flux (using an adaptive circular aperture). Galaxies are denoted by the filled white circles, false galaxies (stars) by small red triangles, double stars by large red triangles, and unknown sources by yellow crosses. The score threshold was set at 2-sigma, or scmxdn = 2.

SCSH vs Mag : "sh" score
The "sh" score is derived from the radial profile, as discussed earlier in this memo. It is effective for most kinds of stars, except double stars and other multiple point source objects.

SCWSH vs Mag : "wsh" score
The "wsh" score (a.k.a. "wedge shape") is derived similar to the "sh" score, except that it employs a rotating wedge-shaped mask designed to exclude sections of the radial profile from the modified exponential function fit. It's primary purpose is to minimize contamination from double stars.

The remaining score parameters were designed specifically to
counter contamination from multiple stars. Since the SA57
field has few doubles and even fewer triple stars (if any),
this
data set is not useful for testing these "triple killer" parameters.
We will have to wait for real 3-channel data of high stellar
density fields.
It is still instructive to see how the triple killer parameters handle low stellar density fields (i.e., single stars), as well as the galaxies themselves. It can bee seen from the plots that the triple star killers will also kill galaxies at the faint end if the thresholds are not chosen carefully (i.e., use triple killers for only high stellar density fields).
A new parameter under design takes advantage of the fact
that the PSF for stars is fairly well measured for the
coadds (via SEEMAN). Using the alpha and beta
values for the PSF, GALWORKS deconvolves the galaxy candidate images
using an iterative scheme similar
to a Richardson-Lucy algorithm. It then counts the number of
"local maxima" within 8" of the object central position.
The general idea is to identify multiple-peaked objects, such as
double and triple stars, as well as galaxies
with two nuclei, or galaxies with stellar contamination.
The figure below shows the
results for all the galaxy candidates, where we plot
#RL (number of local maxima within 8") versus the "trip"
triple star killer parameter. The parameter space is designed
to separate multiple stars from
galaxies: Galaxies should have a large "trip" score
(> 5, e.g.,) and may have more than one peak, while double
stars and triple stars should have a smaller "trip"
score (< 10) with multiple peaks. Again, since SA57 is a
low stellar density field, this exercise does not shed much light
on this kind of design. Further testing is required on high
number density fields. Galaxies with multiple peaks tend to be
the bigger and brighter of the set (but do not appear to be double nuclei)..
The sources with zero peak
correspond to faint objects (SNR < 10) in which the deconvolution was
not attempted.
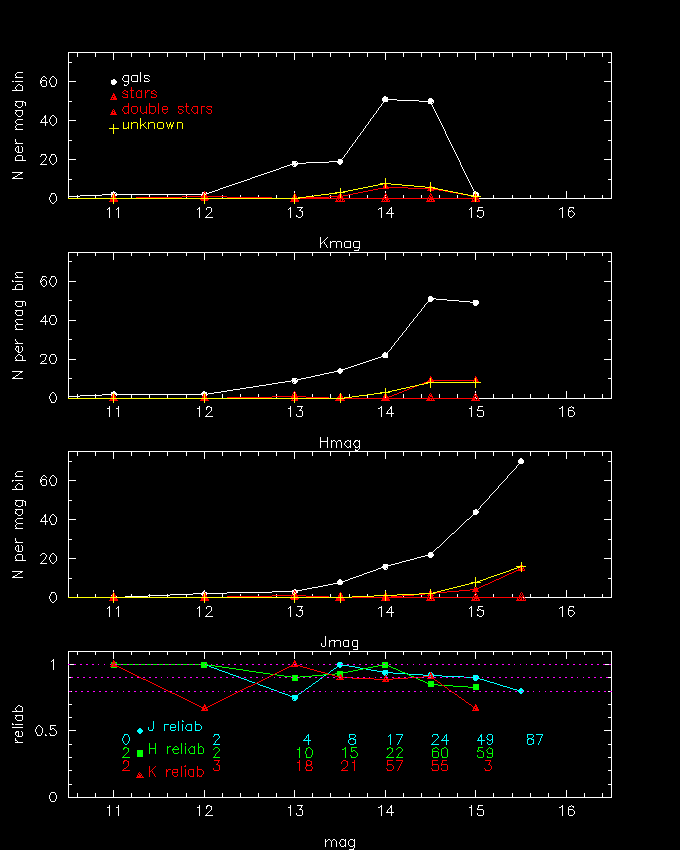
The SA57 data set does not lend itself well to a fair test of
the GALWORKS reliability due to the very poor seeing at J and H.
In fact, for the real survey, the J and H scans would have
been rejected outright as too poor a data set. In any event, we can
look at the reliability results as an approximate (lower limit)
measure of what GALWORKS is likely to do with better data.
The reliability is measured as followins:
From the last figure below, it can be seen that the reliablity is for the most between 80% and 100% for K< 13.5, J&H < 14.5, which is not far from the level-1 specifications for high galactic latitude fields. The number of sources per mag bin are also shown on the plot (color coded according to band).
