T. Jarrett, IPAC
(990630)
The high surface density of stars in and near the Galactic plane produces an additional "noise" component to the total background noise. This component is referred to as the "confusion noise". It is traditionally characterized using star-count models; see for example Stellar Number Density and Confusion Noise. With over half of the 2MASS survey now completed, we have the ability to measure the confusion noise and derive an empirical relation with stellar number density. The southern hemisphere must be treated separately since the electronics (Leach) are different from the north (note: north data switched over to the Leach Electronics starting around 981020). As it turns out, the Northern data required splits between the dates of <980101, 980101 to 981020, and >981020. Each date-inclusive set has its own noise characteristics, with the second and third sets representing the split between the new and old electronics. The first set seems to be associated with a camera warming event that occured during the Xmas break between 1997 and 1998.
The ultimate goal is to derive (as a function of density) the ratio of the total noise to the predicted noise, where the predicted noise corresponds to the Poisson and read-noise components. We can then use this ratio to compare the predicted total noise with the measured noise. Deviations from the predicted value correspond to real structure in the coadds, including airglow, bright stars and large galaxies. The final sections of this memo apply the ratio to the coadd data set to arrive at an (n-sigma) "score" for each coadd.
Definition: density = log [ number of stars per deg^2 brighter than K = 14th mag ]
There are four primary sources of "noise" that contribute to the total measured noise in a coadd. They are the Poisson noise from the (1) source and (2) background, the (3) read (or electronic) noise, and the (4) confusion noise. {note: T. Chester and I have analyzed this subject to death; see Analysis of Photometric Noises for 2MASS Galaxies for gruesome details, and Analysis of Noise In The 2MASS Atlas Images for gruesome analysis.} There is an additional form of noise, electronic banding, that is not easily characterized and varies widely over time (from nothing to significant); see Summary Of J Band Electronic Problems for more information. The latter form is ignored here since there is little we can do about it (except to reobserve scans in which the problem is severe). The Poisson noise due to the source is neglible compared to the background noise, so this term is also ignored. We are left with the background, read-electronic, and confusion noise components.
The coadd background "shot" noise can be written as (see links above for derivation)
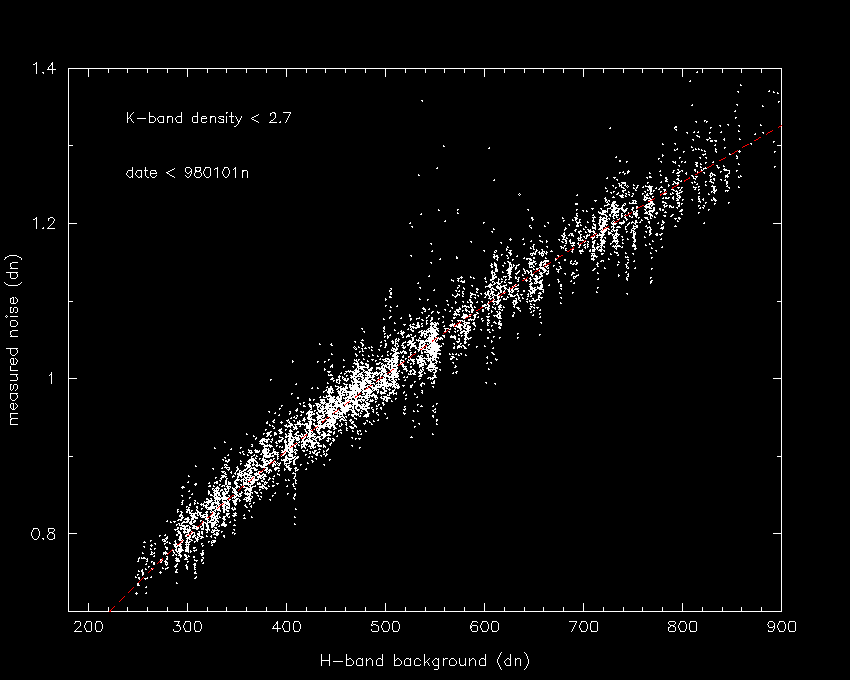
H-band Background Noise: date <980101n
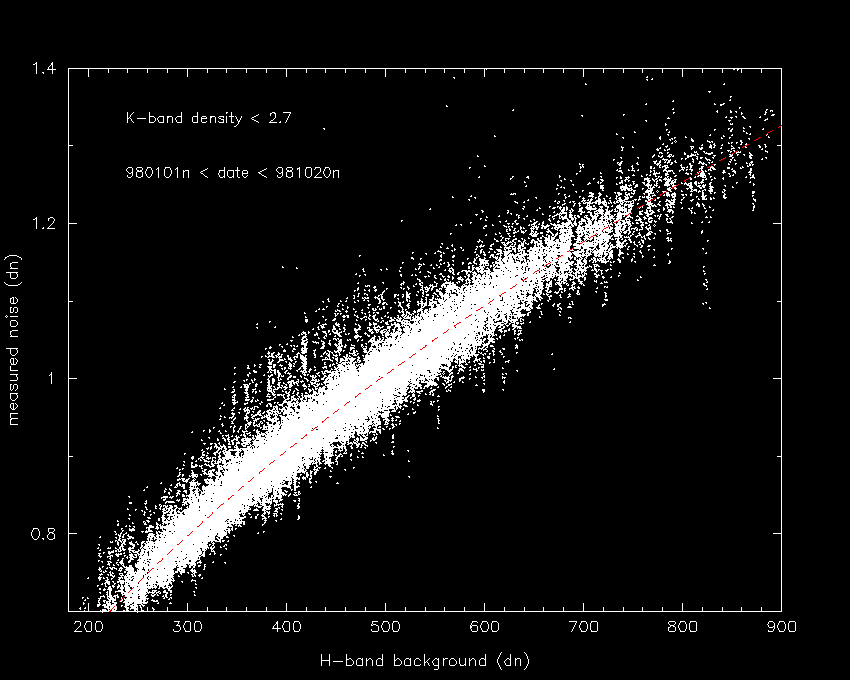
H-band Background Noise: date >980101n and <981020n
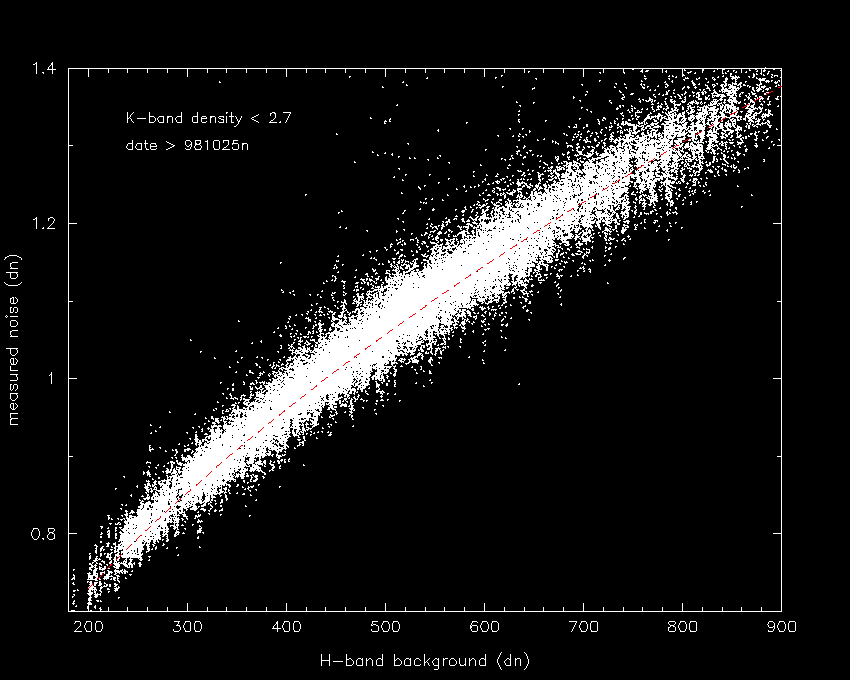
H-band Background Noise: date >981025n (Leach Electronics)
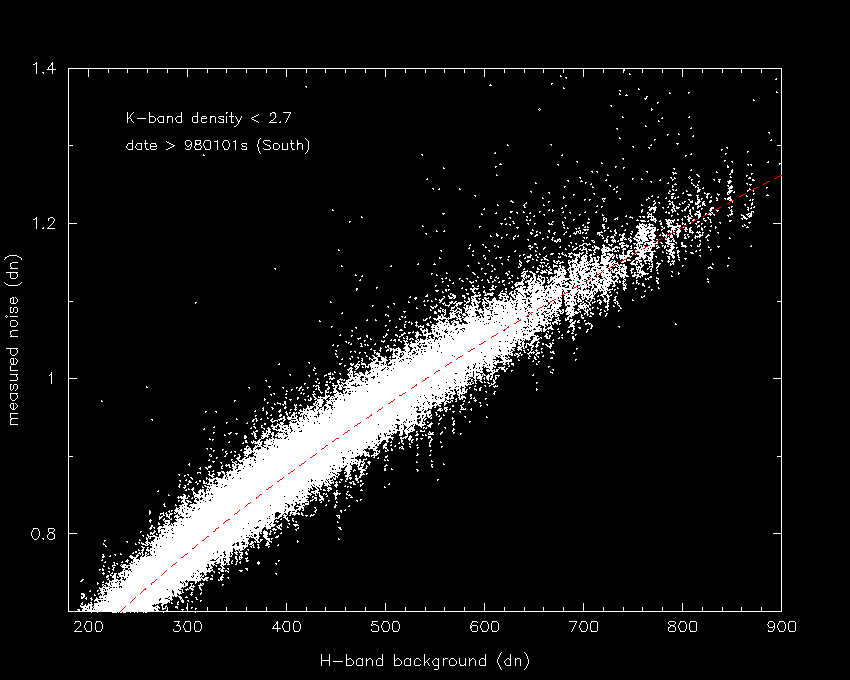
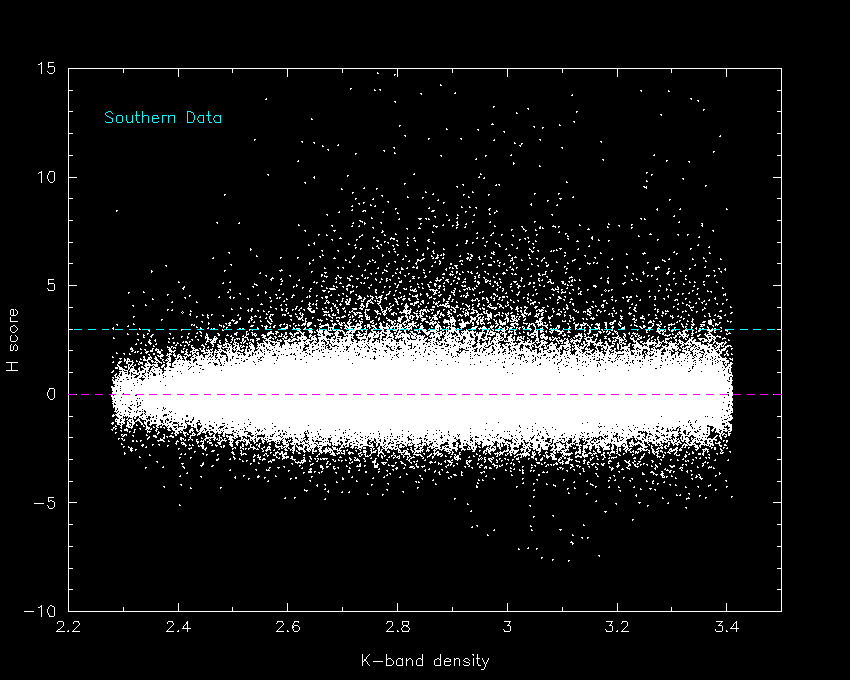
H-band Background Noise: date >980101s (Southern Data)
(number density < 2.7)
noise = 1.0 dn == 20.6 mag/arcsec2
red line denotes predicted background noise
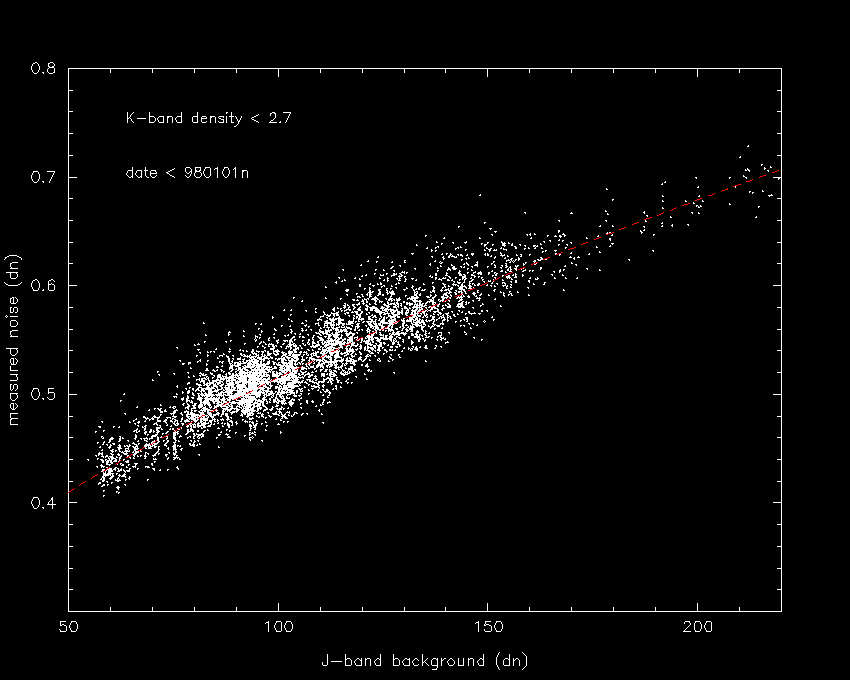
J-band Background Noise: date <980101n
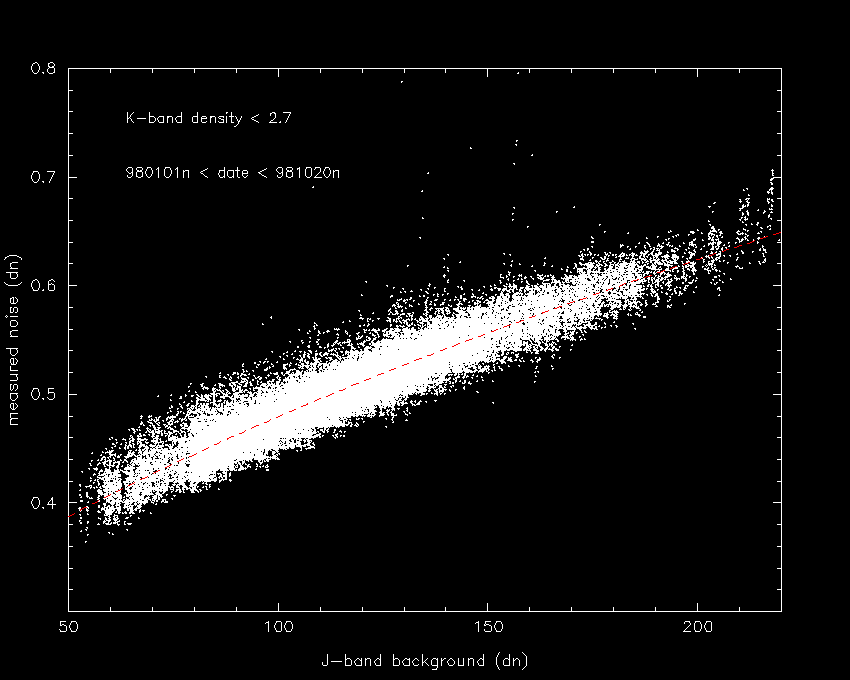
J-band Background Noise: date >980101n and <981020n
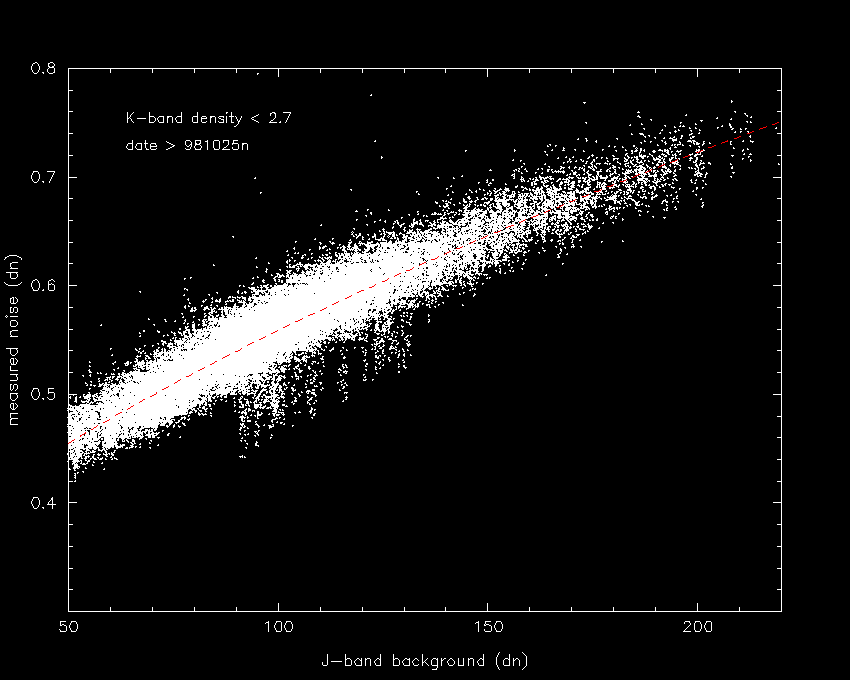
J-band Background Noise: date >981025n (Leach Electronics)
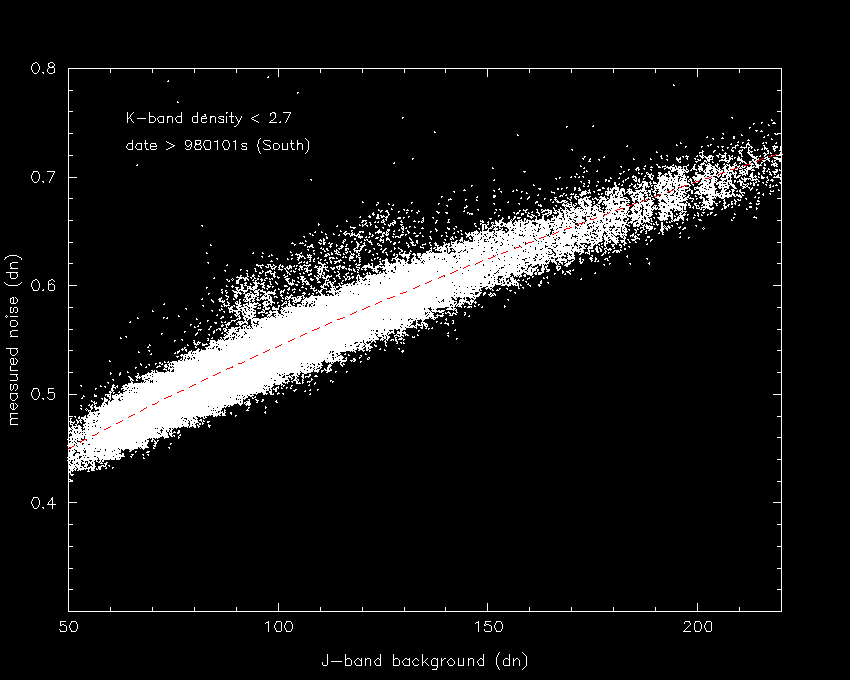
J-band Background Noise: date >980101s (Southern Data)
(number density < 2.7)
noise = 1.0 dn == 20.8 mag/arcsec2
red line denotes predicted background noise
Now we would like to know how this "noise" changes with stellar number density; i.e., what is the form of confusion noise.
For comparison, we also plot the background noise vs. density where the background is scaled to a fixed level: 120 dn for J-band, 550 dn for H-band, and 500 dn for K-band, typical (average) background values.
K-band Confusion Noise
H-band Confusion Noise
J-band Confusion Noise
Notes:
Note the spread in the distributions, particularly at H. This is airglow (H-band) and electronic banding (J) and other structure in the coadds (e.g., big galaxies).
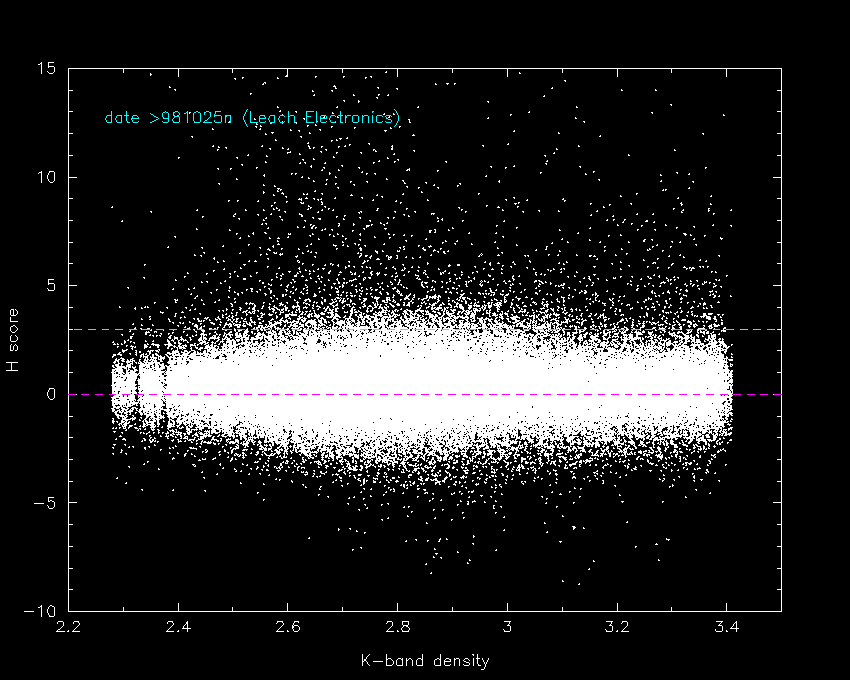
Trends that seem to be out of line with the bulk trend are due to time-varient changes in the noise characteristics. See for example the J-band confusion noise for date >981025n (Leach Electronics). These changes are a mystery (perhaps related to camera warming events?).
This analysis breaks down at high source densities, > 4.4 or so, this is partly due to the fact that the density metric saturates at this point.
Could this mystery somehow be related to the correlated coadd pixels? Perhaps the confusion noise appears to be lower than it really is (due to pixel smoothing and Weinberg kernal convolution).
Large-Scale Structure in the Coadd Images
Airglow, bright stars and large galaxies all induce background gradients that are poorly fit with the GALWORKS fitting scheme. This in turn generates an additional "noise" to the usual background ("poisson"), read and confusion noise. The following plots show structure in the coadds for the data set: 980101n < date < 981020n.
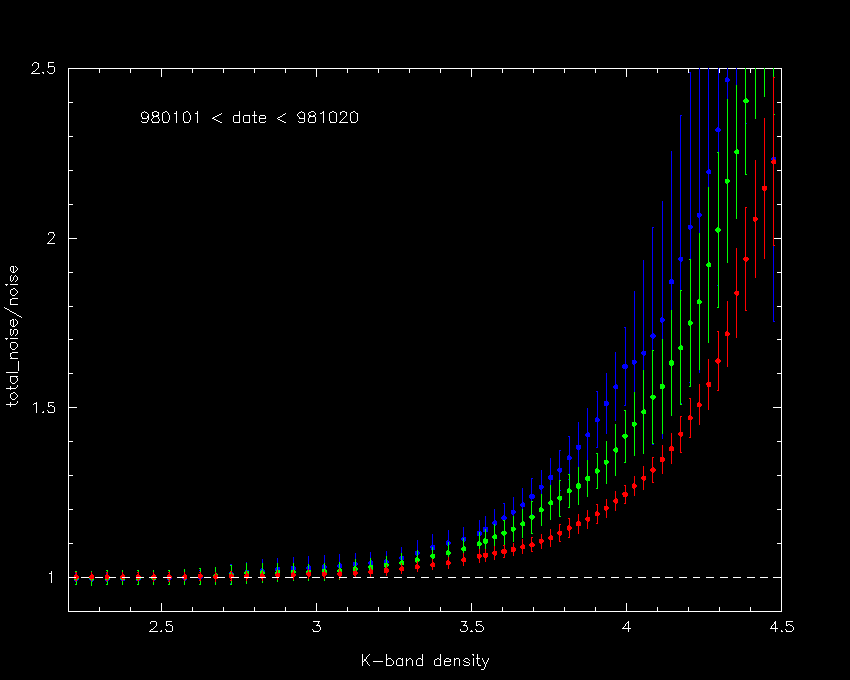
Total Noise vs. Predicted Noise; date >980101n and <981020n
The average uncertainty in the ratio (see errorbars above) for 2.4 < density < 3.4 is:
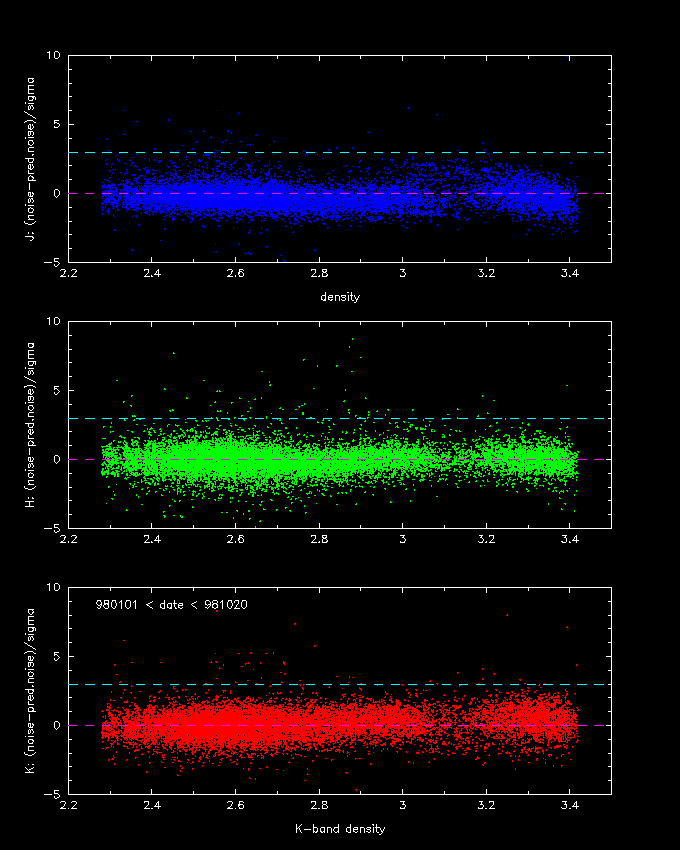
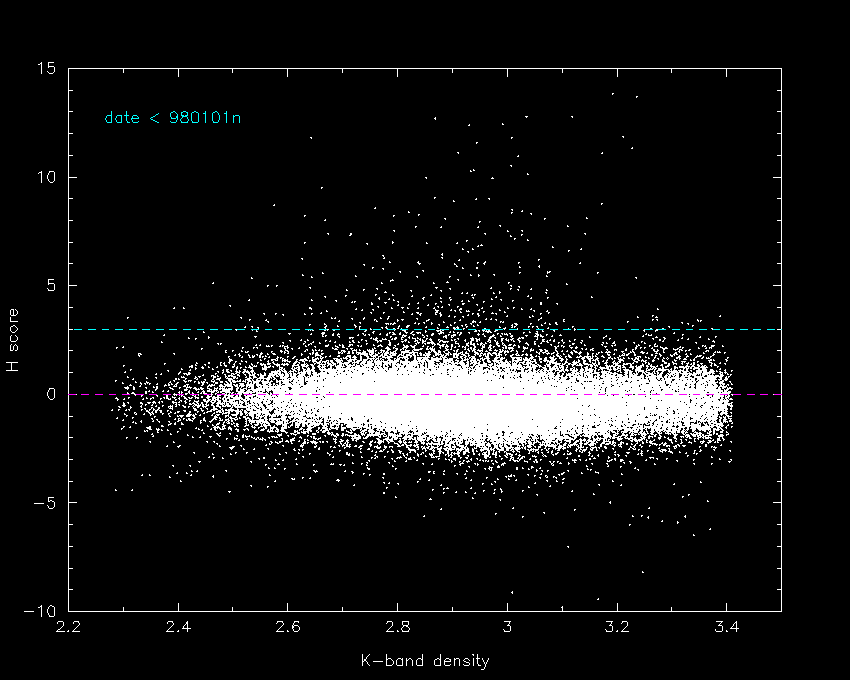
N-sigma "Score"
The average uncertainty in the difference (see errorbars above) for
2.4 < density < 3.4 is:
J: 0.014 dn
Dividing the difference by the spread in the distribution (average
uncertainty given above) gives an N-sigma representation of the noise
structure per coadd:
H: 0.026 dn
K: 0.014 dn
{Measured-Predicted Total Noise / RMS_Sigma}
vs. Density; date >980101n and <981020n
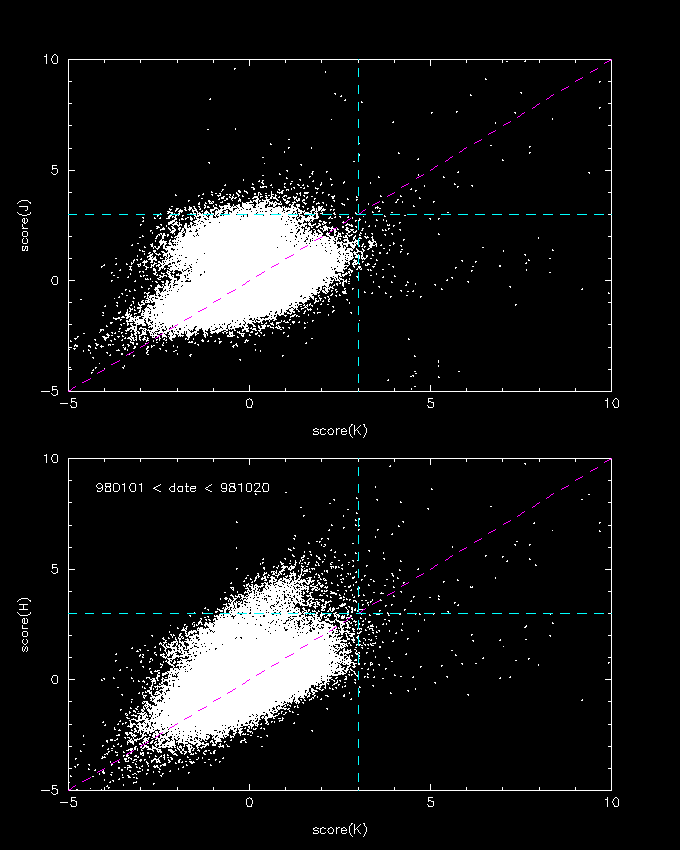
Comparing between bands may yield the phase space in which "airglow" is the dominent contaminent.
score(J) vs. score(K); score(H) vs. score (K); date >980101n and <981020n
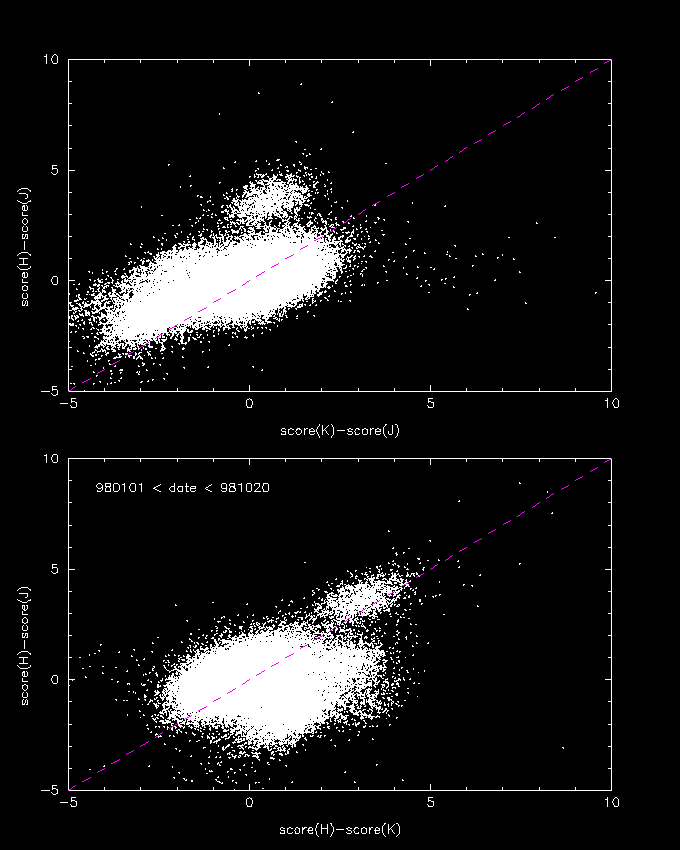
score(H)-score(J) vs. score(K)-score(J); score(H)-score(J) vs. score(H)-score(K); date >980101n and <981020n
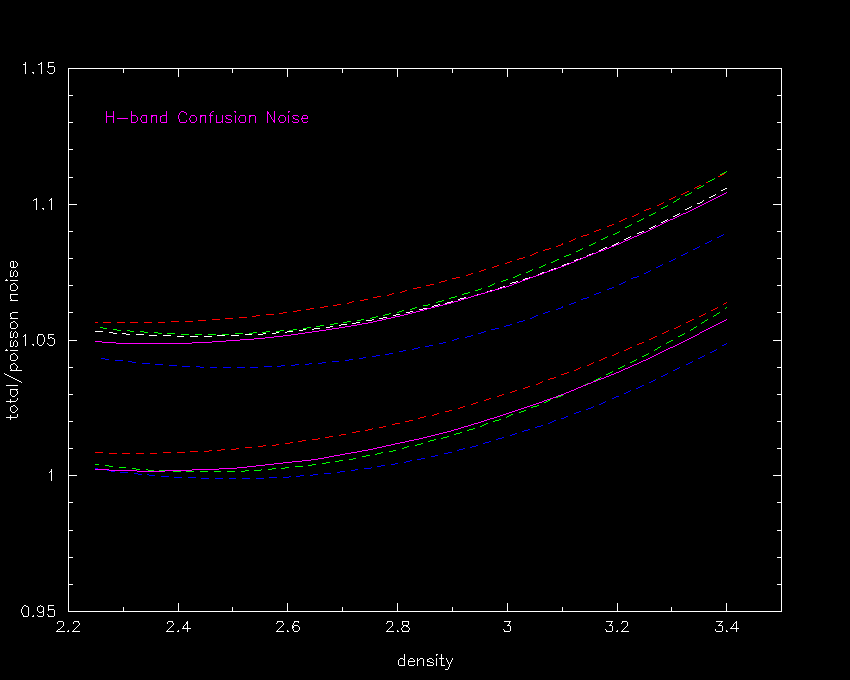
The total to predicted noise ratio should be approximately the same for each data set (date inclusive) since it is basically a measure of the confusion noise (which is not date or hemisphere dependent). In order to apply these methods to the database, it is necessary to characterize this ratio in functional form. A quadratic polynomial satisfactorily fits the density range between 2.4 and 3.4. The method will probably not work for higher densities (particularly at densities > 4.4).
Total Noise vs. Predicted Noise for each data set
(note: the upper set represents the 2*sigma distribution)
white dashed line == date >980101s (Southern data)
red dashed line == date >981025n (Leach Electronics)
green dashed line == date >980101n and <981020n
blue dashed line == date <980101n
magenta solid line = composite
Best fit to the H-band composite:
total to predicted noise ratio = 1.286832 + (-0.2418794* density) +
(0.05129893 * density^2)
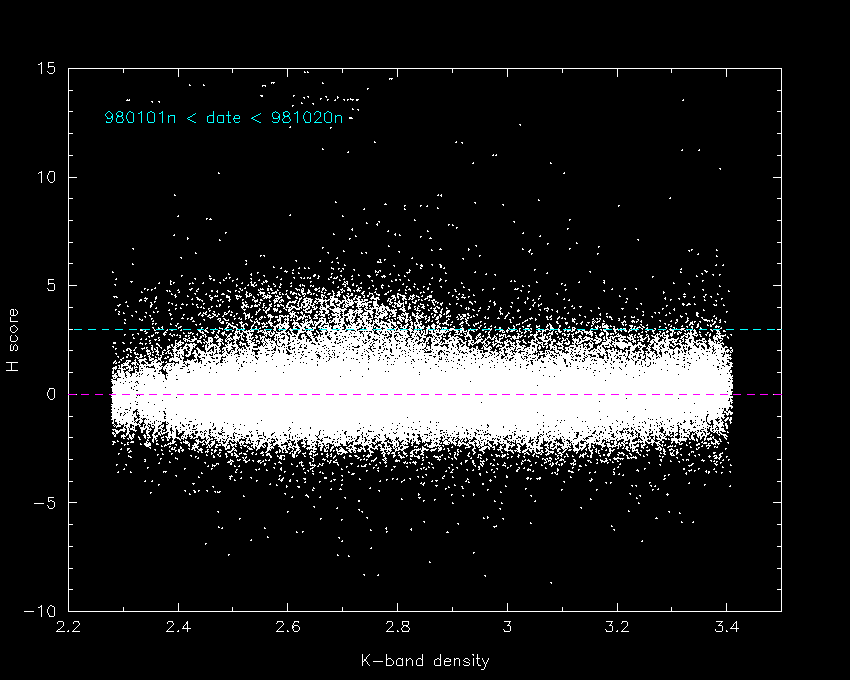
Using the composite polynomial in conjuction with the read-noise/gain terms for each data set, we may compute the "H score" for each set (see score).
{Measured-Polynomial-fit Total Noise / RMS_Sigma}
vs. Density; date >980301s (south)
{Measured-Polynomial-fit Total Noise / RMS_Sigma}
vs. Density; date >981025n (north Leach electronics)
{Measured-Polynomial-fit Total Noise / RMS_Sigma}
vs. Density; 980101n < date < 981020n
{Measured-Polynomial-fit Total Noise / RMS_Sigma}
vs. Density; date < 980101n
H-band n-sigma "score" formulae
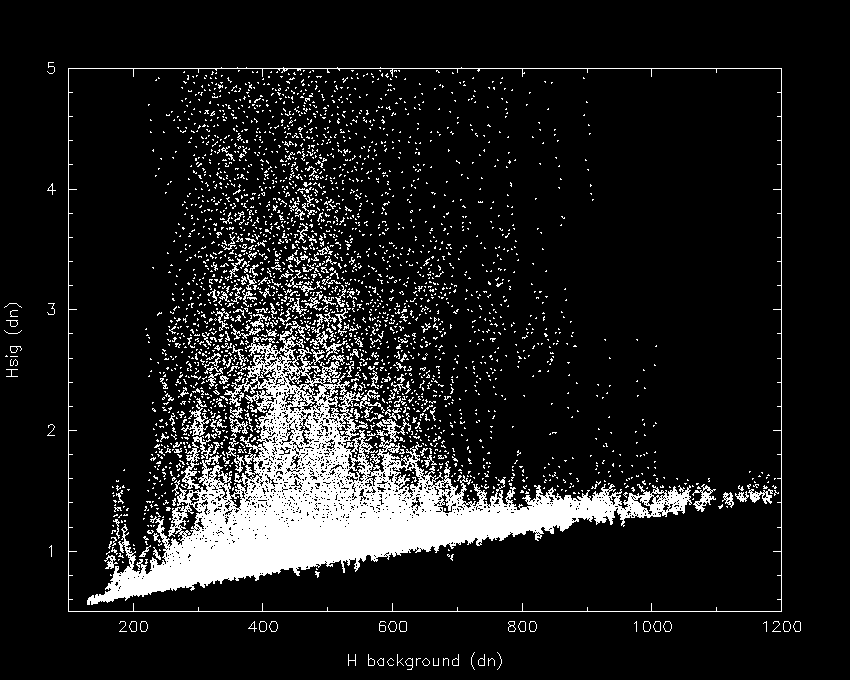
Hsig vs. Hback
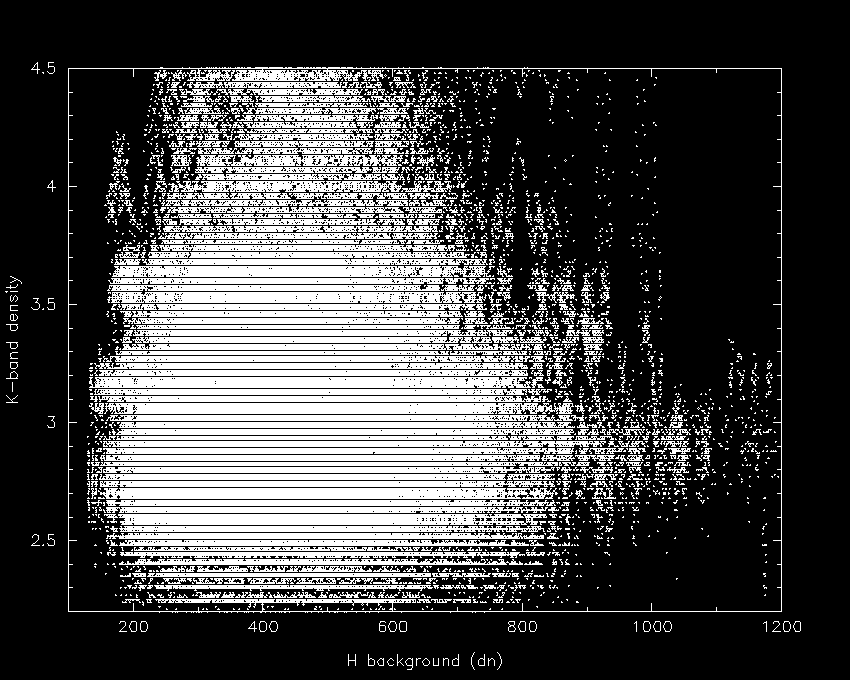
density vs. Hback
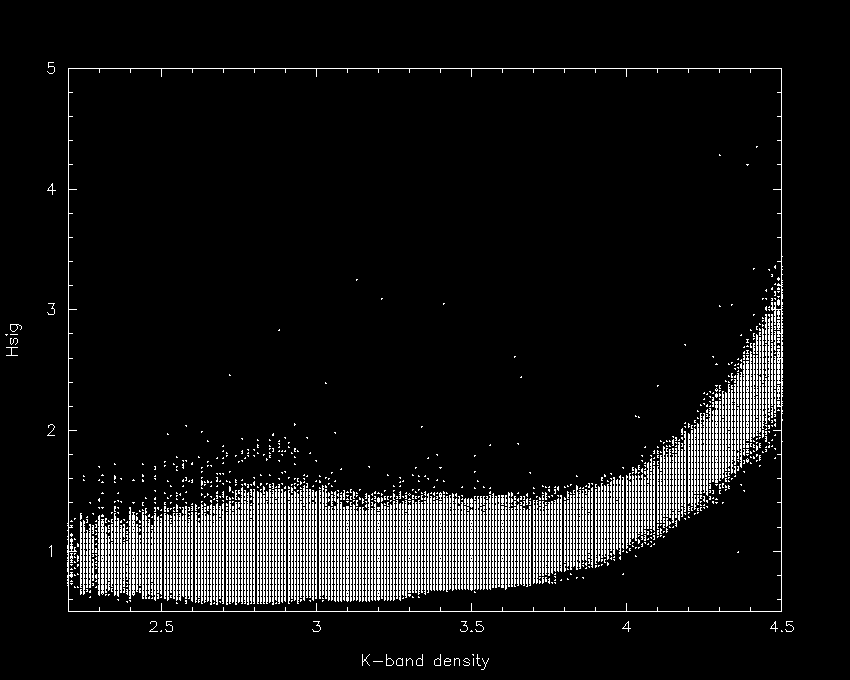
Hsig vs. density