| 0891m637-CR04 | 0891m637-CR09 |
 |
 |
| Number counts | Number counts |
 |
 |
| Differential reliability | Differential reliability |
 |
 |
| Cumulative reliability | Cumulative reliability |
There are two requirements that pertain to the reliability of the WISE Catalog:
In plain English:
"Reliability refers to whether a source listed in the catalog corresponds to an actual astrophysical source at that position at the time of the WISE observation(s). Reliability does not in itself ask what are the qualities of the positional and/or flux estimates listed in the catalog, but just on the existence."
All SNR > 20 sources in each band in the CRnn sets were then checked for existence against the truth table. In this way we define the internal reliability to be (# CRnn sources in a given band with matches in the truth table) / (total # of CRnn sources in that band).
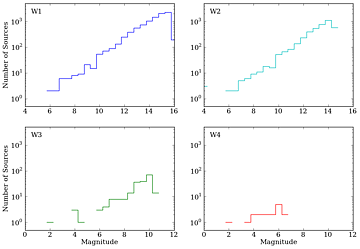
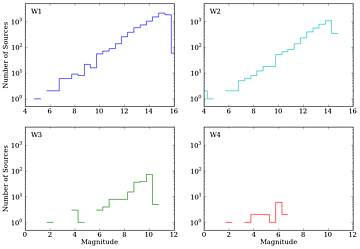
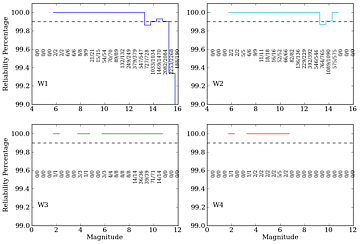
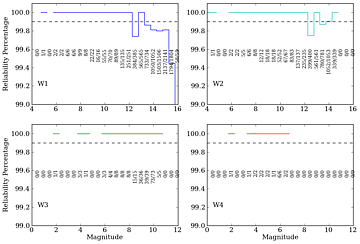
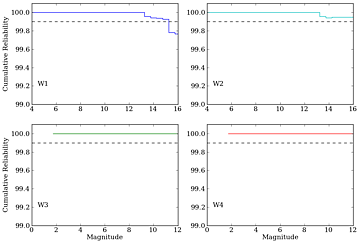
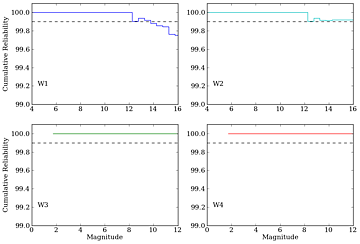
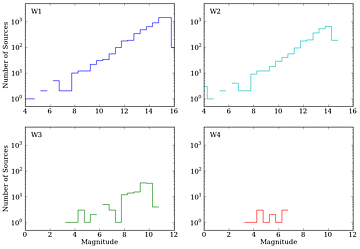
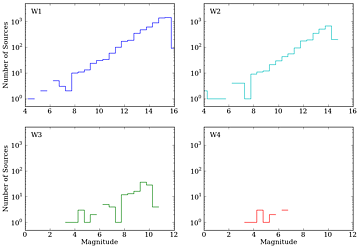
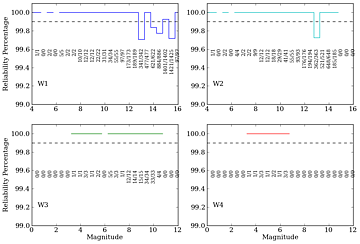
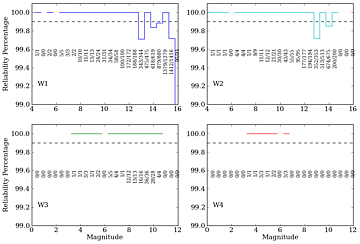
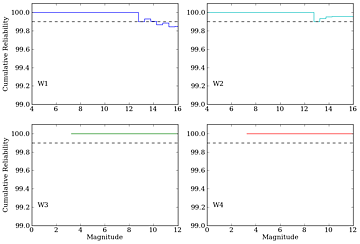
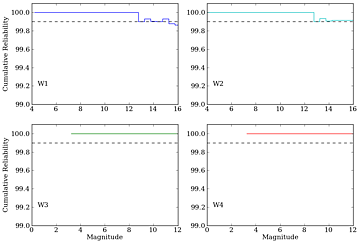
The results of this comparison are demonstrated in the following figures from two of the CRnn data sets from each pole; these particular sets have the most uniform coverage across each image and should be most representative of the general Catalog, but the less uniform subsets yield similar results. Figure I1 presents number counts and reliability fractions (per magnitude bin and cumulative) derived from the 0891m637 field, while Figure I2 shows the equivalent data from the 2708p636 field.
| 0891m637-CR04 | 0891m637-CR09 |
 |
 |
| Number counts | Number counts |
 |
 |
| Differential reliability | Differential reliability |
 |
 |
| Cumulative reliability | Cumulative reliability |
| 2708p636-CR05 | 2708p636-CR09 |
 |
 |
| Number counts | Number counts |
 |
 |
| Differential reliability | Differential reliability |
 |
 |
| Cumulative reliability | Cumulative reliability |
The trends in these plots are generally good with all SNR > 20 sources matched at W3 and W4, almost all at W2 such the the cumulative reliability does not drop below the 99.9% requirement even when including the faintest magnitudes, and W1 dropping below 99.9% only at W1 > 14 to 15.
The nature of the unmatched W1 sources can be determined by examination of the images. Figure I3 shows an image of the 0891m637 field with all the matched sources marked with a "+", and all the unmatched sources marked with a circle. Blue in this case is W1, green is W3, and red is the markers.
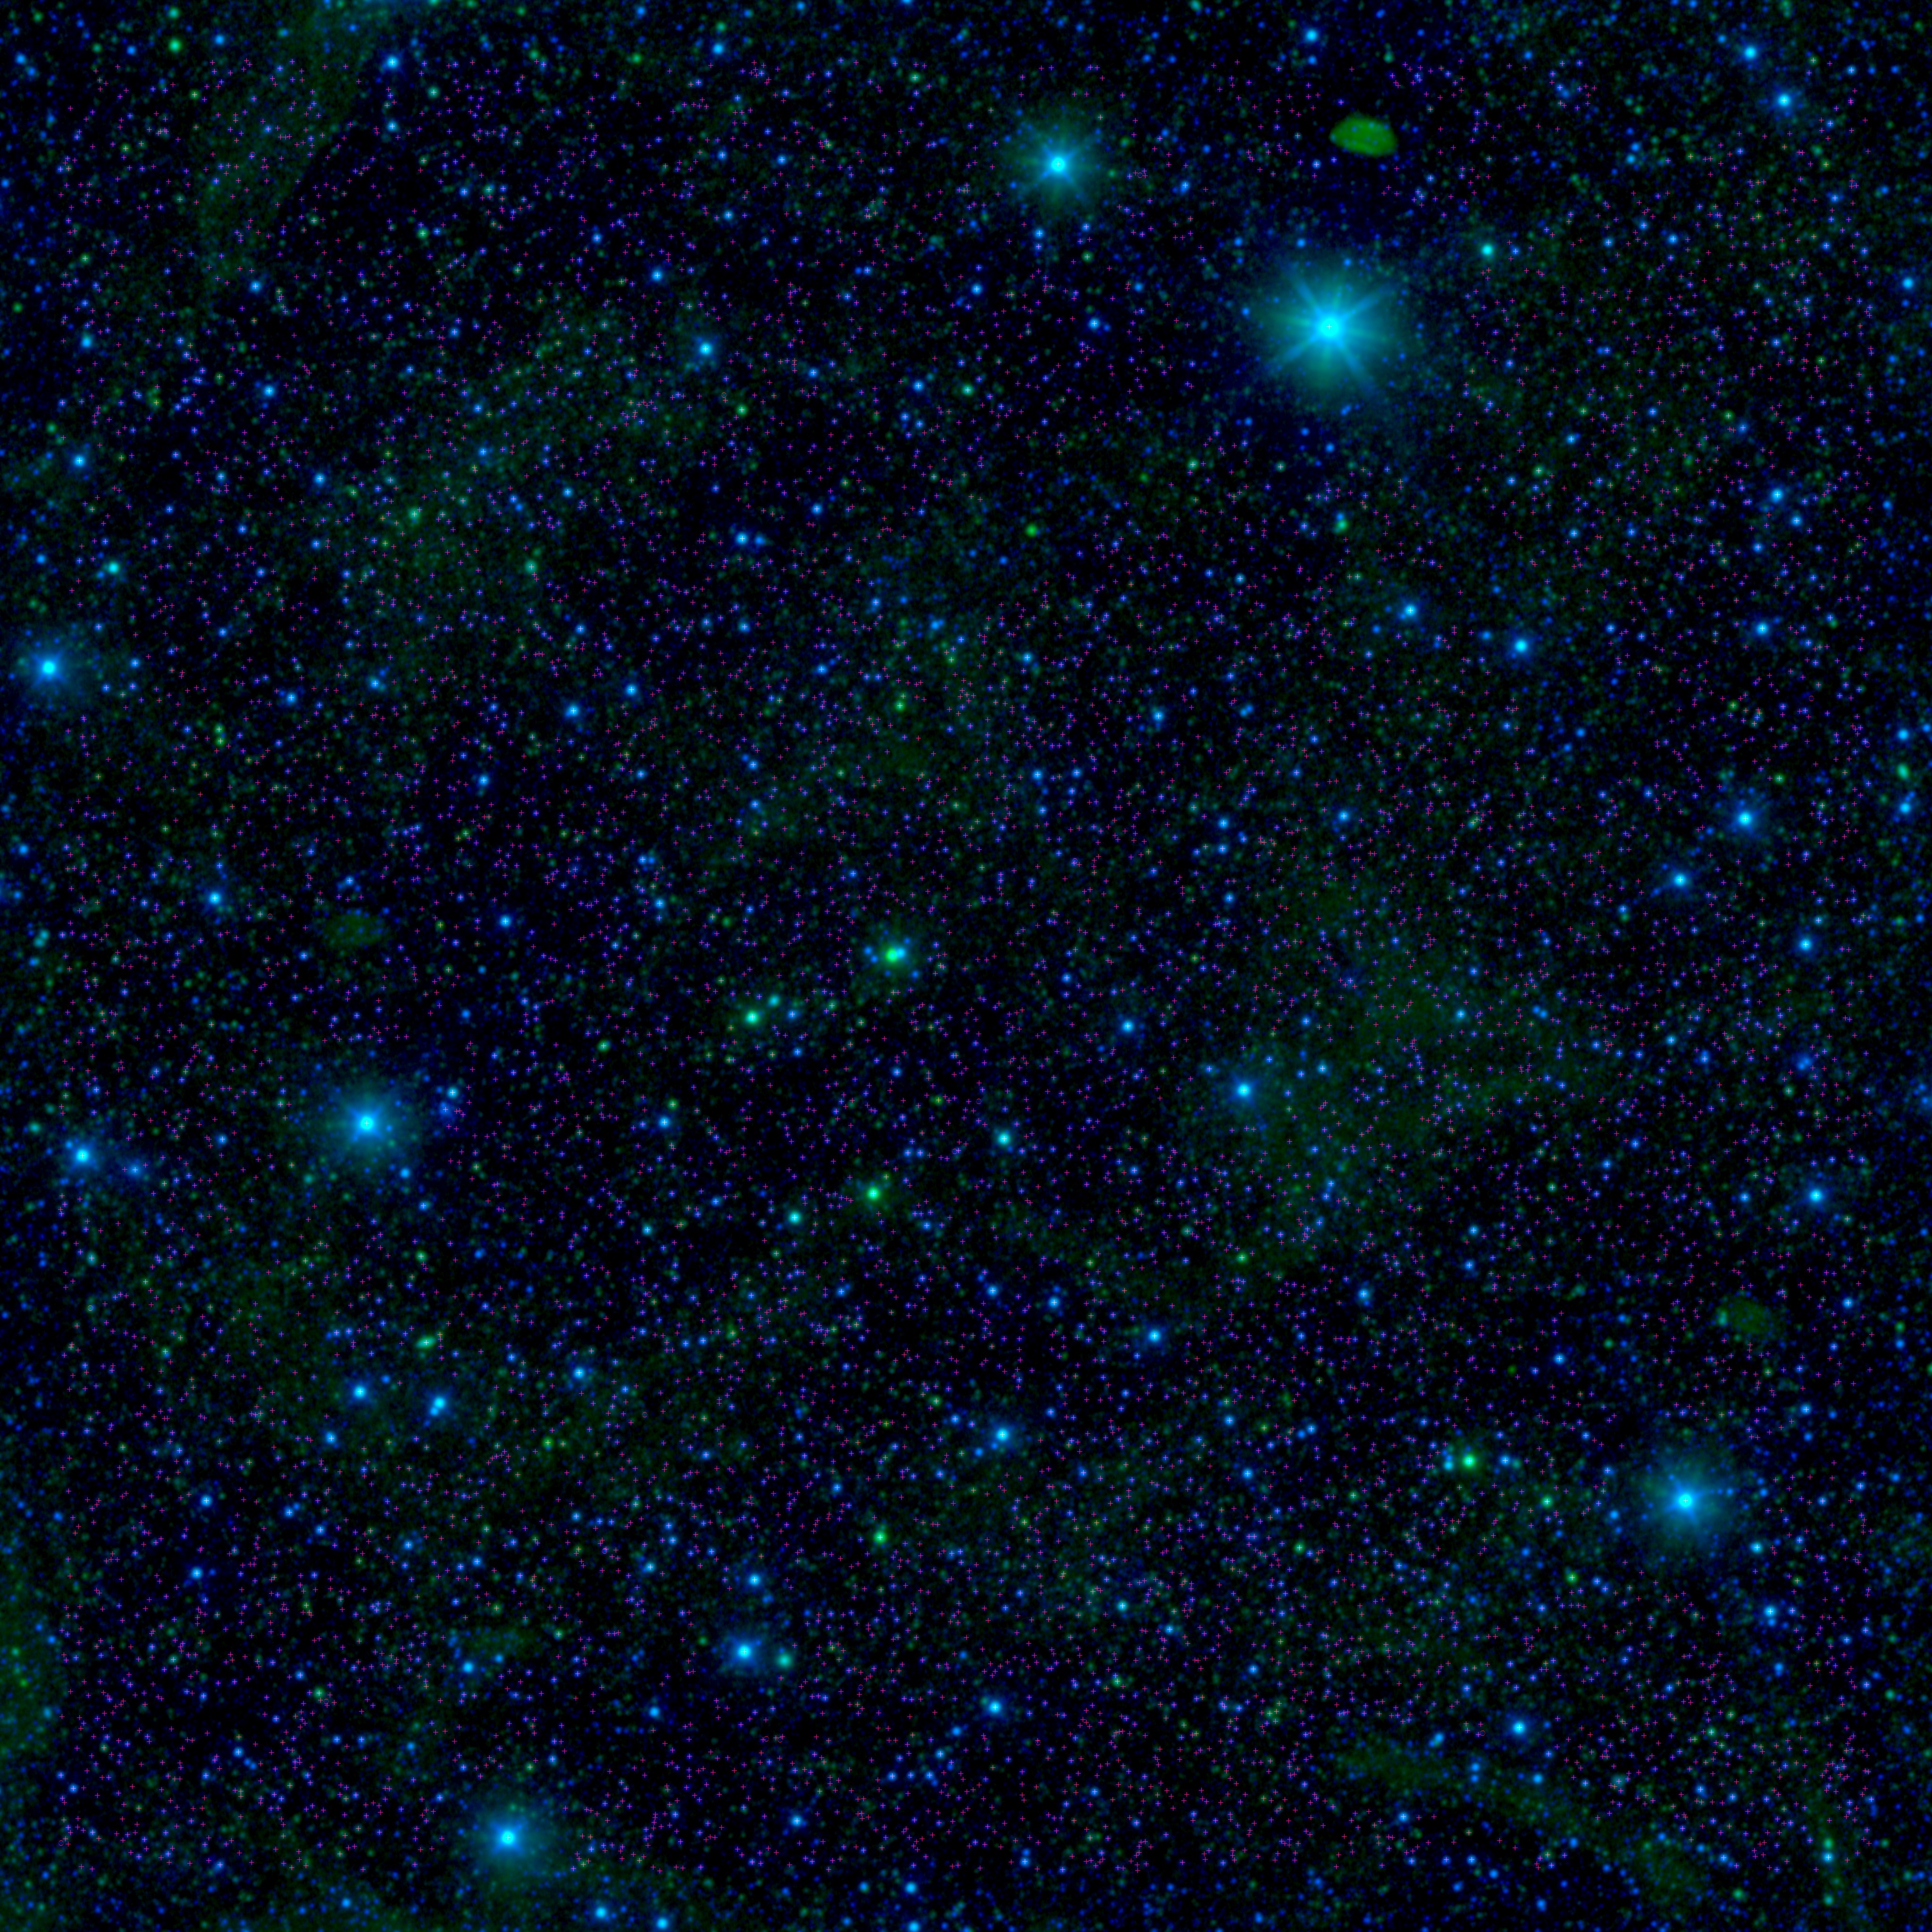 |
| Figure 3 - An image of the 0891m637 field with all matched and unmatched sources marked. Display the 4095x4095 pixel image at 100% and pan around to clearly see all the symbols. |
The majority of the unmatched sources are in very confused blends; the shallower data might emphasize something that later gets smoothed out in the deeper sets. No attempt was made to filter out such blends in the statistics. Another source of loss is at the edges of the evaluated region, somewhat in from the edge of the frame of the image. Edges were intentionally avoided to eliminate photometric issues. If the centroid of a source shifted slightly as more data were coadded, it could become lost from the test area.
Also of note are the many seemingly legitimate sources that are not tagged either way. These are objects that were rejected from the statistics either because they were not accepted into the Catalog in the first place (tagged as spurious because of contamination) or because they were in the Catalog but dropped from the statistical analysis because of overlap with some contaminant (i.e. the cc_flags column was not precisely "0000"). The contaminant flagging is quite conservative (rejects more sources than is perhaps needful) but this helps ensure a high reliability Catalog.
Overall, then, the internal reliability test indicates that, with the exception of the faintest W1 sources, the 99.9% reliability requirement is satisfied for SNR > 20 sources at all wavelengths.
Color-color diagrams from Spitzer show that the majority of Main Sequence stars have a color near 0.0 between the 3.5 and 4.6 Ám bands; these are very close to the WISE W1 and W2 bands. The 2MASS data show similar characteristics except for the J-H color where the blackbodies of cooler stars start to turn over; this leads to a wider spread of colors, but that is unimportant for this simple test. We therefore define a "star" in two slightly different ways to see how these objects match up with 2MASS: 1) any object that is bluer than W1 - W2 < 0.2 that will be referred to as "blue color" objects, and 2) a stricter selection where the range of colors is limited to |W1 - W2| < 0.1 known as "zero color" objects.
Our assumption, then, is that a WISE star that has a W1 magnitude of 13.0 will also have an H or K magnitude of 13.0, and thus it should be present in the 2MASS catalog. Comparing the catalogs, the 20 sigma sensitivity of WISE is found to be approximately W1=15.5 and W2=14.1 which is quite near the 2MASS 99% completeness range of J=15.8, H=15.1, and K=14.3. Thus, we would expect an excellent correlation between the catalogs to a limit of W1=14 to 15 for star-like sources.
To perform this test, we have selected sources from 4 sq. deg. patches located 20, 40, and 60 degrees away from the Galactic plane (i.e. b=▒20, ▒40, and ▒60) in 15 degree increments (l=0, 15, 30, ...) in Galactic longitude for b=▒20, and 30 degree increments (l=0, 30, 60, ...) for b=▒40 and ▒60. No effort was made to avoid potentially problematic regions; indeed, one of the patches is near the Orion Nebula, and another is in the Hyades star cluster. Using this sampling method, 946,781 sources of all types with a SNR > 20 in at least one band were found. We further restrict the selection by using only those sources that are not superimposed on any artifact (cc_flags = "0000"), as stated in the requirement. Of these uncontaminated sources, 706,616 are found to be stars for the blue color threshold; only 495,964 are stars for the zero color definition. A 2MASS source was considered to be a match to the WISE source if the difference in coordinates was less than 3.0 arcseconds. (Recall that a raw single-frame pixel in the WISE W1, W2 and W3 data is 2.75 arcseconds.)
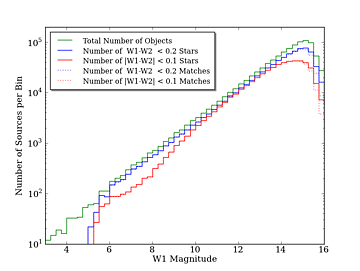
The results are presented in Figures 4 and 5. Figure 4 shows the number of 20 sigma sources found per each 0.25 magnitude bin in W1. Several things stand out: for the blue color threshold, almost all the objects are stars (the constant ratio between the solid blue and green curves; the difference is almost entirely stars that have some contaminant). The number of 2MASS matches for these stars starts to drop at about W1~14.75, as predicted earlier. Curiously, for the zero color threshold stars, the fraction of objects that are rejected as stars in the magnitude range from 6 to 10 (nearly 50%) is far greater than those in the 10 to 13 magnitude range (< 10%). This suggests that either the brighter stars are redder on average, or it could be an artifact of the difficulty in measuring the W1 magnitude for these bright sources.
 |
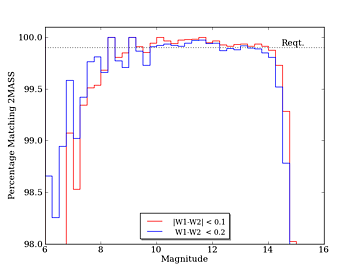 |
| Figure 4 - Number of source found in each 0.25 magnitude bin. | Figure 5 - Fraction of 2MASS matches per bin. |
Figure 5 shows the fraction of WISE sources that have counterparts in the 2MASS catalog for each magnitude bin. For both definitions of a star, 99.9% of the WISE stars have a 2MASS counterpart from magnitudes 9.0 to 14.0. Past 14.0, the completeness of the 2MASS catalog impacts the matching fraction. At magnitudes brighter than 9.0, there are at most 1000 sources in each magnitude bin, so a single missing star drops the fraction below 99.9%. At 6th magnitude, a single missing source drops the reliability below 99.0%.
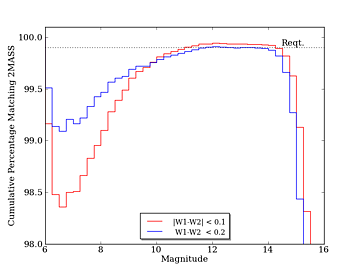 |
| Figure 6 - Cumulative fraction of 2MASS matches as a function of magnitude limit. |
The cumulative statistics shown in Figure 6 reinforce this picture. It's not until 11th magnitude that the sheer bulk of faint sources pulls the statistics up from the missing bright sources. A number of the unmatched bright sources were investigated by hand to determine why they were missed; in all these cases, there was in fact a bright 2MASS source in the vicinity, but it lay between 3.0 and 3.5 arcseconds away from the WISE position. This is not entirely unexpected; these bright stars will tend to be close by, and in the decade between the 2MASS and WISE surveys, the proper motion of these sources could move them outside the 3 arcsecond match radius.
Therefore, the WISE Source Catalog is found to achieve 99.9% reliability for SNR > 20 sources and to be compliant with the reliability requirement within the constraints of the 2MASS catalog completeness and our definition of a "star."
There are two caveats that must be noted on both the quality of both the WISE and Spitzer data, however: 1) the WISE data are contaminated by scattered moonlight, thus the backgrounds are not very flat and faint sources could have been missed, and 2) the Spitzer data has only two coverages, thus asteroids and transients may not be sufficiently filtered out of the Spitzer lists. While these two conditions will affect a study of completeness of the WISE data, reliability is fairly robust since we can compare whatever sources WISE found even if they are not complete, and a few stray asteroids or cosmic ray hits in the Spitzer data will not help confirm matches to actual WISE sources.
Sources were selected from the WISE Catalog by searching on the coadd_id, then applying additional filters for two cases. They are summarized here:
To compute the reliability, a search was made for a Spitzer source within 3 arcsec of each WISE source satisfying the above conditions. WISE sources that had Spitzer matches were tallied according to their magnitudes (magnitude bins are 0.5 mag wide). WISE sources that did not have any matches were written out to a file for follow-up. Many of these unmatched sources were examined on Spitzer images to determine if the WISE sources were real. In most cases, the source was a blend of 2 or more Spitzer sources in the WISE images. These sources are included in the WISE-Spitzer matched lists. Only those sources for which a convincing Spitzer counterpart could not be found were left in the unmatched group. The reliability was then computed as the number of matched WISE-Spitzer sources divided by the number of WISE sources in each magnitude bin. Note that since not all of the unmatched WISE sources have been followed up on the Spitzer images, the reliabilities quoted here are lower limits to the true reliability.
Figure 7 shows the number counts for the field. Even in W3 where there are only a few hundred sources, the counts increase as a power law with a slope similar to W1 and W2. W4 simply has two few sources to see any similar trend.
Figure 8 shows the fraction of those sources with a Spitzer match. The match rate of the stellar sources is very good, with only a single object in W2 unmatched. The match rate of the general object list is not as good, but based on the need to investigate the stellar sources by hand, it is likely that the Spitzer list is incomplete and more hand matching to the Spitzer images will need to be done.
Figure 9 shows the cumulative reliability for the Taurus field, and for the star-like objects, demonstrates that the 99.9% reliability requirement is met for all four bands. For the general object list, the reliability of W1, W2, and W3 is no worse than 99%, but these numbers should improve as more hand investigation is completed, and the final pipeline processing commences.
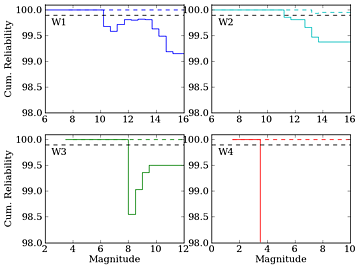 |
| Figure 9 - Cumulative reliability for the Taurus Field. The reliability of the stellar sources meets the overall requirement. More work needs to be done to check the non-matches for all sources. |
In summary, this exercise demonstrated that the Spitzer source lists were incomplete and required close visual inspection of the Spitzer frames to determine if any sources existed at the locations of the unmatched WISE sources. As such, this particular Spitzer field is not an ideal truth set, but the technique is a feasible one if care is taken to ensure the Spitzer data is complete. All but a few of the checked W1 WISE sources were on the Spitzer frames, and in no case is the inferred reliability under these conditions less than 99.9%. For this test, at least, the reliability requirement is clearly met.
Last update: 2011 March 28