VI. Analysis of Release Products
6. Catalog Completeness
a. Requirement
The WISE Source Catalog shall be at least 95%
complete for sources detected with SNR > 20 in at least one band, where
the noise includes flux errors due to zodiacal foreground emission,
instrumental effects, source photon statistics, and neighboring
sources. This requirement shall not apply to sources that are
superimposed on an identified artifact.
Because the coverage of the WISE survey is nonuniform the SNR, source
confusion, and the resulting completeness levels will vary with
position on the sky. Therefore it is not possible to provide a single flux
density in any one band at which the data are 95% complete. For the
test fields (described below) we have determined that on average a SNR = 20 is
reached at flux densities of 175, 320, 2550, and 21760 microJy in W1,
W2, W3, and W4, respectively (= 15.6, 14.3, 10.2 and 6.5 mag).
b. Methodology
To determine the completeness we have carried out tests with the WISE
data by taking advantage of two of the polar fields with the deepest
coverage, tiles 2708p636 and 0891m637.
Table 1 - High Latitude Test Tiles
| Tile | R.A. | Declination | Eclip.Long. | Eclip.Lat. | Gal.Long. | Gal.Lat. |
| 0891m637 | 89.17615245 | -63.606667 | 82.9242 | -87.0257 | 272.9707 | -30.1350 |
| 2708p636 | 270.8312778 | +63.606667 | 277.1390 | +87.0253 | 92.9954 | +29.3998 |
For these two tiles, special
processing was carried out by the WSDC, using the same reduction
software used to produce the Preliminary Release Catalog, to produce
coadds of subsets of the frames obtained in each tile during the many
passes made by WISE during its mission. The median and maximum frame depths of these coadds are listed
in the table below.
Table 2 - Coadded Data Sets
| Name |
Median Depth
(frames) | Maximum Depth
(frames) |
| CR01 | 16 | 30 |
| CS16 | 12 | 26 |
| CS08 | 29 | 52 |
| CS04 | 51 | 95 |
| CS02 | 113 | 168 |
We use the deepest
coadd CS02 as the "truth" set against which the catalogs at shallower
depths are compared to determine the completeness. Because
the median depth of coverage is about 12 frames in the Preliminary
Release, the completeness results for the 12-frame coadds in the two
high latitude tiles will provide a reasonable approximation to the typical completeness
for the survey. However, users are cautioned that the actual completeness at any one position on the sky will also depend
on the local source density.
The catalogs for each coadded image were generated identically to the
way that the Preliminary Release Catalog was produced. This means
that there are a large number of catalog entries for which the only real
detections occur in W1 and W2, and for which the information in W3 and W4 is based
on upper limits. Therefore we have followed the procedure described
below when calculating completeness fractions. This procedure was designed to attempt to
produce meaningful completeness information particularly for W3 and W4. The
procedure was carried for each coadd depth (median levels of 12, 16, 29, 51, and 113 frames). The catalog which is being
tested is referred to here as the target catalog:
-
Starting with the first entry in the truth catalog, find the
closest positional match, within a radius of 3 arcsec, to it from the target catalog, while making sure
that there are no multiple matches of target catalog objects to the same truth catalog source.
-
For this matched pair of sources (one entry from the truth catalog, one entry from
the target catalog) look at the w1snr values of the truth and target
catalogs. If both have w1snr > 5, then declare this match to be a real W1
match and tabulate at the w1mpro flux density in the truth catalog.
- Repeat this procedure for this same matched pair of entries but now
look at the w2snr values. If both have w2snr > 5, then declare this match to be a real W2
match and tabulate at the w2mpro flux density in the truth catalog.
- Repeat this procedure for this same matched pair of entries but now
look at the w3snr values. If both have w3snr > 5, then declare this match to be a real W3
match and tabulate at the w3mpro flux density in the truth catalog.
- Repeat this procedure for this same matched pair of entries but now
look at the w4snr values. If both have w4snr > 5, then declare this match to be a real W4
match and tabulate at the w4mpro flux density in the truth catalog.
-
Repeat step 2 for every entry in the truth catalog, keeping track of
the real matches in each band.
-
When step 3 is completed, then for each band count up the real matches
(determined in step 2) within a chosen bin of flux densities.
-
Next, for each band, count up the number of real detections (using the
same w?snr > 5 criterion used in step 2) in the truth catalog in the same flux
density bin.
-
Finally, for each band, divide the result of step 4 by that from step 5
to calculate the completeness fractions in the various flux density bins
c. Completeness Estimates
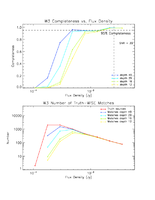
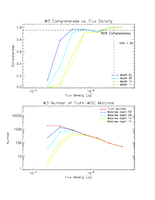
The results of the tests described above are shown in the following
figures. Each figure shows the results of the two tiles separately
for each band. For each tile we show two plots, the differential
completeness fractions as a function of flux density, as well as the
absolute number of real matches also as a function of flux density.
In both plots within a figure, different curves are shown for the various coadd
depths.
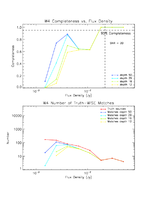
As seen in the plots, the Level 1 requirement is met by the
median depth data (the 12-frame depth curves) in the W1, W2, and W3
data. Due to the very small number of sources
at the bright end in W4 in the two test tile areas, it is difficult to
reliably assess the W4 completeness from this method alone.
The 0891m637 tile results suggest that the W4 data are 95% complete
to just under 20 mJy, i.e. fainter than the nominal SNR = 20 flux
density. Table 3 provides the flux density levels, averaged between
the two high latitude tiles, for the 95% completeness levels in the
four bands. These completeness levels are appropriate for the source
densities of high Galactic latitude areas in the Preliminary Release
catalog. The dependence of the completeness on coverage,
illustrated by the other curves in the plots, is as
expected: the completeness is higher at lower flux densities when the
coverage is deeper.
Table 3 - 95% Completeness
| Band | Flux Density
(milli-Jy) |
| W1 | 0.070 |
| W2 | 0.070 |
| W3 | 1.5 |
| W4 | 18 |
 |
 |
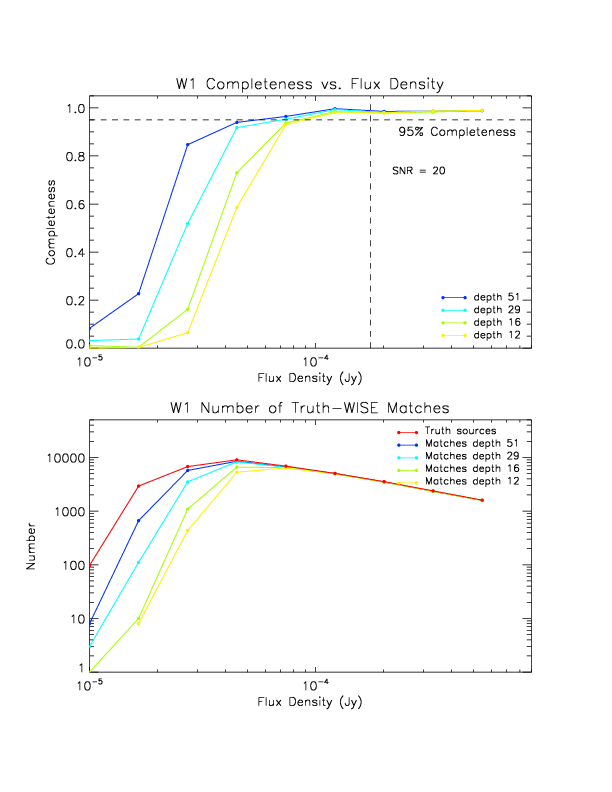
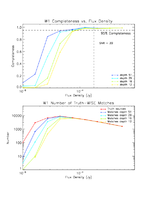
| Figure 1a - (top) Completeness in W1 as a function of W1 flux density in the
0891m637 tile. (bottom) Number of real matches and truth sources in
the W1 data in the 0891m637 tile vs W1 flux density. |
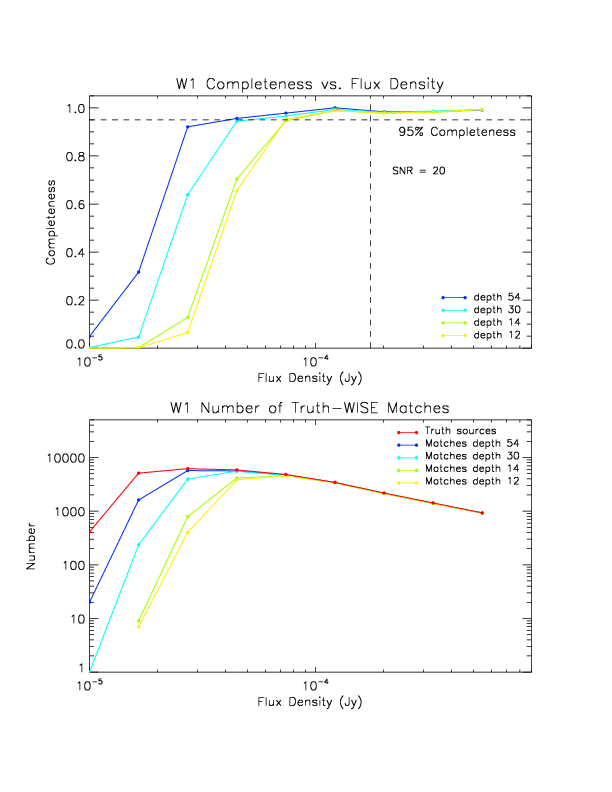
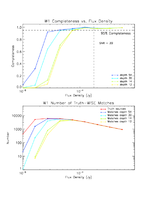
Figure 1b - (top) Completeness in W1 as a function of W1 flux density in the
2708p636 tile. (bottom) Number of real matches and truth sources in
the W1 data in the 2708p636 tile vs W1 flux density. |
 |
 |
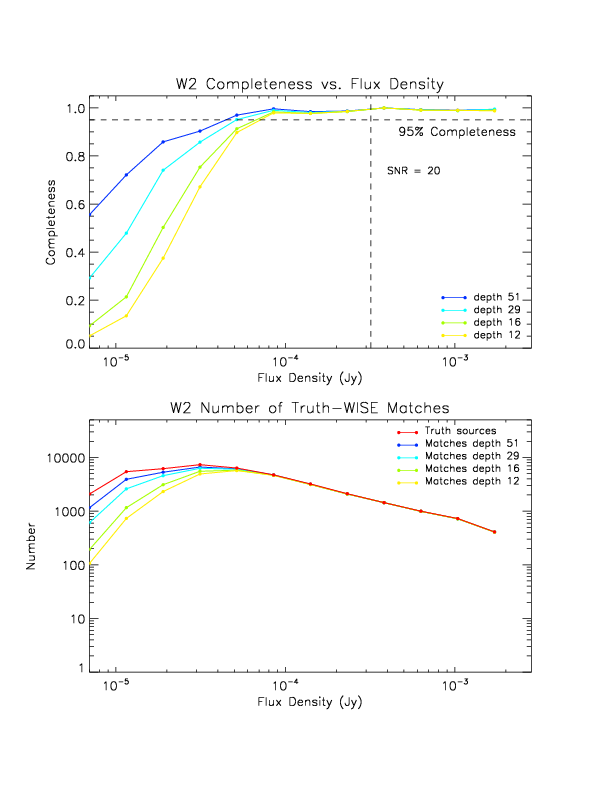
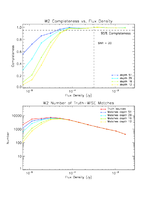
| Figure 2a - (top) Completeness in W2 as a function of W2 flux density in the
0891m637 tile. (bottom) Number of real matches and truth sources in
the W2 data in the 0891m637 tile vs W2 flux density. |
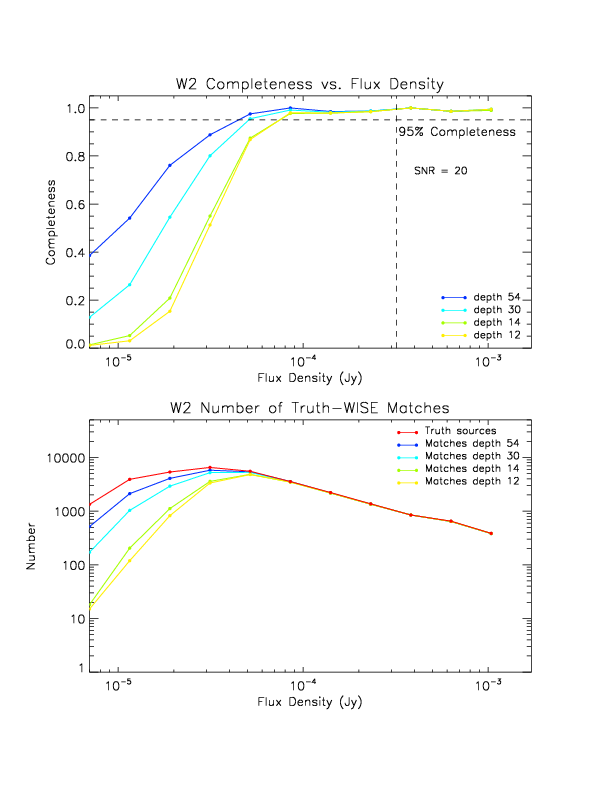
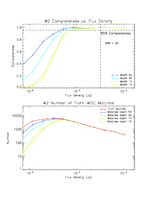
Figure 2b - (top) Completeness in W2 as a function of W2 flux density in the
2708p636 tile. (bottom) Number of real matches and truth sources in
the W2 data in the 2708p636 tile vs W2 flux density. |
 |
 |
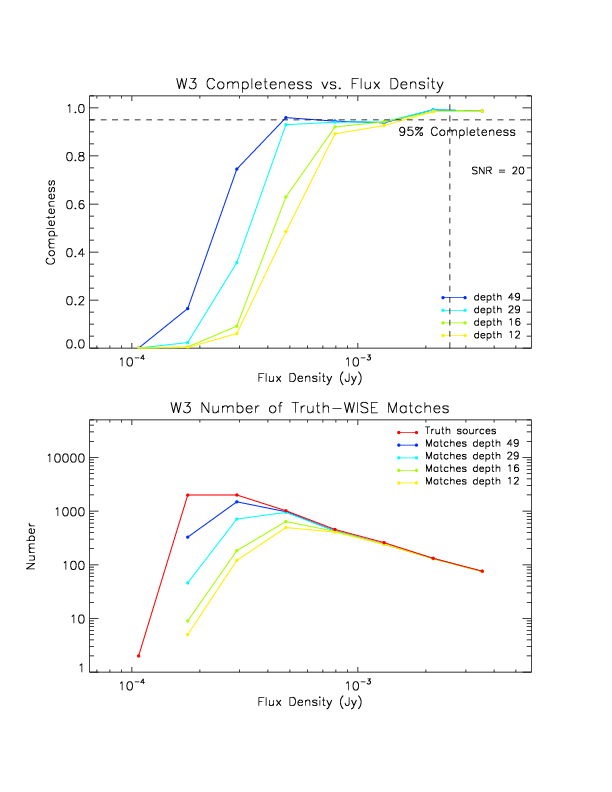
| Figure 3a - (top) Completeness in W3 as a function of W3 flux density in the
0891m637 tile. (bottom) Number of real matches and truth sources in
the W3 data in the 0891m637 tile vs W3 flux density. |
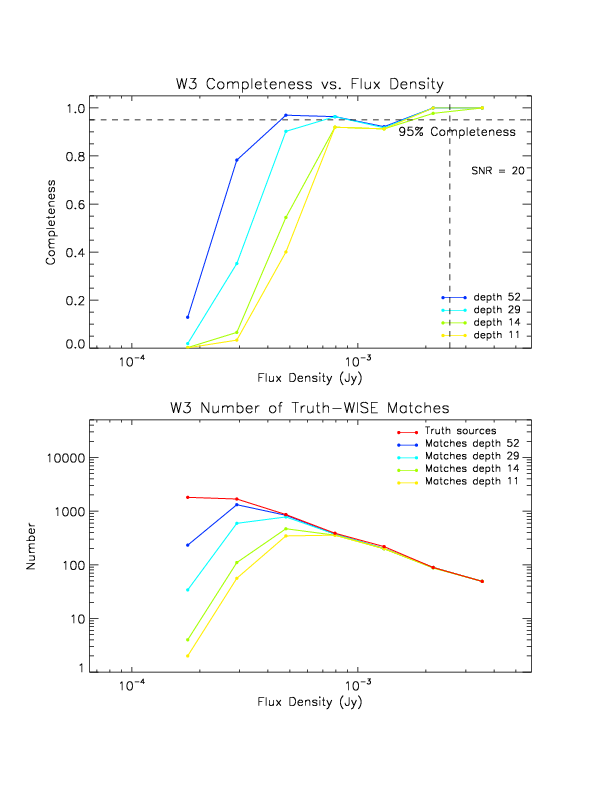
Figure 3b - (top) Completeness in W3 as a function of W3 flux density in the
2708p636 tile. (bottom) Number of real matches and truth sources in
the W3 data in the 2708p636 tile vs W3 flux density. |
 |
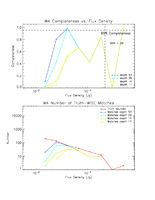 |
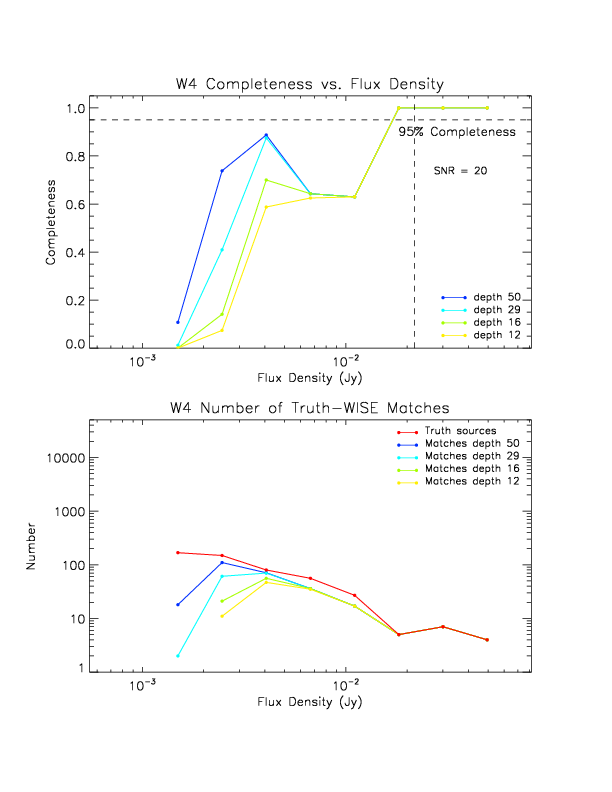
| Figure 4a - (top) Completeness in W4 as a function of W4 flux density in the
0891m637 tile. (bottom) Number of real matches and truth sources in
the W4 data in the 0891m637 tile vs W4 flux density. |
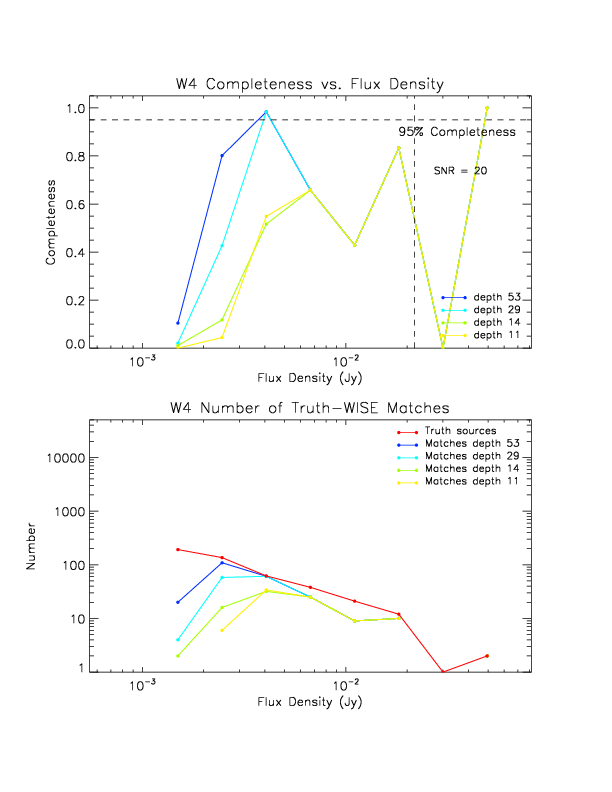
Figure 4b - (top) Completeness in W4 as a function of W4 flux density in the
2708p636 tile. (bottom) Number of real matches and truth sources in
the W4 data in the 2708p636 tile vs W4 flux density. |
Last update: 2011 March 28
Previous page Next page
Return to Explanatory Supplement TOC