


IV. NEOWISE Data Processing
IV.4. Quality Assurance
IV.4.d. Image Quality Behavior with Time
There may be instances when investigators will want to examine the variations in NEOWISE image quality over time. For example, in the absence of AllWISE-like coadded image processing, changes in detection limits, coverage rates, or in-image object classification (e.g., stars vs. galaxies) may become important for certain types of investigations (e.g., Kurcz et al. 2016). Here we describe the behavior of image quality parameters as a function of time over the course of the NEOWISE Reactivation mission.
Image quality is monitored as a function of time using several metrics. From a diagnostic standpoint, the most revealing of these are the number of noise pixels (noisepix), PSF axial ratio (rbovera) and the relative number of image quality failures per day. The number of noise pixels (noisepix) is a measure of the compactness of stellar images; noisepix values > 13.5 in W1 are an indicator of possible image smearing or other image quality degradation. Image smearing can result from deliberate spacecraft attitude adjustments, reorientations during periodic angular momentum dumps, or unavoidable jitter caused by excessive contamination by moonlight or high cosmic ray fluxes in one or both star trackers. The rbovera metric is the ratio of minor to major axes of the PSF measured for the shortest wavelength band available, usually W1. This parameter provides another diagnostic for image smearing, and is also used as a monitor of the synchronization of the telescope scan rate with the scan mirror motion. The noisepix and rbovera values measured for each frame are provided in the Single-exposure Frame Metadata Table.
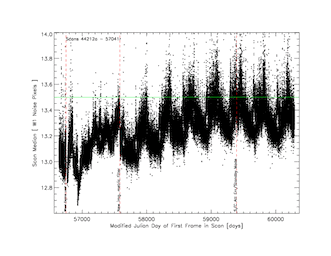
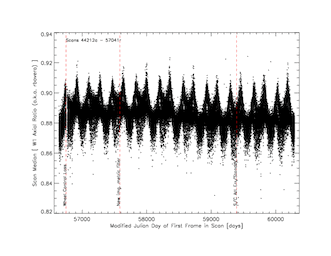
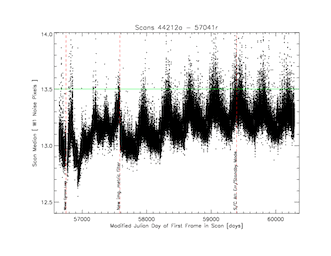
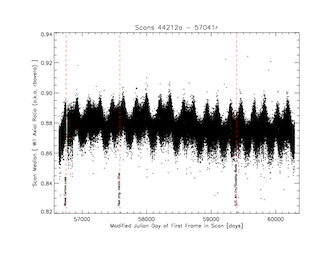
The behavior of the W1 number of noise pixels (noisepix) and axial ratios (rbovera) during the eleven years of the NEOWISE Reactivation survey are shown in Figure 1. The green line in Figures 1a and 1b indicates the level at which the image quality score is reduced from 1.0 to 0.5. Frames are automatically given a failing QA score if the value of W1 noisepix exceeds 15.0. Vertical dashed lines indicate significant flight system events such as updating scan mirror rates or the star tracker parameters. The lower panels show the same quantities after filtering out frames lying within 15 degrees of the Galactic plane.
a |
c |
b |
d |
| Figures 1a-d - Median W1 number of noise pixels (noisepix) and PSF axial ratio (rbovera) per scan vs. time during the eleven years of the NEOWISE Reactivation mission. The upper panels show medians over all frames (Table 1, .tbl, 4.4 MB) while the lower panels
include in the medians only those frames with |b|>15 degrees (Table 2, .tbl, 4.4 MB). The vertical red dashed lines indicate the times of flight system events that may have impacted image quality. Click to enlarge. |
In addition to the obvious discontinuities (due, for example, to spacecraft safe mode entries) there are broader undulations with periods of roughly six months. The bifurcations and relatively spiky peaks coincide with Galactic center crossings. The peaks are caused by severe imaging crowding in and around the Galactic center that artificially elevates noisepix values, while the lower arms of the bifurcations correspond to scans on the opposite side of Earth, in the Galactic anticenter direction. Superimposed on these spikes and bifurcations are broader undulations that appear to correlate with telescope temperature.
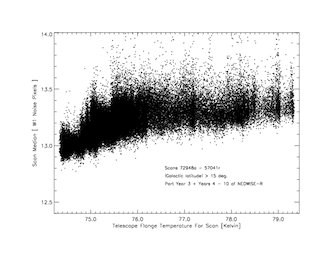
The median noisepix value for all frames with |b| > 15 deg in a scan is plotted as a function of the telescope interface flange temperature in Figure 2 for framesets taken during part of the third and all of the fourth through eleventh years of the NEOWISE Reactivation survey. The method of image metrics computation
was modified as explained in Section IV.4.e, and data were plotted here after that modification. Apart from pile-ups near 74.4, 74.8, 75.1, 75.5, 76.15, 77.2, 77.8, 78.2, 78.55, 78.9, 79.3 K, 81.4 K, 82.1 K, and 82.6 K, which generally correlate with peaks and valleys in temperature as a function of time (Figure 11 in section I.2.c.iii), there is a weak correlation between noisepix values and temperature.
The median rbovera value for all frames with |b| > 15 deg in a scan is plotted as a function of telescope temperature in Figure 3. This trend also shows pile-ups near 74.4, 74.8, 75.0, 75.6, 76.15, 77.2, 77.8, 78.2, 78.55, 78.9, 79.3 K, 81.4 K, 82.1 K, and 82.6 K. Apart from these discontinuities, there is a very weak anti-correlation of image axial ratio with telescope temperature, suggesting that the PSF becomes slightly more elongated as temperatures increase. The weakness of the anti-correlation is an indication that the scan mirror motion is very stable and largely insensitive to the temperatures that have been seen to date.
 |
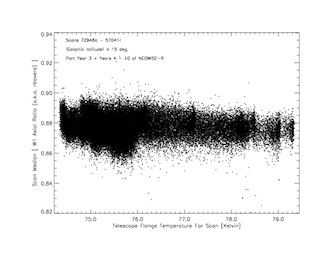 |
| Figure 2 - Median W1 number of noise pixels (noisepix) per scan (Table 2, .tbl, 4.4 MB) vs telescope flange temperature (Table 3, .tbl, 4.3 MB), for frames taken during part of the third and all of the fourth through eleventh years of the NEOWISE survey, as explained in the text. Click to enlarge. | Figure 3- Median W1 axial ratio (rbovera) per scan (Table 2, .tbl, 4.4 MB) vs. telescope flange temperature (Table 3, .tbl, 4.3 MB), for frames taken during part of the third and all of the fourth through eleventh years of the NEOWISE survey, as explained in the text. Click to enlarge. |
The percentage of framesets per day with excessive values of noisepix or abnormal rbovera that are assigned failing scores by the QA system, is shown in Figure 4. This failure rate was between 4 and 8% early in the NEOWISE mission, but was reduced to about 2% after an onboard adjustment to one of the star tracker temperature set points. Owing to the general increase in noisepix values with time (Figure 1), more framesets are exceeding the failure thresholds. This is most likely due to the long-term increase in the telescope temperature.
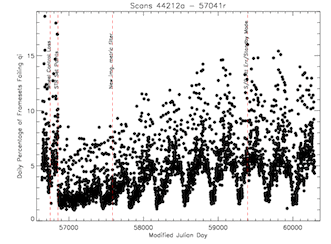 |
| Figure 4- Percentage of framesets per day failing image quality metrics vs. time (Table 4, .tbl, 66 KB). Click to enlarge. |
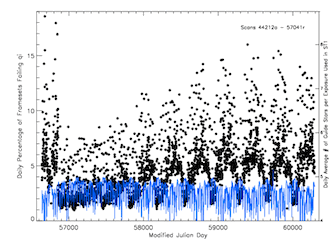
The percentage of framesets per day failing image quality metrics (Figure 4) shows a precipitous, month-long drop in January or February of each year. This drop (Figures 4 and 5) corresponds to an annual peak in the average number of guide stars used per frameset in star tracker-1 ("ST1"), as the offset, annular fields of view of the star trackers sweep around the sky. This average number of guide stars used per frameset is overplotted as a blue line in Figure 5. A correspondence between dips in the number of guide stars and peaks in the percentage of framesets per day failing image quality is also evident. Similar correspondences exist for star tracker-2 ("ST2") but are much less pronounced and are not shown here for brevity. Figure 6 shows the percentage of framesets per day failing image quality metrics as a function of the daily average number of guide stars used per exposure in ST1. As we would expect from Figure 5, a strong anti-correlation is apparent.
 |
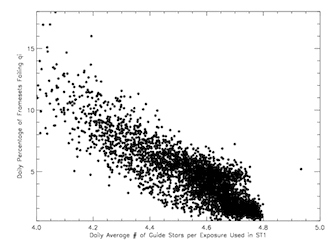 |
| Figure 5 - Percentage of framesets per day failing image quality metrics vs. time, similar to Figure 4 (Table 4, .tbl, 66 KB). The blue line is the daily average number of guide stars per frameset used in star tracker-1 ("ST1"; right-hand side y-axis) vs. time (Table 5, .tbl, 89 KB). Click to enlarge. | Figure 6- Percentage of framesets per day failing image quality metrics (Table 4, .tbl, 66 KB) vs. daily average number of guide stars per frameset used in star tracker-1 ("ST1") (Table 5, .tbl, 89 MB). Click to enlarge. |
Last update: 17 October 2024


