VI. Analysis of Release Products
4. Photometric Properties
d. Characteristic Source Brightness for the Onset of Saturation
Summary
The characteristic magnitudes at which sources in the Preliminary Release
Source Catalog begin to the saturate are 8.0, 6.7, 3.8
and -0.4 mag
in W1, W2, W3 and W4, respectively. WISE profile-fitting photometry
extracts useful measurements of saturated sources using the
non-saturated wings of their profiles until too few non-saturated
pixels are available in the measurement area.
Profile-fit photometry begins to fail for sources brighter than
1.0, 0.0, -2.0 and <-6.0 mag in W1, W2, W3, and W4, respectively.
i. Saturated Source Characterization
The profile-fitting photometry module of the
WSDS (WPHOT) subsystem characterizes sources
that are saturated by fitting the PSF to the non-saturated portions of the
source profile. As long as there are sufficient numbers of
non-saturated pixels available within the fitting area (7.25" radius
in W1-3 and 15" radius in W4), the source brightness and position can be
extracted. In the first-pass processing,
measurements were not reliably extracted for sources that are
so bright that too few non-saturated pixels are
available for a fit.
Although WPHOT returns a flux measurement saturated sources, the accuracy
of the measurements may be degraded. Photometric uncertainties are elevated
at the onset of saturation, and other biases lead
to systematic errors in the estimated flux levels as saturation
intensifies.
During the measurement of each source, WPHOT determines the fraction of pixels
that are saturated within the fitting region, and reports the values
in the w?sat
fields of the source Catalog record. Saturated pixels are identified by
WPHOT using the single-exposure bit-masks that
capture the DEB saturated-pixel encoding provided in the raw
payload image data. A pixel may saturate because of the
presence of a bright astrophysical source, or from the strike of an
energetic cosmic ray. We make use of these saturated pixel statistics
to determine the characteristic brightness at which point sources
reach saturation and at which WPHOT is unable to return a useful magnitude.
ii. Saturation as a Function of Brightness
1. Source Catalog
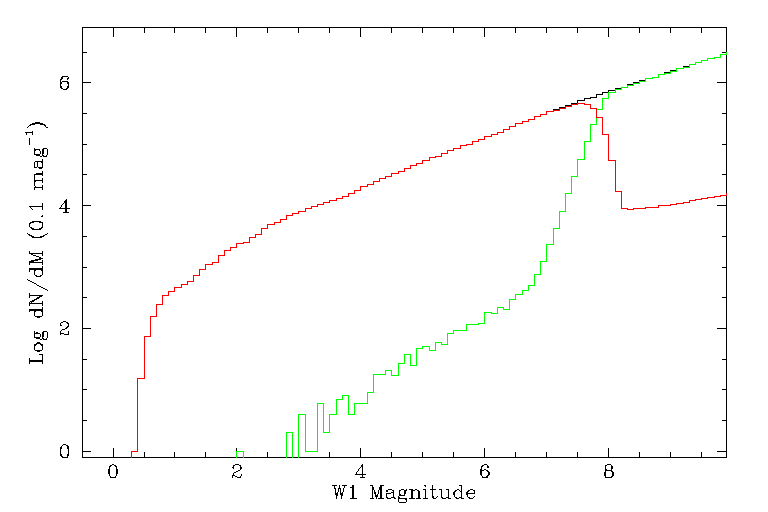
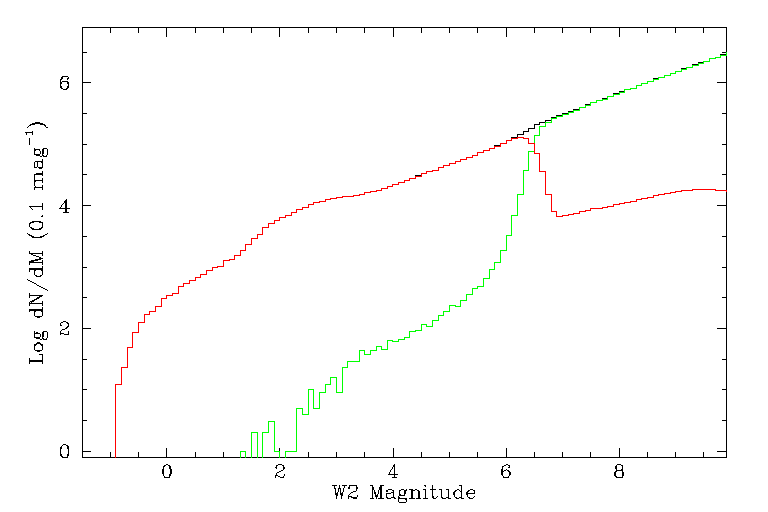
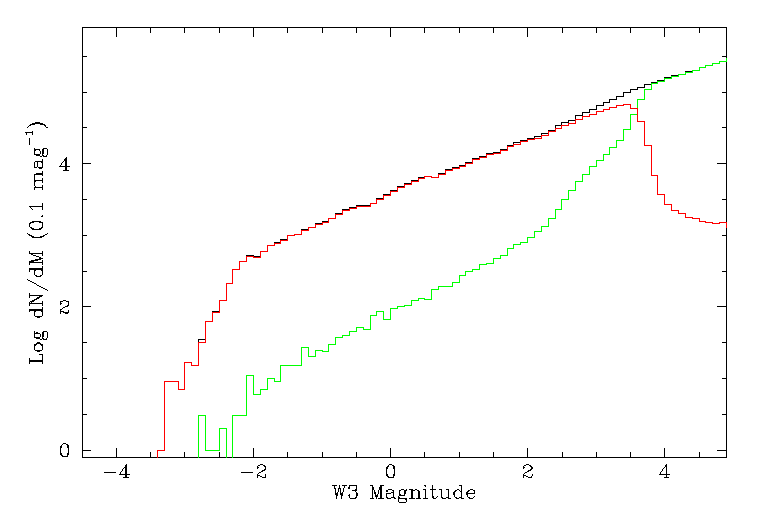
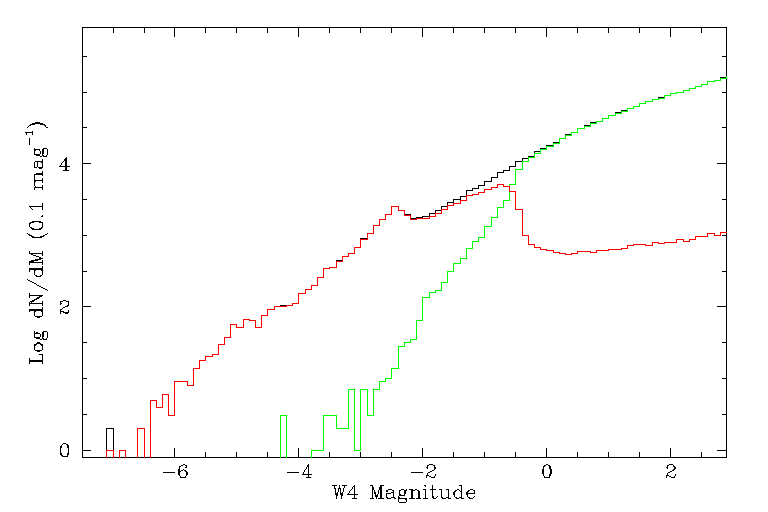
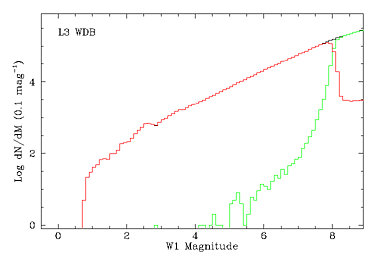
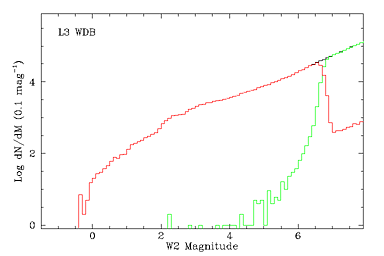
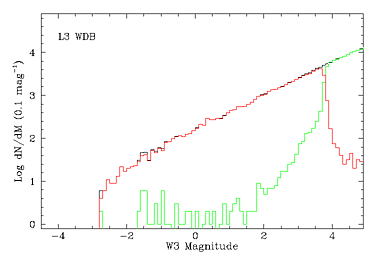
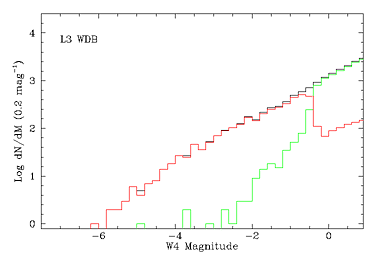
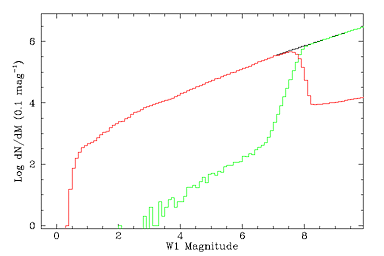
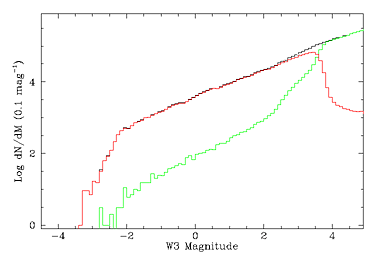
Figures 1-4 show differential source counts
near the saturations levels from the Source Catalog.
In each of these diagrams, differential source counts are plotted as a
function of profile-fit magnitude,
w?mpro.
The black curves represent all sources, the green curves are sources that
have w?sat=0 and the red curves are sources that
have w?sat>0.
W?sat values are computed in the Multiframe Pipeline version of WPHOT
(IV.5.c) using the pixels in all of the frames
in the "stack" that contribute to a source measurement in a particular band.
The onset of saturation for point sources is indicated by the
transition between the curves for saturated and non-saturated sources.
The saturation boundary is well-defined but not perfectly
sharp because the sub-pixel variations in the location of a source
near the saturation brightness may affect whether or not it
saturates a pixel.
Approximately 1% of sources fainter than the nominal
saturation boundaries have w?sat>0 because of charged particle
strikes within the fitting area of a source.
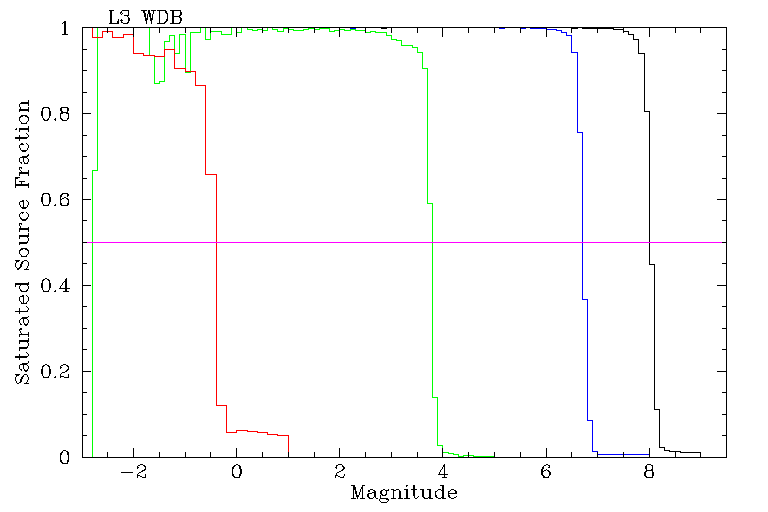
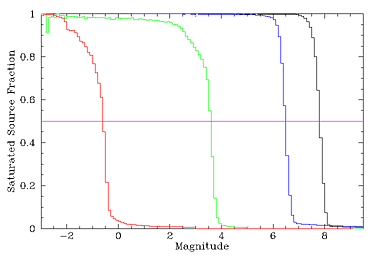
The characteristic saturation level for point sources in each band can
be defined as the point at which 50% of sources have a non-zero fraction
of saturated sources. Figure 5 shows for each band
in the Source Catalog the differential fraction of saturated sources
as a function of profile-fit magnitude
in that band. In Table 1 are listed
the magnitudes at which 50% of the sources have non-zero saturated pixel
fractions for each band, along with the implied flux density assuming
the values for absolute flux calibration given in the notes to the Table.
 |  |
| Figure 1 - W1 Source Catalog differential source counts | Figure 2 - W2 Source Catalog differential source counts |
 |  |
| Figure 3 - W3 Source Catalog differential source counts | Figure 4 - W4 Source Catalog differential source counts |
| Black curves represent total differential source counts
for each band from the Catalog. Green curves represent
source counts for sources that
do not have any saturated pixels in the profile-fitting region. Red
curves represent source counts for sources with one or more saturated
pixels in the profile-fitting region. |
Table 1 - Characteristic WISE Catalog Point Source Saturation Thresholds
| Band | Magnitude | Flux (Jy)a |
|---|
| W1 | 8.04 | 0.19 |
|---|
| W2 | 6.72 | 0.35 |
|---|
| W3 | 3.77 | 0.90 |
|---|
| W4 | -0.44 | 12.4 |
|---|
a Assumes fluxes-for-zero magnitude of:
306.68/170.66/29.045/8.2839 Jy for W1/W2/W3/W4
 |
| Figure 5 - Fraction of Catalog sources with one or more saturated pixels
in the profile-fitting region, plotted as a function of profile-fit
brightness for multiframe processing. W1, W2, W3 and W4 are represented by the
black, blue, green
and red curves, respectively. The horizontal magenta line marks
the 50% saturated source fraction. |
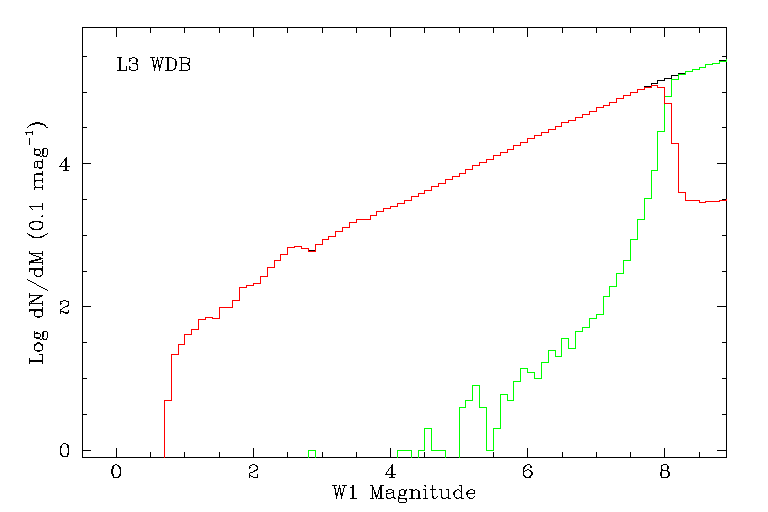
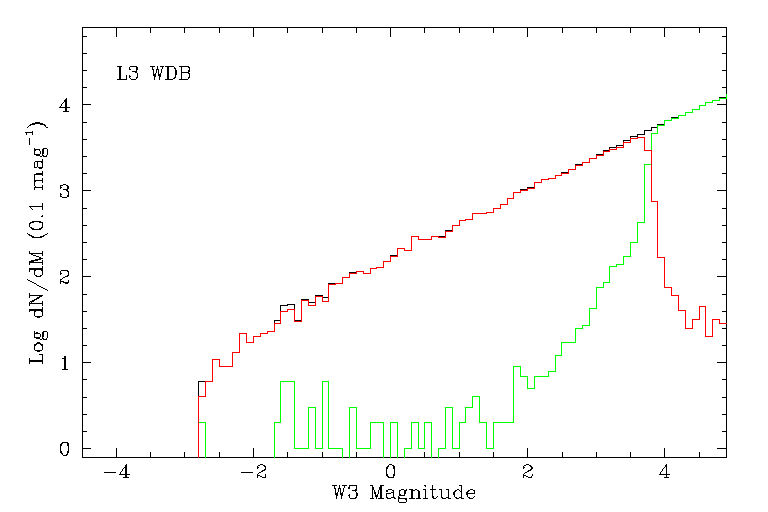
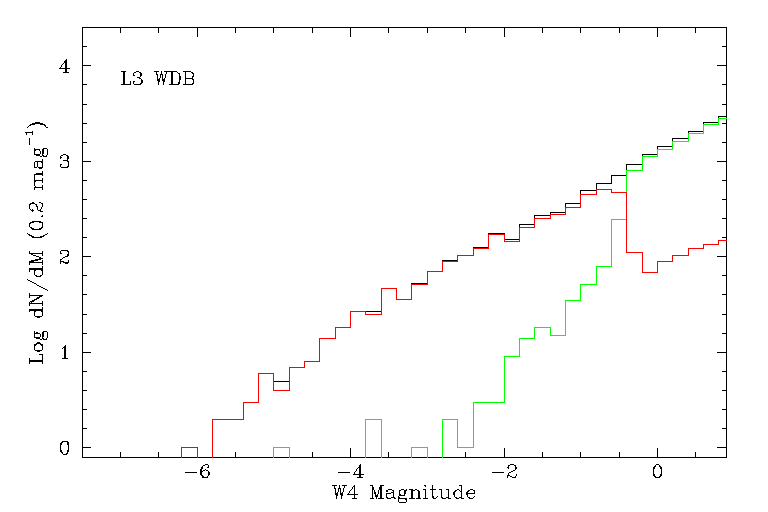
2. Single-Exposure Source Database
Figures 6-9 illustrate the differential source counts
near the expected saturation brightness levels from the Preliminary Release
Single-exposure Source Database. The brightness range for the
transition from non-saturated to saturated is broader in the Single-exposure
source measurements than the Catalog because the source sub-pixel
centers are not "homogenized" when using only one frame in the
measurement.
Figure 10 shows for each band the
differential fraction of saturated sources in the Single-exposure
Source Database as a function of profile-fit magnitude in that band.
In Table 2 are listed the approximate
magnitudes of 50% saturation fraction for each band, along with the
implied flux density assuming the values for absolute flux
calibration given in the notes to the Table. As seen in the distributions
in Figure 6-9, the observed saturation levels span
a range as much as +/- 1 magnitude around these values.
 |  |
| Figure 6 - W1 Single-exposure Source Database differential source counts | Figure 7 - W2 Single-exposure Source Database differential source counts |
 |  |
| Figure 8 - W3 Single-exposure Source Database differential source counts | Figure 9 - W4 Single-exposure Source Database differential source counts |
| Black curves represent total differential source counts
for each band from the Level 1b source Working Database. Green curves
represent source counts for sources that
do not have any saturated pixels in the profile-fitting region. Red
curves represent source counts for sources with one or more saturated
pixels in the profile-fitting region. |
Table 2 - Characteristic WISE Single-Frame Point Source Saturation Thresholds
| Band | Magnitude | Flux (Jy)a |
|---|
| W1 | 7.83 | 0.23 |
|---|
| W2 | 6.48 | 0.44 |
|---|
| W3 | 3.57 | 1.08 |
|---|
| W4 | -0.59 | 14.3 |
|---|
Notes
a Assumes fluxes-for-zero magnitude of:
306.68/170.66/29.045/8.2839 Jy for W1/W2/W3/W4
 |
| Figure 10 - Fraction of sources with one or more saturated pixels
in the profile-fitting region, plotted as a function of profile-fit
brightness from scan-frame processing. W1, W2, W3 and W4 are represented by
the black, blue, green
and red curves, respectively. The horizontal magenta line marks
the 50% saturated source fraction. |
3. Bright Source Photometry Limits
The source count distributions in Figures 1-3
exhibit a cut-off at the bright-end where profile-fitting photometry in
first-pass processing becomes unable to extract a measurement because
too few non-saturated pixels are available in the source
profile wings. These cut-offs occur near 1.0, 0.0 and -2.0 mag
(123, 172 and 200 Jy) in W1, W2 and W3, respectively. There does not appear
to be an obvious bright-end cut-off in the W4 counts, although the curve may
be steepening brighter than approximately -6 mag (2100 Jy).
Estimates of the number of objects on the sky that will fail to have a
magnitude reported in the WISE Source Catalog and Single-exposure
Source Database can be obtained using the IRAS and 2MASS Point Source
Catalogs. There are 256 and 24 sources in the full IRAS PSC that have
F12>200 Jy and F25>2100, Jy, respectively.
There are 791 and 236 sources in the full 2MASS PSC that have
Ks= +1 and 0 mag, respectively,
assuming the bluest objects will have Ks-W1 and Ks-W2
colors of approximately zero mag.
Last update: 2011 April 28
Previous page Next page
Return to Explanatory Supplement TOC