 |
 |
 |
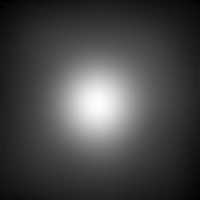 |
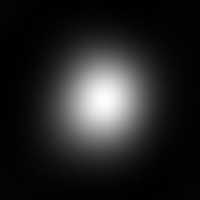
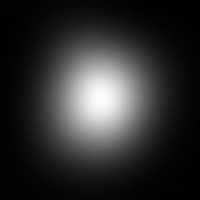
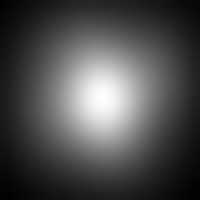
| Figure 1a - W1 for Atlas image 2438m394_aa11 | Figure 1b - W2 for Atlas image 2438m394_aa11 | Figure 1c - W3 for Atlas image 2438m394_aa11 | Figure 1d - W4 for Atlas image 2438m394_aa11 |
Factors qc, qa, and qi were determined per coadd and were the basis for the Coadd Quality (CQ) score. CQ was the minimum of the qc, qa, and qi factors multiplied by ten. CQ was an integer of value 0 (poor quality) or 10 (high quality). However, all Atlas images and sources lists for the Preliminary Data Release were found to have CQ values of 10, so all passed the QA metrics listed below.
qc: This was the factor gauging quality of completion. If the status value from the Multiframe pipeline was equal to 0 (indicating a problem-free completion), then qc=1.0. Otherwise, qc=0.0 because the coadd failed processing.
qa: This was the factor gauging astrometric quality. This factor checked the requirement that the one sigma error in WISE positions with respect to the 2MASS Point Source Catalog positions was < 0.5 arcsec on each axis (i.e., 0.71 arcsec RSS) for sources having SNR > 20 in at least one band. If, in the SNR=20 bin for any band, the standard deviation of the 2MASS-to-WISE radial distance was less than 0.71 arcsec, qa=1.0; otherwise, qa=0.0
qi: This was the factor gauging quality of image shape. This was a check to watch for potential image smearing by using the axial ratio of the PSF. The value of qi was 1.0 if rbovera > 0.60; otherwise it is 0.0.
In the following discussion, the processing of the Atlas image with a coadd_ID of 2438m394_aa11 was used to illustrate the kinds of tabular and graphical material used by the QA scientists to assess the quality of the data.
Image quality: Just as with the scan-level data, image quality was checked in the Multiframe atlas images. The main difference between the Multiframe and Scanframe image quality checks arose from the fact that only those frames with passing image quality scores (qi) were used in Atlas image generation. Thus, individual frames were already known to have good image quality so this tested the quality of position registration for frames going into the Atlas image.
There were two main image quality checks for Multiframe processing. The first was the coadd-averaged PSF, which is analogous to the scan-averaged PSF created for Scanframe processing. As in ScanFrame processing, the visual appearance of the PSF (Figure 1) and a table providing the actual PSF moments (Table 1) were monitored.
|
|
|
|
| Figure 1a - W1 for Atlas image 2438m394_aa11 | Figure 1b - W2 for Atlas image 2438m394_aa11 | Figure 1c - W3 for Atlas image 2438m394_aa11 | Figure 1d - W4 for Atlas image 2438m394_aa11 |
| scan_id | band | r_major | rbovera | rphi | r_05p | r_01p | bovera | phi | noisepix | signspix | sigrmajor | sigphi | sigbovera |
|---|---|---|---|---|---|---|---|---|---|---|---|---|---|
| 2438m394_aa11 | W1 | 4.6686 | 0.9530 | 150.56 | 4.5278 | 8.7762 | 0.9000 | 152.00 | 46.054 | 0.009 | 0.0166 | 0.22 | 0.0049 |
| 2438m394_aa11 | W2 | 4.6596 | 0.9461 | 170.30 | 4.9884 | 10.5795 | 0.7800 | 171.00 | 47.546 | 0.007 | 0.0058 | 0.07 | 0.0017 |
| 2438m394_aa11 | W3 | 4.4510 | 0.9547 | 158.82 | 5.6872 | 0.0000 | 0.0000 | 0.00 | 48.882 | 0.010 | 0.0254 | 0.38 | 0.0079 |
| 2438m394_aa11 | W4 | 8.7710 | 0.9348 | 134.81 | 8.9429 | 0.0000 | 0.0000 | 0.00 | 50.720 | 0.019 | 0.3816 | 1.03 | 0.0596 |
The columns in the table are
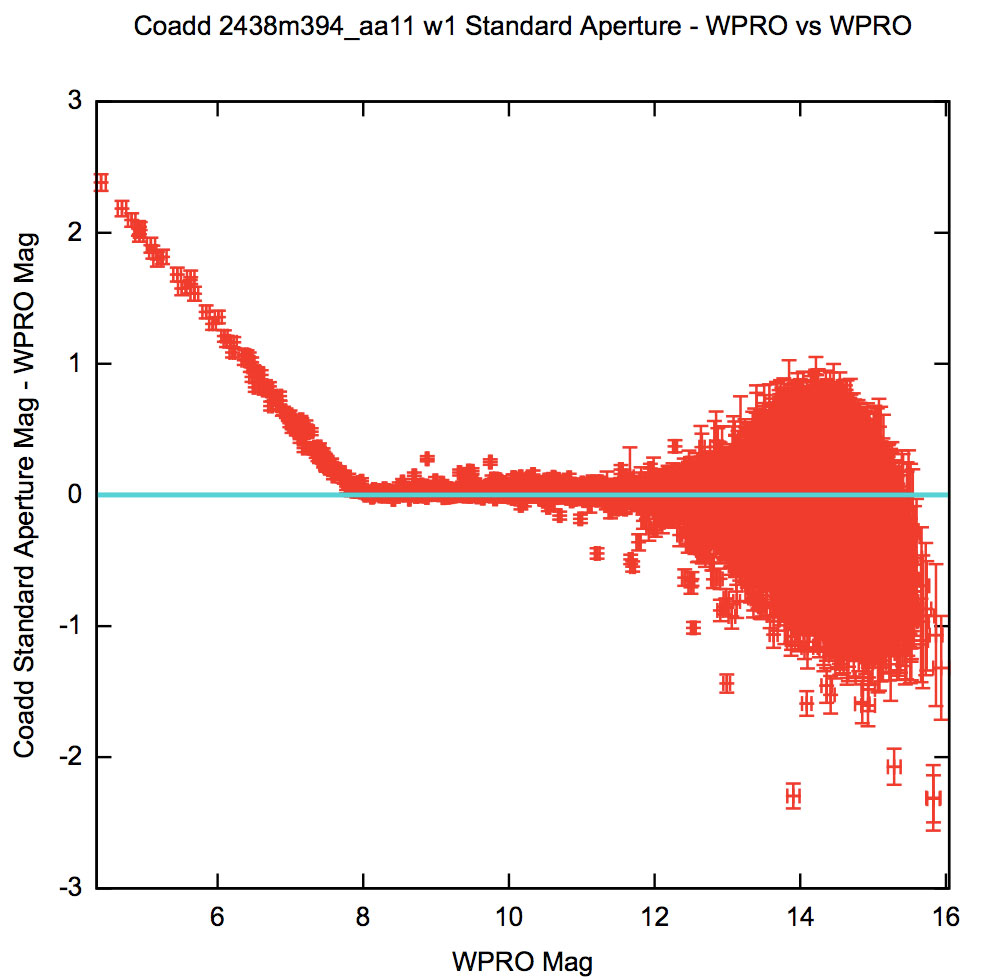
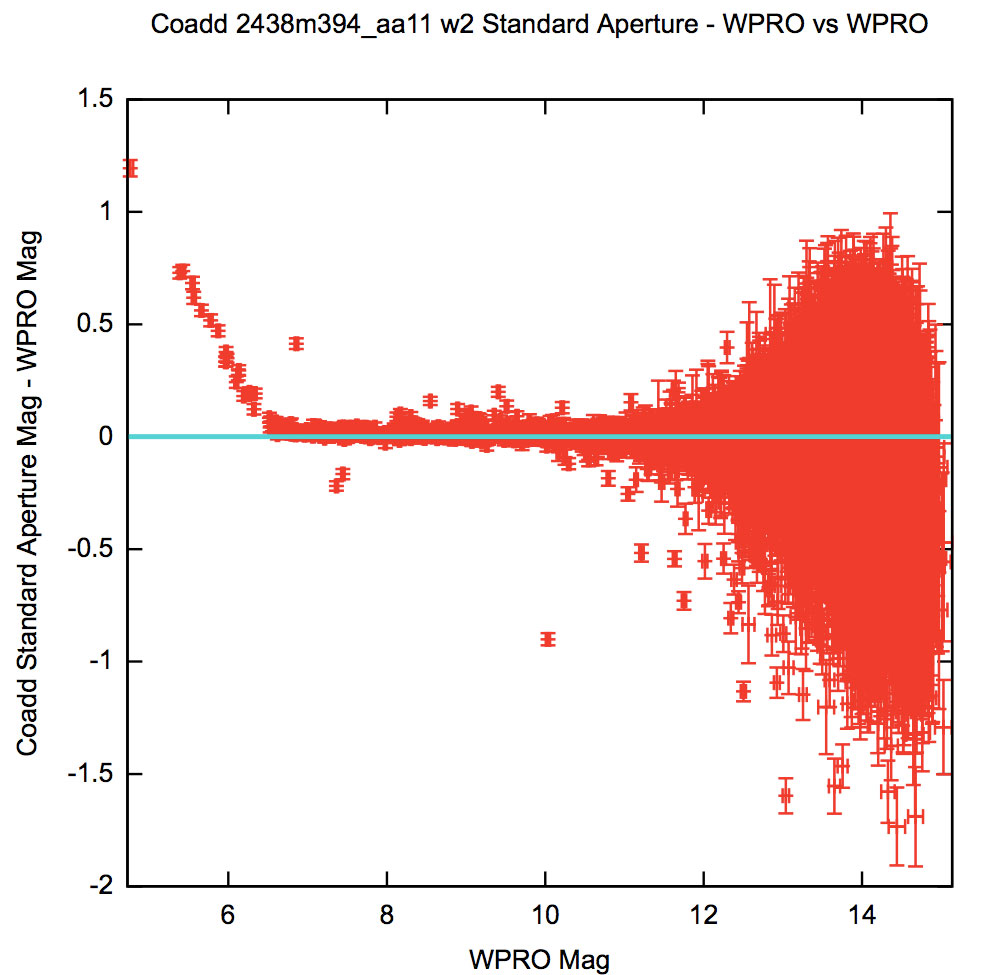
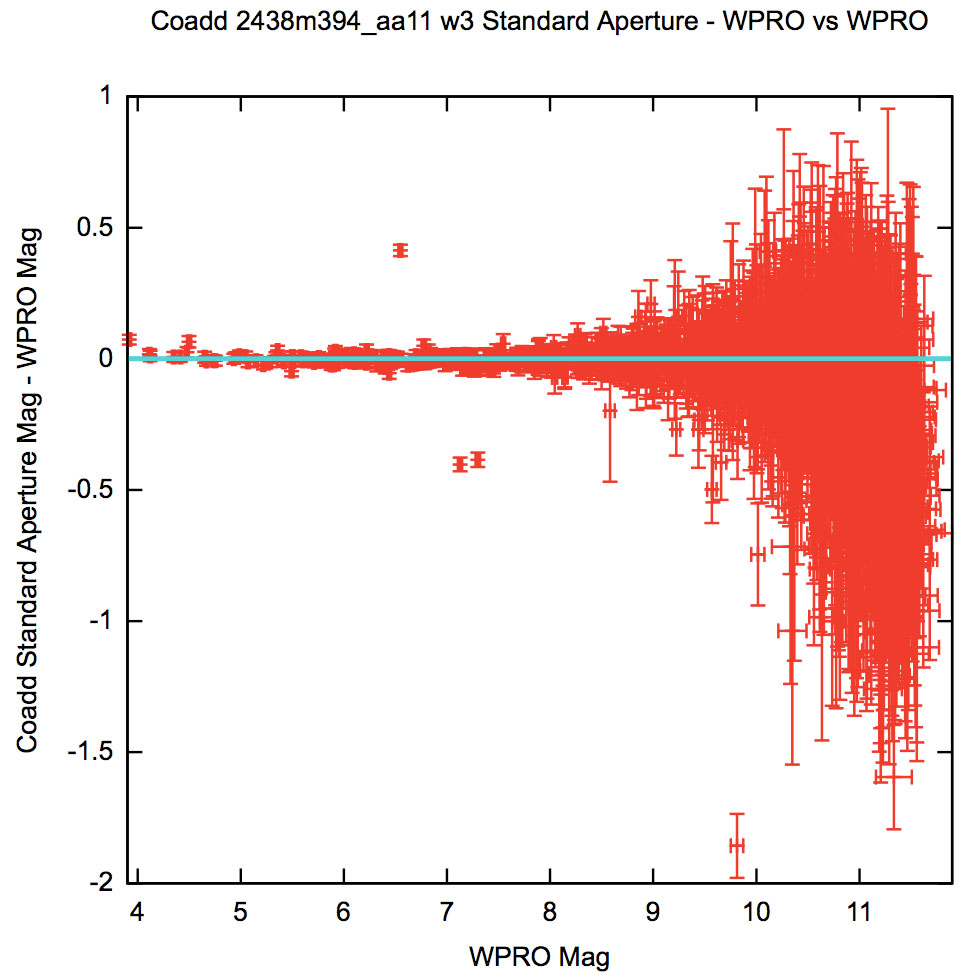
The second method by which we checked the image quality in the Atlas images was to examine the differences between the profile-fit and aperture-derived magnitudes. For objects that are not excessively bright or faint, this difference should be near zero. Deviations from zero indicated likely problems with image quality because the model PSF did not provide a good fit for the observed PSF. Figure 2 shows a typical plot of the difference in the aperture and profile-fit magnitudes as a function of profile-fit magnitude. No problems were seen for this Atlas image.
 |
 |
 |
 |
| Figure 2a - Aperture minus profile-fit magnitude vs. profile-fit mag (W1) | Figure 2b - Aperture minus profile-fit magnitude vs. profile-fit mag (W2) | Figure 2c - Aperture minus profile-fit magnitude vs. profile-fit mag (W3) | Figure 2d - Aperture minus profile-fit magnitude vs. profile-fit mag (W4) |
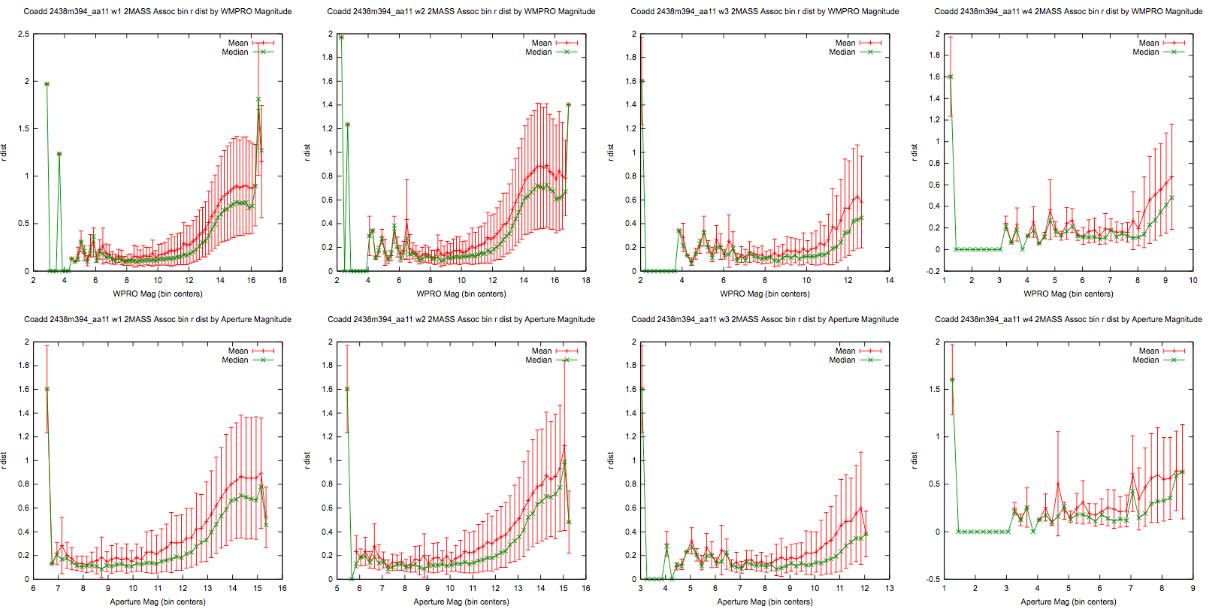
Astrometric calibration: In order to check astrometric quality, the detected WISE sources in the coadd were searched for positional matches to 2MASS stars, using a 3-arcsec matching radius. Then the mean, median, and standard deviation of radial distance and position angle of these were computed. These values are shown in Table 2 below.
| r_dist_mean | r_dist_med | r_dist_stddev | r_posang_mean | r_posang_med | r_posang_stddev |
|---|---|---|---|---|---|
The columns in the table are:
Next, the radial distances were binned by the per-band signal-to-noise ratio (SNR) of the profile-fit photometry (WPRO). The SNR bins were set at 3, 5, 20, and 100. These bins were cumulative, meaning that each bin contains all stars with SNR greater than the given SNR floor. For each bin, the mean, median, and standard deviation of radial distances were computed, as shown in Table 3 below.
| name | W1 | W2 | W3 | W4 |
|---|---|---|---|---|
| SNR3_mean_r_dist | 0.64 | 0.63 | 0.36 | 0.39 |
| SNR3_med_r_dist | 0.45 | 0.44 | 0.18 | 0.17 |
| SNR3_stddev_r_dist | 0.45 | 0.45 | 0.30 | 0.35 |
| SNR5_mean_r_dist | 0.63 | 0.60 | 0.24 | 0.21 |
| SNR5_med_r_dist | 0.44 | 0.41 | 0.14 | 0.13 |
| SNR5_stddev_r_dist | 0.45 | 0.44 | 0.20 | 0.16 |
| SNR20_mean_r_dist | 0.43 | 0.36 | 0.16 | 0.24 |
| SNR20_med_r_dist | 0.26 | 0.22 | 0.12 | 0.15 |
| SNR20_stddev_r_dist | 0.32 | 0.27 | 0.10 | 0.16 |
| SNR100_mean_r_dist | 0.42 | 0.52 | NaN | NaN |
| SNR100_med_r_dist | 0.25 | 0.29 | 0 | 0 |
| SNR100_stddev_r_dist | 0.35 | 0.47 | NaN | NaN |
The entries in the table are:
The quality of astrometry of the Atlas image was judged by whether the standard deviation of the radial distance of matches in the cumulative SNR = 20 bin fell below the threshold of 0.71 arcsec. This threshold is equivalent to a threshold per x- and y-axis of 0.5 arcsec in the RMS error of position relative to 2MASS sources.
The plots of coadd astrometric quality shown in Figure 3 were produced by first binning the radial distances of matches separately by profile-fit and aperture photometry magnitude. The bins were each of size 0.2 mag. For each bin, the mean, median, and standard deviation of radial distances were computed. Then plots of bin mean (red) and median (green) radial distance vs. bin magnitude were made, with error bars centered on the mean, of +/- 1 σ. There is one set of plots for bins by profile-fit magnitude, and one set for bins by aperture magnitude.
 |
| Figure 3 - The mean radial offset between WISE computed astrometry and the 2MASS positions of sources detected by 2MASS. Radial offsets are computed for each magnitude bin, as described in the text. |
Visual checks: As a final check of data integrity, QA scientists visually inspected the images in all bands. The QA interface presented jpeg thumbnails of each frame along with the coverage maps in all bands (Figure 4). The visual inspection was done in an effort to reveal any problems not captured by the QA metrics.
 |
| Figure 4 - From left to right in the first and third rows are shown the full Atlas images for W1, W2, W3, and W4. The two rows show two different display stretches. Rows two and four show three-color images at these same stretches. The first of the two images is comprised of W1(blue)+W2(green)+W3(red) and the second is comprised of W2(blue)+W3(green)+W4(red). The fifth row shows coverage maps for W1, W2, W3, and W4. The greyscale stretch in the coverage maps goes from black for a coverage of four or fewer frames up to white for the maximum coverage in the image, which can vary depending on factors such as ecliptic latitude and quality score. |
Last update: 2011 March 28