 |
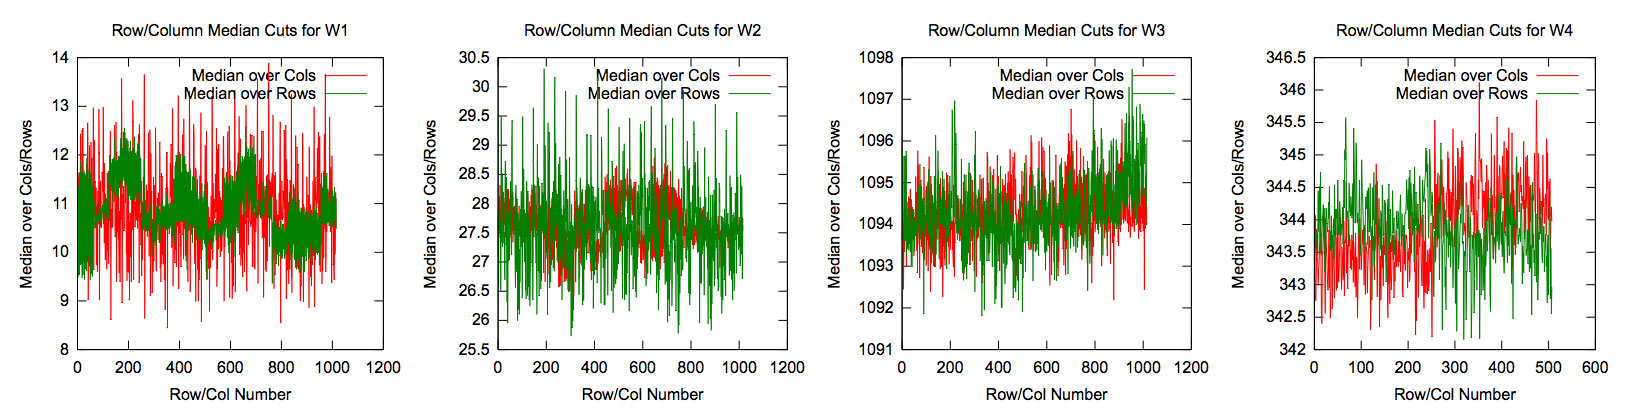
| Figure 1 - Median signal in each row (green) and column (red) as a function of row or column number for, from left to right, W1, W2, W3, and W4, respectively. |
qc: This was the quality of completion. If the status value from the ScanFrame pipeline was equal to 0 (indicating a problem-free completion), then qc=1.0. Otherwise, qc=0.0 because the frame failed processing.
qi: This was the quality of image size and shape. This factor was the smaller of two subfactors qi_syn and qi_rat. The subfactor qi_syn was a check to look for possible image smearing using the NoisePix metric. The NoisePix value was checked for the shortest wavelength band (W1), and qi_syn was computed as follows:
qn: This was the quality of the frame as judged by its background and noise characteristics. This factor was the smallest of five subfactors qn_bkg, qn_sgm, qn_bdp, qn_rfp, and qn_moc. These were computed as follows:
In the following discussion, frame 019 of scan 01432a is used to illustrate the kinds of tabular and graphical material used by the QA scientists to assess quality at the frame level.
Arrays sometimes exhibit channels or quadrants offset in background or noise characteristics from their neighbors. Depending upon the size of the discrepancy these offsets can have detrimental effects on data quality. Figure 1 shows how any isolated amplifier channel with signal differing markedly from the rest can be detected. In W1, an anomalous channel would manifest as a set of columns with anomalous signal; in W2 it would as a set of rows; in W3 and W4 it would as a pronounced asymmetry between the lower and upper rows, and the left and right columns.
|
| Figure 1 - Median signal in each row (green) and column (red) as a function of row or column number for, from left to right, W1, W2, W3, and W4, respectively. |
Other checks, such as those in Figures 2 and 3, monitored the overall distribution of pixel values to look for discrepancies. The histogram of pixel values in Figure 2 could reveal anomalously high or low values that would skew the otherwise approximately symmetrical distributions. The passage of a bright satellite, the effects of moonlight, or the presence of a very bright astrophysical source were examples that would skew pixels to the bright end of these histograms.
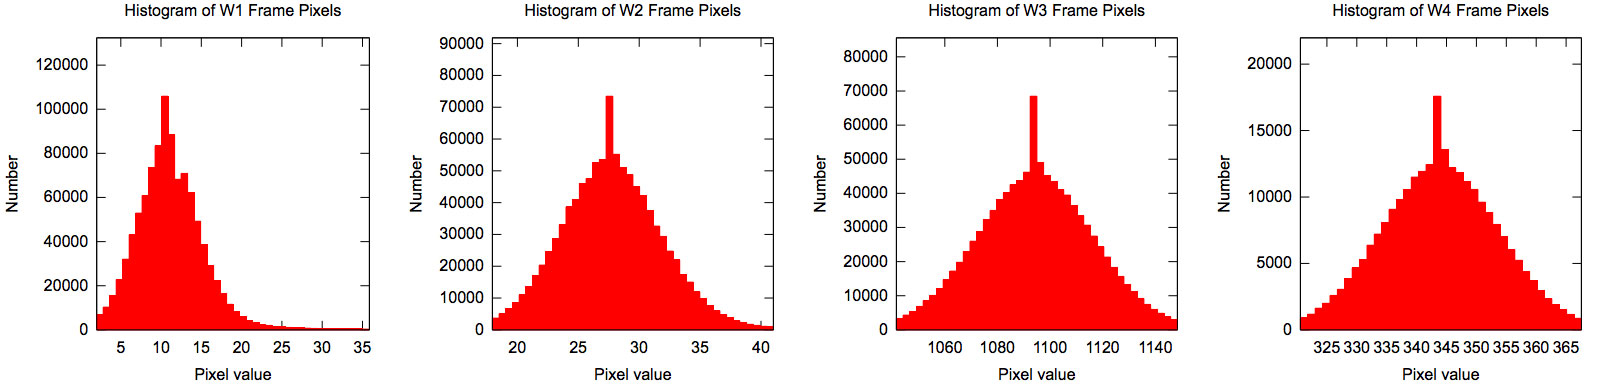 |
| Figure 2 - The histogram of pixel values in the frame, in DN units, for each band. |
The histogram in Figure 3 was useful in diagnosing droop or other "spill over" of signal from the active pixels into the reference pixels, which were (generally) non-illuminated pixels that could serve as a stable check of array behavior.
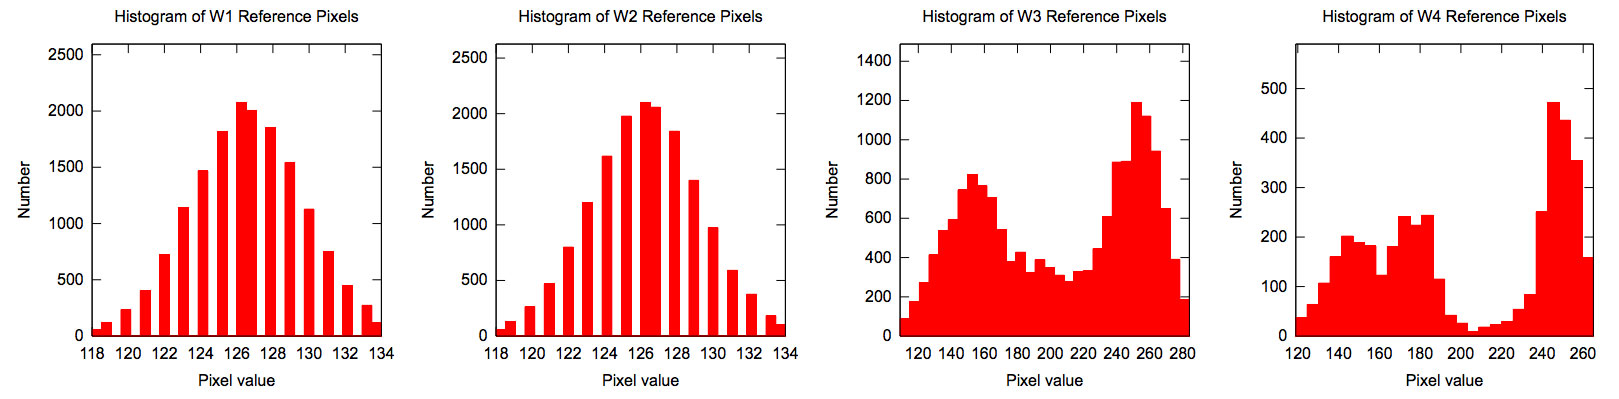 |
| Figure 3 - The histogram of reference pixel values for each band. |
The plots of Figure 4 were used to search for possible smearing or streaking of point sources. If streaking or smearing was prevalent in the frame, the average difference in aperture versus profile-fit magnitudes for well detected (but unsaturated) sources would differ significantly from zero due to the mismatch between the PSF shape used for the profile fit and the true PSF shape for the streaked sources. In such cases, the aperture magnitude measurement is far less affected.
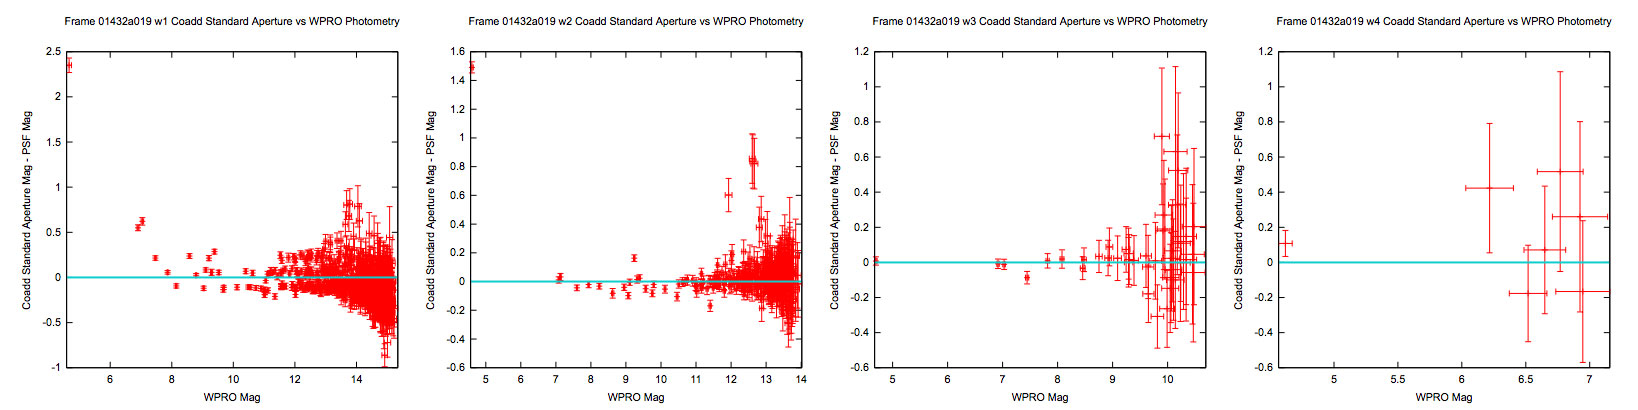 |
| Figure 4 - Plots of the difference between profile-fitting (WPRO) and standard-aperture photometry as a function of profile-fit magnitude for all stars with valid photometry. |
Figures 5 and 6 show how qn_bkg and qn_moc were able to detect scattered moonlight. In these cases, framesets from another scan are chosen because the example scan, 01432a, does not contain any scattered moonlight.
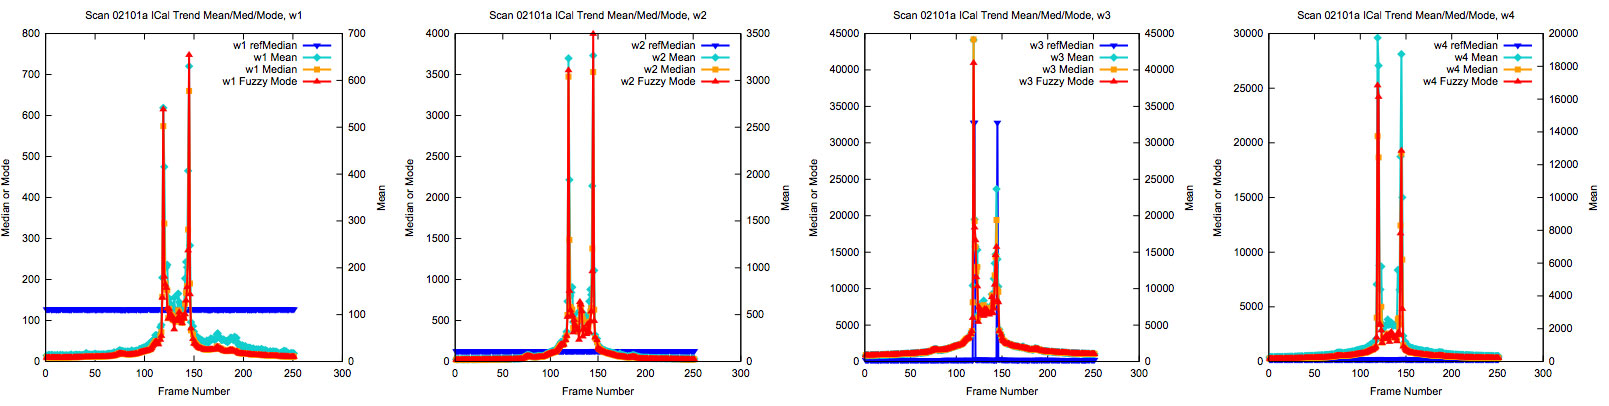 |
| Figure 5 - In scan 02101a, framesets 117-146 were affected by Moon glow or artifacts. The median signal in the frames exceeded the threshold of 300 in W2, thus failing the qn_bkg criterion. The two spikes around framesets 120 and 140 correspond to Moon diffraction spikes falling across the arrays; for framesets between these spikes qn_bkg fails for all bands. |
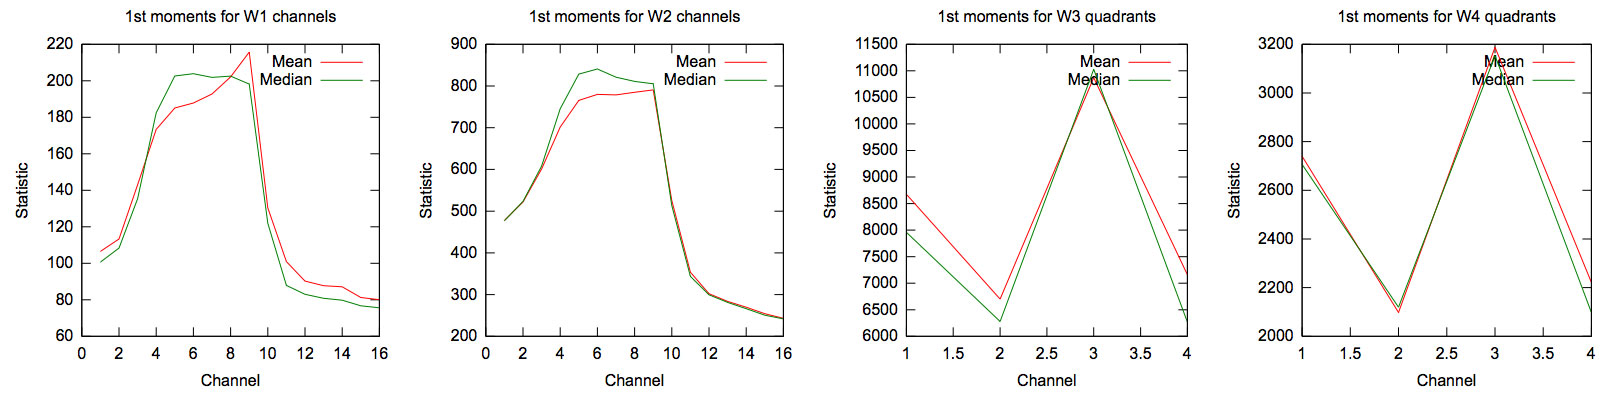 |
| Figure 6 - The mean and median signals per amplifier channel for frameset 130 of scan 02101a, which is contaminated by Moon glow. The W2, W3 values exceed the thresholds of 400 and 8000, respectively, for at least one channel, causing the qn_moc factor to fail. |
Figure 7 shows for scan 01997b how the qn_bkg factor can detect effects from an anneal in W3 and W4:
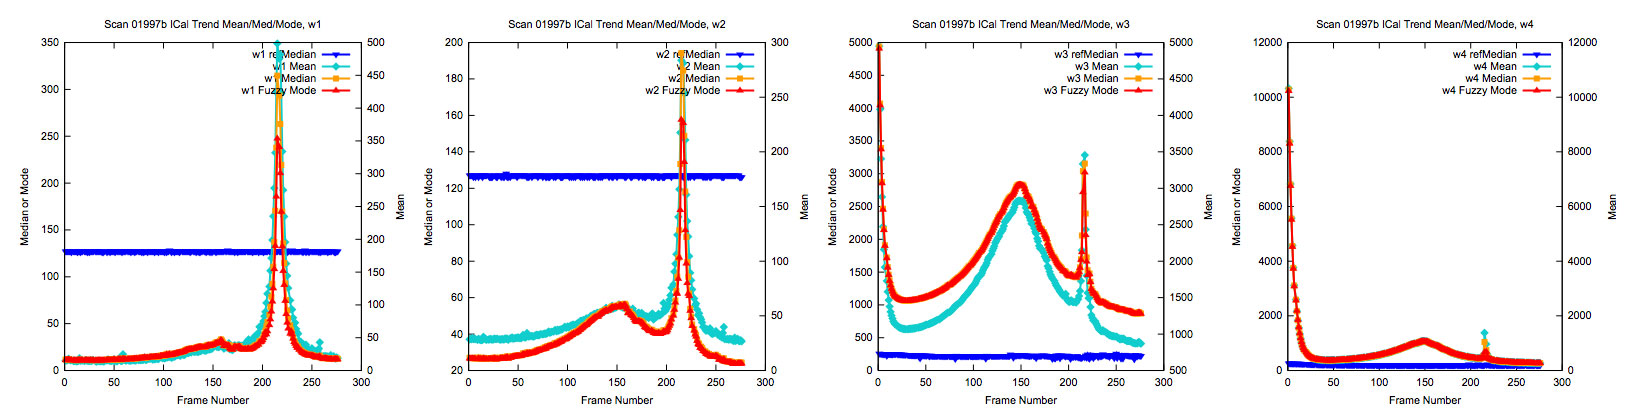 |
| Figure 7 - Median or mode of the pixel values in each frame as a function of frameset number for scan 01997b. Framesets 001-010 were measured within 11 minutes of an anneal and the median signal in W4 for these exceeds the threshold of 8000, causing the qn_bkg factor to fail. The decaying mean or median signal in W3, W4 as a function of frame number is characteristic of an anneal recovery. |
Last update: 2011 March 28