 |
 |
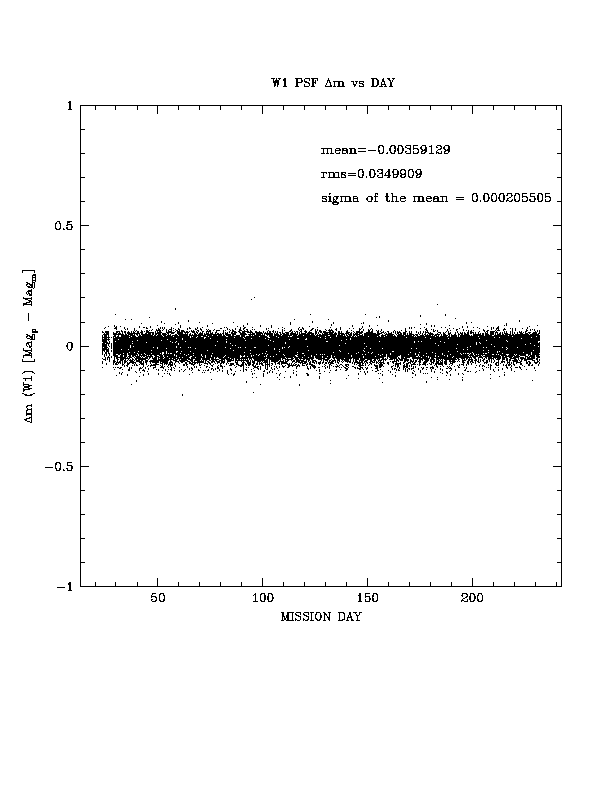
| Figure 1a - [Mp - Mm] for W1 Primary Calibrators |
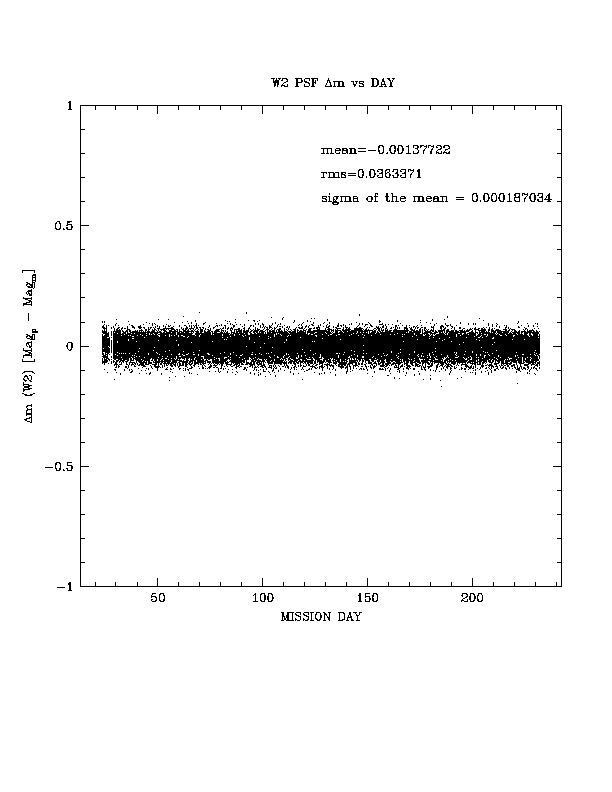
Figure 1b - [Mp - Mm] for W2 Primary Calibrators |
In this section, we describe the process by which instrumental source magnitudes were converted to calibrated magnitudes, and how the photometric zero point levels were derived for WISE. A brief introduction to the WISE photometric is given below, much of the information is documented in Wright et al. (2010 AJ, 140, 1868) and Jarrett et al. (2011 ApJ, 735, 112).
All reported magnitudes are in the Vega System. Conversions to the AB System are given IV.3.g.v .
Accordingly, the WISE team, in collaboration with the Spitzer Science Center, carried out a survey of the ecliptic continuous viewing zones (CVZs) using the full complement of Spitzer instrumentation: IRAC and MIPS broad-band mapping of a 47x47 arcmin (0.6 deg2) region for each CVZ, and IRS spectroscopy of either previously identified calibrator stars or newly developed standard calibrators. The imaging and spectroscopic observations include the galaxy NGC 6552, used to cross-calibrate the long-wavelength band of WISE with the Spitzer IRS-LL and MIPS 24 micron channel.
The polar surveys are used to (i) provide consistent calibrators in both of the WISE CVZs, (ii) develop new calibrators in the EP-S, (iii) establish the photospheric character of all candidate calibrators, (iv) assess the long-term stability for secondary standards, (v) identify objects that will saturate the WISE arrays, (vi) identify galaxies that are resolved by IRAC, and measure their properties using methods appropriate to extended sources, and (vii) study the extragalactic population. The observations, results and analysis are presented in Jarrett et al. (2011).
Due to the scarcity of W4 calibrators at the CVZ a set of off-EP W4 calibrators are selected to supplement the set of W4 WISE calibrators. The complete set of WISE photometric calibrators are listed in Tables 1a-1d.
Selected calibrators Table 1a and 1b and Tables 1c and 1d were used to monitor the photometric stability of WISE throughout the mission by examining the time history of the predicted magnitude, Magp, of each calibrator to its measured magnitude, Magm. The north (EP-N) and south (EP-S) ecliptic poles were ideal areas from which to select photometric calibrators. The ecliptic poles were continuous viewing zones for WISE due to its polar-crossing orbit. Due to the scarcity of W4 calibrators at the ecliptic poles, several off-pole W4 calibrators were selected to supplement the set.
Photometric calibrators, detected at the beginning and/or end of most scans, provided photometric markers to anchor the zero point calibration. A zero point offset is computed for each scan by taking the average [Mpi - Mmi] of all i detected calibrators in the scan.
Although the zero point offsets are computed they are not applied to the measured magnitudes due to the inherent photometric stability of WISE detectors as shown in Figures 1 and 2 and discussed in IV.3.g.vii, Calibration Uncertainties. The time history provided information for the Instrumental Zero Point discussed in IV.3.g.iv,Calibrated Magnitudes.
 |
 |
| Figure 1a - [Mp - Mm] for W1 Primary Calibrators |
Figure 1b - [Mp - Mm] for W2 Primary Calibrators |
 |
 |
| Figure 1c - [Mp - Mm] for W3 Primary Calibrators |
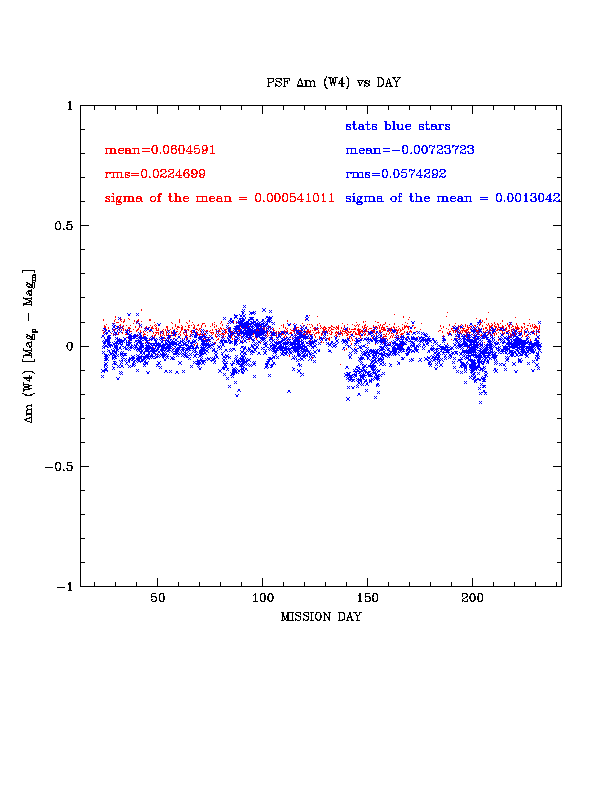
Figure 1d - [Mp - Mm] for W4 Primary Calibrators |
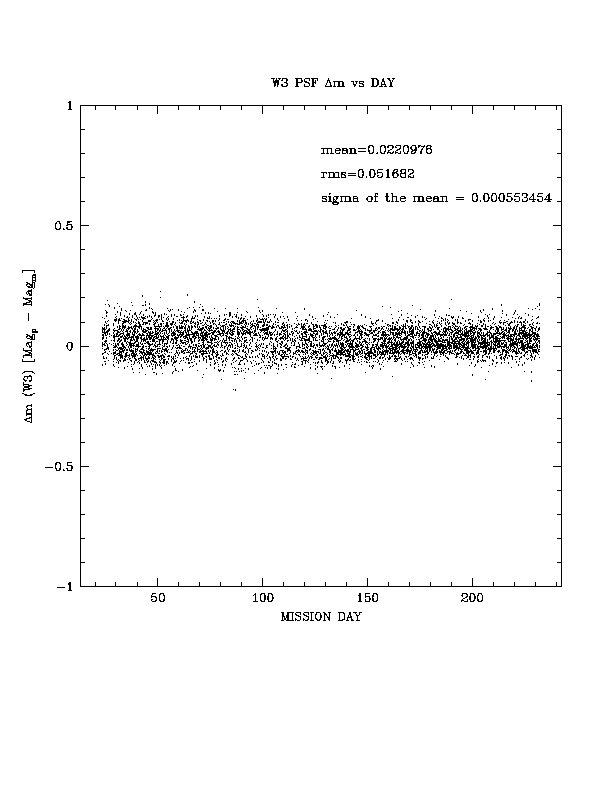
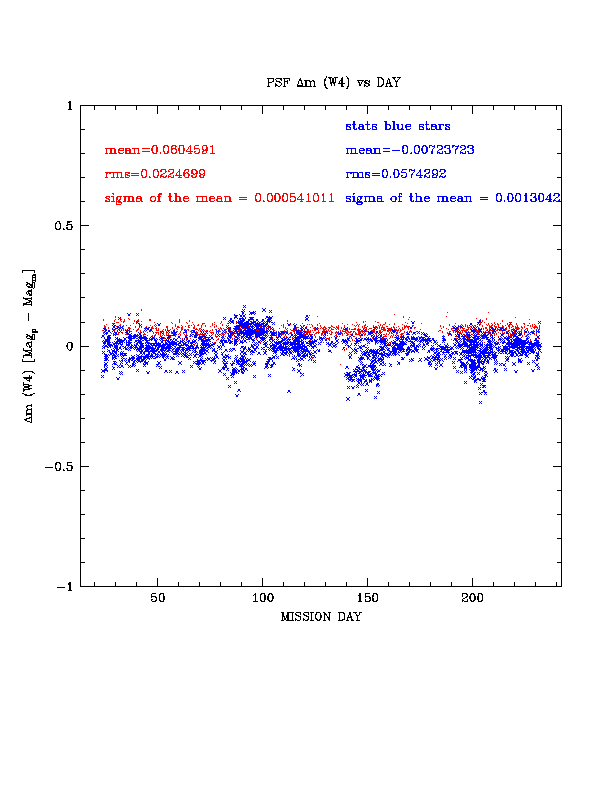
Figure 1a-c, shows the Magp - Magm for W1,W2 and W3 calibrators, respectively, over the entire WISE cryo mission. The W4 primary calibrators are shown in Figure 1d. Color is used to separate the blue stars from red galaxy, NGC6552. The descripancy between the blue and red source measurements is discussed in IV.3.g.vii. WISE photometric calibration is based on measurements from the "blue" calibrators. The apparent dicontinuity of the W4 time history is due to the location of the calibrators being outside the continuous coverage zone limiting the detection of each calibrator.
 |
 |
 |
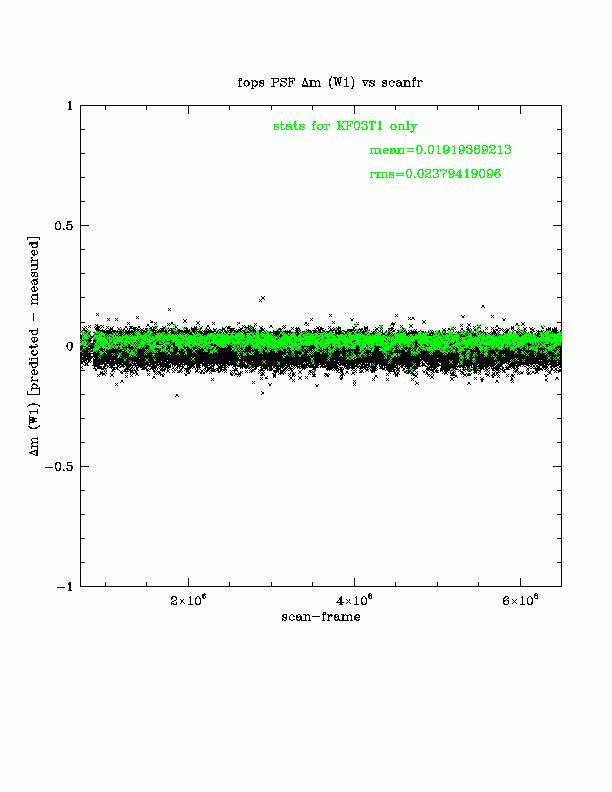
| Figure 2a - W1 Primary Calibrator: KF03T1 Magcal=9.88 PSF Dmag [Predicted - Measured] vs. UTC Detail |
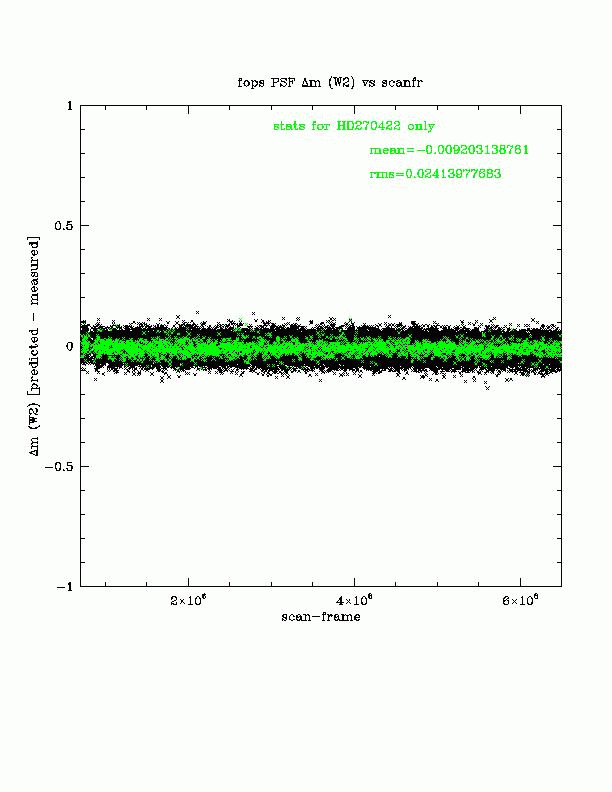
Figure 2b - W2 Primary Calibrators: HD270422 Magcal=7.38 PSF Dmag [Predicted - Measured] vs. UTC Detail |
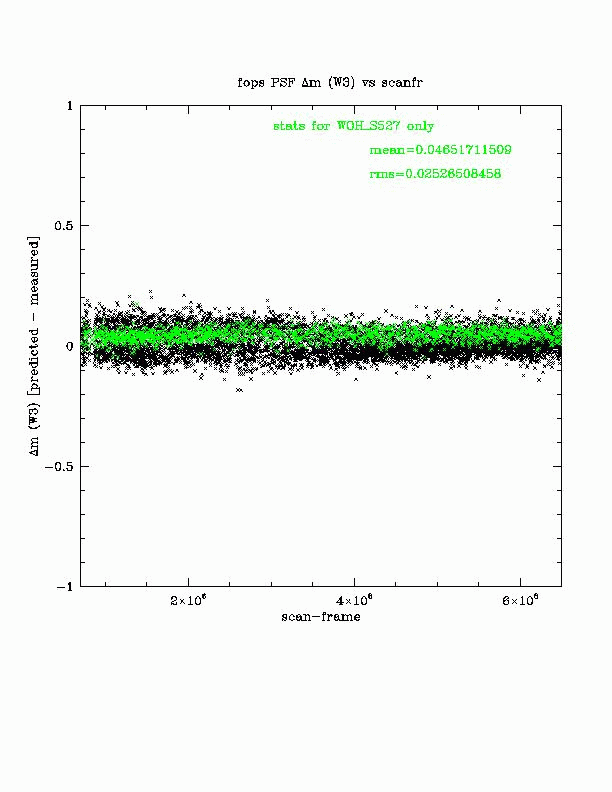
Figure 2c - W3 Primary Calibrator: WOH_S527 Magcal=7.50 PSF Dmag [Predicted - Measured] vs. UTC Detail |
Figure 2 demonstrate the stability of individual calibrator with respect to all other same-band calibrators. The individual standard is highlighted in green against the other calibrators in black.
Due to the inherent photometric stability of the WISE detectors, IV.3.g.vi, only the instrumental zero point is used to compute WISE calibrated magnitudes. Conversion from image measurements to calibrated magnitudes follows from the relation:
Mcal = M0,inst - 2.5*log10(counts)
where
Instrumental magnitudes were measured from the individual frames or Atlas Images using profile-fitting photometry and circular aperture photometry, described in the WPHot section IV.3.c.
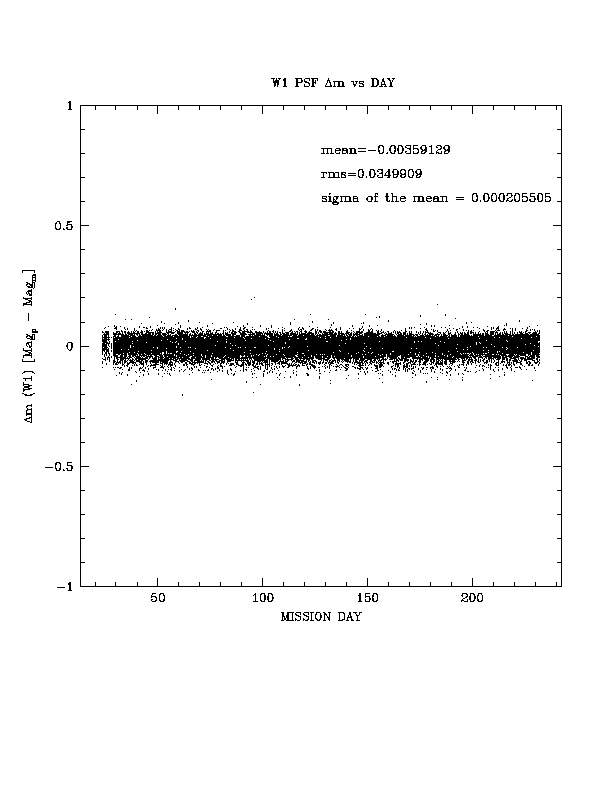
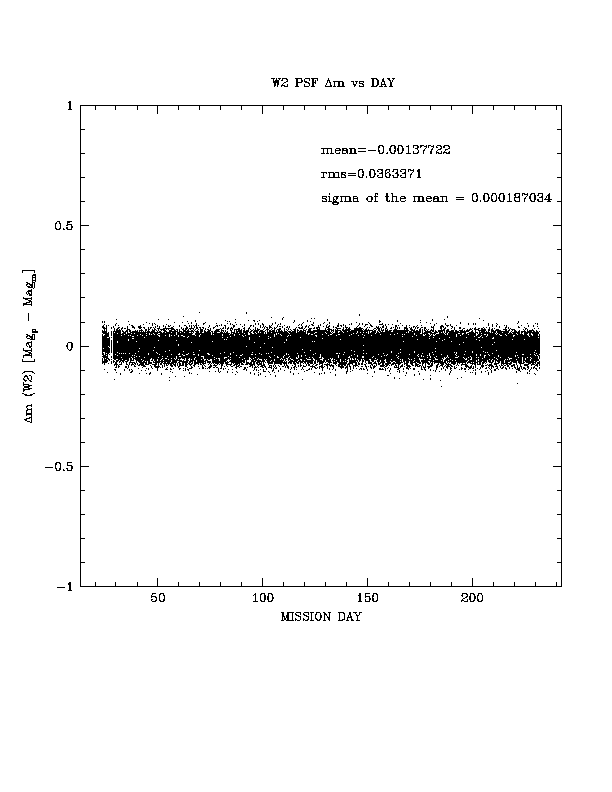
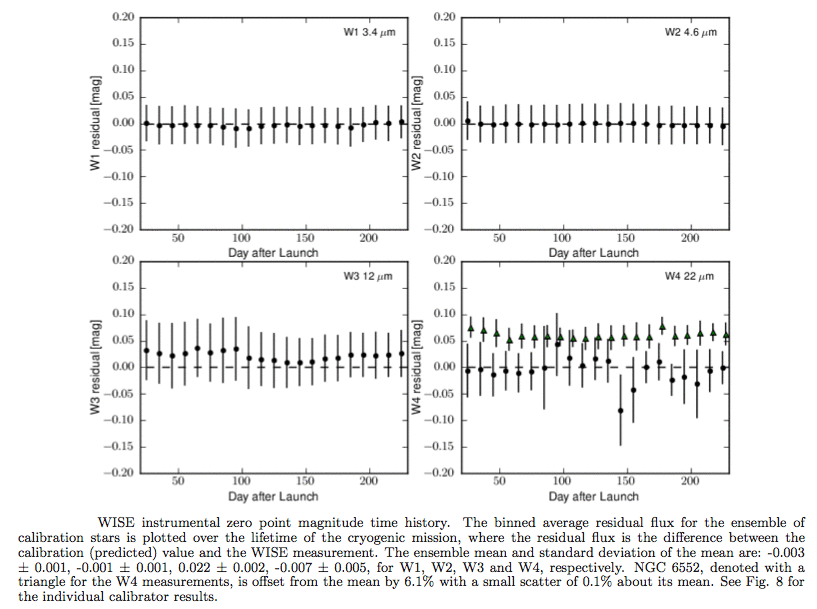
Table 2 illustrates the stability and accuracy of the WISE photometric zero point based on the time history of predicted minus measured magnitudes for calibrators (see Fig. 3). The average value of [Magp - Magm] for W1, W2, W3 and W4 over the mission is -0.004, -0.001, 0.022, -0.007, respectively.
| Band | wavelength (µ) | magnitude |
|---|---|---|
| W1 | 3.4 | 20.730 |
| W2 | 4.6 | 19.567 |
| W3 | 12 | 17.600 |
| W4 | 22 | 12.980 |
 |
 |
| Figure 3a - [Mp - Mm] for W1 Primary Calibrators |
Figure 3b - [Mp - Mm] for W2 Primary Calibrators |
 |
|
| Figure 3c - [Mp - Mm] for W3 Primary Calibrators |
Figure 3d - [Mp - Mm] for W4 Primary Calibrators |
The WISE relative system response curves (RSRs) were created from the end-to-end lab measurements by modifying the prediction and design values at each wavelength by fitting a line in log-log space and using this to replace any originally negative values. Following the prescription of Bessell (2000), we convert the QE-based Wright et al. (2010) RSRs (Fig. 4) from electrons per photon to photon-counting response curves by multiplying by lambda and renormalizing each to a peak of unity; see Fig. 4b. Both W1 and W2 passbands have close correspondence with those of IRAC-1 and IRAC-2, although the W1 passband is slightly `blue' compared to IRAC-1 and W2 is slightly `red' compared to IRAC-2. The reddest channel of WISE, W4 at 22 µm, compares well with MIPS-24, although it is slightly bluer in response. Compared to Spitzer imaging, the only unique band of WISE is that of W3 (12 µm) which has only small overlap with that of IRAC-4 (8 µm), but is comparable to the IRAS 12 µm channel. One consequence of this band-to-band difference is demonstrated in Fig. 4c, the spectrum of ultra-luminous infrared galaxy Arp 220 has strong polycyclic aromatic hydrocarbon (PAH) emission bands, notably at 11.3 µm compared to the bands at 6.2 and 7.7 µm. WISE W3 compared to IRAC-4 will be more sensitive to both PAH emission and amorphous silicate absorption (10 µm) in nearby star-forming galaxies. Moreover, because W3 is a longer wavelength channel than IRAC-4, it is more sensitive to higher redshift galaxies in which strong near-IR continuum and mid-IR emission features redshift into the band.
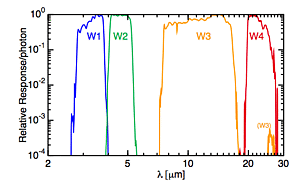 Figure 4a - The QE-based (response per photon) relative system response (RSR) curves normalized to a peak value of unity, on a logarithmic scale. The QE-based RSRs in ASCII table format are available for W1, W2, W3, and W4, which includes wavelength in microns, the response, and the uncertainty in the response in parts per thousand (from Wright et al. 2010). |
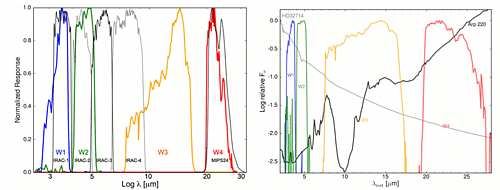 Figure 4b - WISE photon-counting relative system response (RSR) curves, λR(λ), normalized to unity. (Left) The WISE RSRs of W1 (3.4µm; blue), W2 (4.6µm; green), W3 (12µm; orange), and W4 (22µm; red) are compared to the Spitzer IRAC-1 (3.6µm), IRAC-2 (4.5µm), IRAC-3 (5.8µm), IRAC-4 (8.0µm), andMIPS-24 (24µm) array-averaged response curves (all shown with black and gray lines). (Right) Contrasting spectra, the starburst galaxy Arp 220 (Armus et al. 2007 ApJ, 656, 148) and the K2III calibration star HD32174 spectra are shown in relation to the WISE RSRs. The photon-counting RSRs in ASCII table format are available for W1, W2, W3, and W4, which include wavelength in microns, the response, and the uncertainty in the response in parts per thousand (from Jarrett et al. 2011). |
 |
|---|
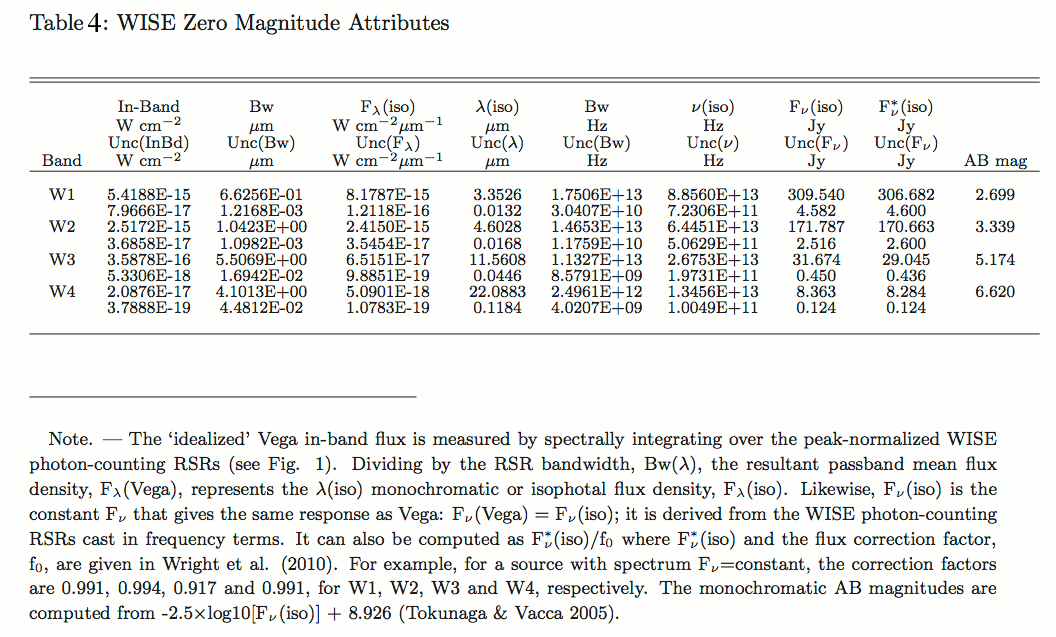
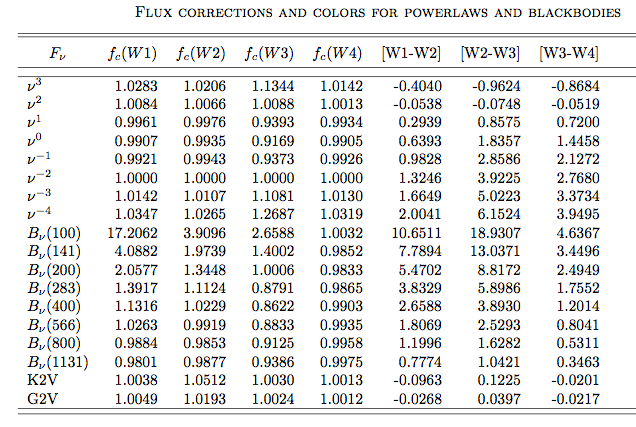
Adopting a stellar photospheric spectrum, specifically that for an "ideal" Vega in which the effective temperature is uniform across the stellar surface (described in Cohen et al. 1992), the system wavelengths are found to be 3.35, 4.60, 11.56, and 22.08 µm (see also Wright et al. 2010). The isophotal flux Flambda(iso) was derived by integrating the modified Vega spectrum across the WISE RSRs. For the frequency equivalent integral, Fν(iso), we applied the method described in Cohen et al. (1999) and Tokunaga & Vacca (2005), recasting each WISE RSR in frequency terms and integrating the stellar spectrum over the RSR to derive the in-band flux. The resultant isophotal quantities and other WISE system attributes are given in Table 4 for both wavelength-based and frequency-based RSRs. Note that Wright et al. (2010) use a different treatment to calculate the Fν(iso) values that is based on the direct conversion of lambda(iso) to Fν using the formulation Fν(iso) equals (lambda2(iso)/c)Flambda(iso); this method is strictly an approximation used for narrow-band filters and is typically unsuitable for wide passbands (Cohen et al. 1999, their Sec. 3.3; and the standard method is restated by Tokunaga & Vacca 2005). The approximation is in fact adequate for W1, W2 and W4. Wright et al. (2010) provide a set of color corrections that properly transform from Fν*(iso) to `in-band' Fν(iso), notably important for W3.
Absolute measurements of stars and comparisons of stellar irradiances with those of emissive reference spheres were made by MSX. This `ideal' Vega spectrum was absolutely validated by photometry on the MSX and provided the basis for defining the zero magnitude for Infrared Space Observatory (ISO), MSX, Spitzer, and AKARI infrared space telescopes. This validated zero magnitude system is traceable to measurements using K (primary) and M giant (secondary) calibrators and has an absolute precision of ±1.10%. This basis now serves the same purpose for the four WISE bands, ensuring that their photometric calibrations have been computed in the same manner as for these previous missions.
The in-band fluxes of the Vega spectrum were adopted to define zero magnitude for WISE bands W1, W2, and W3. Data for W4 incorporate the 2.7% upward offset from the Vega basis model that was established absolutely by MSX at 21.3 µm (Price et al. 2004: Table 4, Column 7, and Table 9, Column 2), and applied by Cohen (2009) in the validation of the diffuse calibration of Spitzer MIPS-24 by comparison with the MSX 21.3 µm band. This Vega basis has an overall systematic uncertainty of ~1.45%.
| Band | magnitude offset (Δm) |
|---|---|
| W1 | 2.683 |
| W2 | 3.319 |
| W3 | 5.242 |
| W4 | 6.604 |
 |
|---|
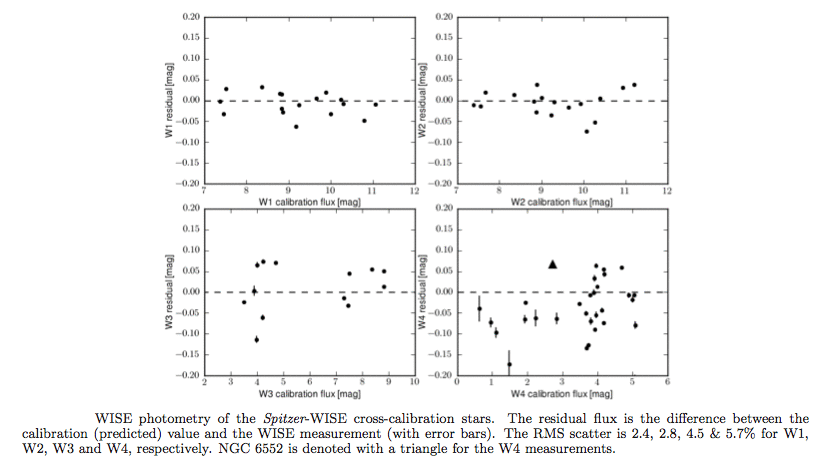
Figure 5 shows the residual flux history for the ensemble of calibration stars, gauging the difference between the predicted flux and the WISE measurement (instrumental flux). The calibration flux is the predicted WISE value as derived from the Spitzer photometric measurements and the spectral in-band flux of each star measured within the WISE RSRs. For each calibrator source, the time history is collapsed to a mean and standard deviation, shown in Fig. 6.
 |
 |
(from Jarrett et al. 2011). |
(from Jarrett et al. 2011). |
Time variability is ruled out with individual measurements over the lifetime of the mission, repeated observations of the individual calibrators reveal an RMS scatter, typically better than 1%. Conversely, the ensemble plotted in Fig. 6 has a much larger scatter than the trending in the zero point: for both W1 and W2, the inverse variance-weighted mean is 0.007 +- 0.025 mag, for W3 it is 0.017 +- 0.045 mag, and for W4, the inverse variance-weighted mean is -0.021 +- 0.057 mag. The ensemble results suggest that the WISE absolute calibration, tied to that of Spitzer, has RMS scatter in the standard calibration stars at the 2.4, 2.8, 4.5 & 5.7% levels for W1, W2, W3 and W4, respectively.
The observed scatter arises chiefly from the uncertainty in the predicted WISE flux values, reflecting the inherent errors associated with model fitting to the broad-band SED measurements, as well as the uncertainty in the WISE RSRs. These errors are inflated at the longer mid-IR wavelengths, notably in the W4 window -- the red calibrator NGC 6552 has a W4 residual of ~6%, a difference that appears to be systematic for very red sources as measured using Spitzer-IRS spectra from ultra-luminous infrared galaxies (see Wright et al. 2010).