


The AllWISE Multiepoch Photometry (MEP) Database is a compendium of 42,759,337,365 time-tagged, profile-fit photometric measurements of each deep source detections in the Source Catalog and Reject Table made on the Single-exposure images.
WISE obtained multiple, independent observations on each point on the sky to build up sensitivity and reliability by suppressing transient events. The individual Single-exposures framesets are combined in the Multiframe Pipeline to produce the deep, coadded Image Atlas and Working Database of sources detected on the Atlas Images. The deep detection extraction process in the Multiframe Pipeline performs PSF chi-squared minimization on all Single-exposures in all bands simultaneously, to determine the optimal position and mean fluxes for the detection. Once the combined position and source fluxes are measured, fluxes are then measured on the individual Single-exposure framesets, by holding the position constant and fitting only for the PSF amplitude on each frameset. The set of Single-exposure flux measurements for each deep source extraction is then written to the AllWISE MEP Database.
The MEP Database contains a set of entries corresponding to each entry in the Source Catalog and Reject Table. There are a combined 1,176,421,279 source extraction in the Catalog and Reject Table, so on average there are 36 flux measurements in the MEP Database per source. The actual number of measurements per source varies between a few and ~300 depending on the survey depth-of-coverage for the source.
The MEP Database is not a traditional catalog of discrete objects to be used for statistical population and discovery investigations. It is a resource that enables the simple retrieval of nearly the entire photometric history of extractions in the AllWISE Source Catalog and Reject Table. The entries in the Catalog and Reject Table are cross-referenced to the MEP Database via the unique Catalog/Reject identifiers source_id, cntr and static source position (ra, dec). These identifiers are called source_id_mf and cntr_mf in the MEP Database. The "_mf" suffix here indicates that the identifiers are the source extractions from the AllWISE Multiframe Pipeline processing.
The format of the MEP Database and descriptions of each column are given in III.3.a. The equatorial position in the MEP DB is that of the deep source detection in the Catalog or Reject Table because the source positions are not re-evaluated on the individual Single-exposures. Flux measurements in the MEP Database that are made on the Single-exposures have suffixes of "_ep" to distinguish them from the similar named columns in the Source Catalog and Reject Table.
Suggestions on how best to search the MEP Database are given in III.1.c, and sample light curves are shown in III.1.d. You are strongly encouraged to the read the Cautionary Notes for the AllWISE MEP Database.
Although all contain measurements made on the WISE Single-exposure images, the AllWISE Multiepoch Photometry Database and the All-Sky Release, 3-Band Cryo Release and Post-Cryo Release Single-exposure Source Databases (DBs) differ in several fundamental ways:
The MEP DB is a resource to obtain light curves for and analyze the time history of objects that are first identified in the AllWISE Source Catalog or Reject Table. It is not a well-vetted, unique list of objects in the way the Catalog is. Because of its nature and extremely large size, the MEP DB should not be used to make large-area statistical queries.
MEP contains flux histories of all deep extractions in Catalog as well as the Reject Table. Consequently, it contains duplicate, redundant entries, measurements of spurious detections of image artifacts and faint noise detections.
The best way to retrieve light curves for objects in the MEP is search using one of the two unique source identifiers from the Catalog or Reject Table, source_id or cntr. These identifiers are called source_id_mf and cntr_mf in the MEP Database (the "mf" suffix stands for "Multiframe").
For example, AllWISE Catalog source WISEA J104603.43-524240.7, a previously unknown W UMa variable star identified by its AllWISE variability flag, has source_id='1627m531_ac51-040363" and cntr=1627053101351040363. Select the MEP Database entries that correspond to this source using either of the following constraints:
This query returns the 49 entries listed in Table 1. The raw light W1 curve made from these entries is shown in Figure 1. WISEA J104603.43-524240.7 was observed in three separate epochs, the first two during the WISE 4-Band Cryo phase and the third during the NEOWISE Post-Cryo phase.
 |
| Figures 1 - The AllWISE MEP Database W1 light curve of the W UMa variable star WISEA J104603.43-524240.7. The three panels correspond to the three different observation epochs. |
The MEP entries contain the equatorial position of the Catalog or Reject Table deep detection to which they correspond. Therefore, you can search for the light curve of an object using position, or an object name if using a name/position resolved query interface such as the IRSA/GATOR service. However, because the MEP DB contains the flux measurements for both Catalog and Reject Table, there may be multiple, redundant light curves for the same object.
For example, if you search the MEP for entries within 2 arcsec of WISEA J104603.43-524240.7, 98 flux measurements will be returned, twice as many as the query on source_id_mf or cntr_mf. This star falls in the overlap region between two Tiles. The additional entries correspond to source_id_mf= '1602m531_ac51-051724' the duplicate extraction of the same object in Tile 1602m531_ac51 that is in the Reject Table. One, unique apparition of such duplicate extractions was selected for the AllWISE Catalog during the Catalog Generation process (V.4.b), and the others are placed in the Reject Table. The best way to distinguish between MEP Database entries from the Catalog or Reject Table at this time is via their source_id_mf and cntr_mf entries.
Some of the flux measurements in the MEP Database may be contaminated by transient events such as charged particle strikes and scattered moonlight. This contamination can produce occasional outliers in light curves. The lowest quality Single-exposure framesets were not used in AllWISE Multiframe Pipeline processing (V.1.b.ii), and their measurements will not be present in the MEP Database. However, framesets taken while WISE was in the South Atlantic Anomaly where the charged particle flux is enhanced, and those within the nominal footprint of scattered moonlight but not severe enough to be rejected dynamically during the Atlas Image coaddition process, were in Multiframe processing. Use the frameset quality metadata parameters included in each MEP Database entry to avoid the Single-exposure measurements with the greatest chance of contamination by adding the following constraints to your queries:
Figures 2 through 7 illustrate AllWISE MEP Database light curves for a various of types of objects. Figures 8-13 compare AllWISE MEP Database phased light curves with the light curves constructed with the WISE 4-Band Cryo, 3-Band Cryo and NEOWISE Post-Cryo Single-exposure Database, and illustrate some of the features discussed above in III.1.b above.
 |
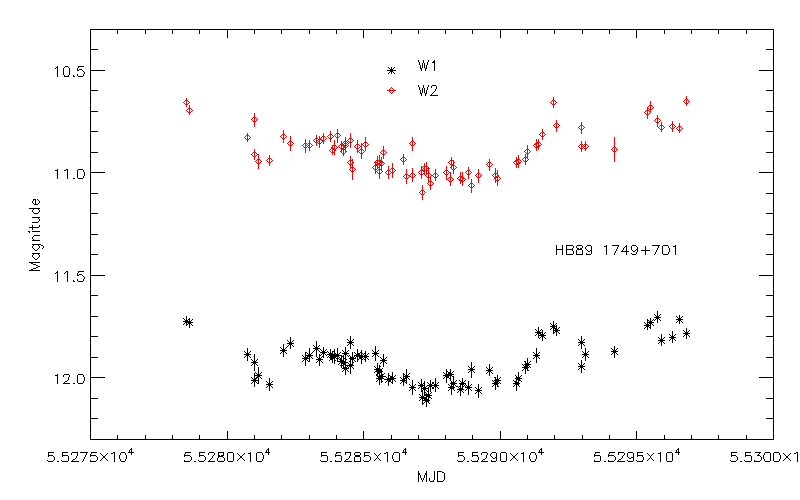 |
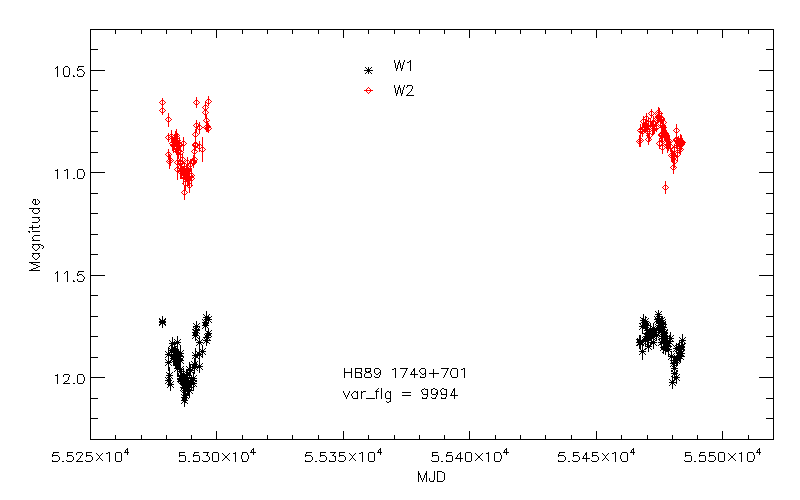
| Figure 2 - AllWISE MEP Database photometry for the BL Lac object HB89 1749+701 (source_id_mf='2679p696_ac51-040921'). W1 data are in black, and W2 data are in red. | Figure 3 - W1, W2 MEP photometry of HB89 1749+701, focusing on just the initial epoch. |
 |
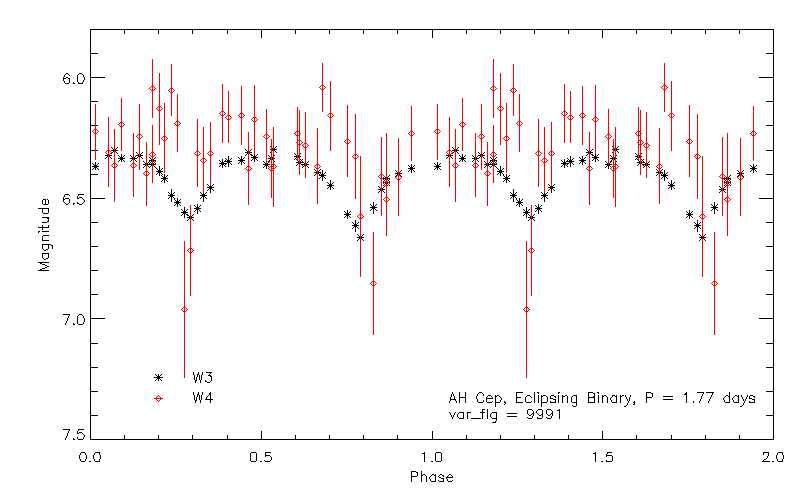 |
| Figure 4 - Phased MEP Database W1/W2 light curves for the Beta Lyr eclipsing binary AH Cep (source_id_mf='3425p651_ac51-032187'). | Figure 5 - Phased MEP Database W3/W4 light curves of AH Cep. |
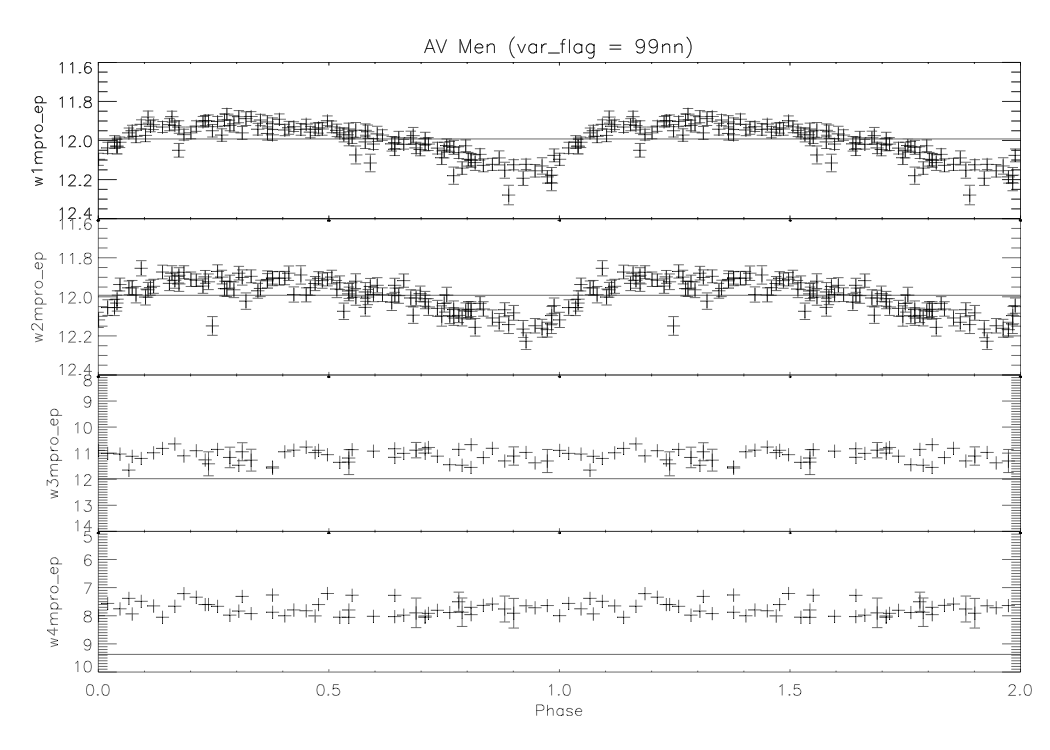 |
| Figure 6 - Phased W1-W4 light curves from the AllWISE MEP Database for the RR Lyra star AV Men (source_id_mf='0936m788_ac51-044925'). This star has 111 independent measurements in the MEP Database. The horizontal lines show the ALLWISE Catalog profile-fit magnitudes in each band. Most of the W3 and W4 MEP flux measurements are upper limits (e.g. the "+" points with no error bars), whereas the Catalog measurements are >2; detections. |
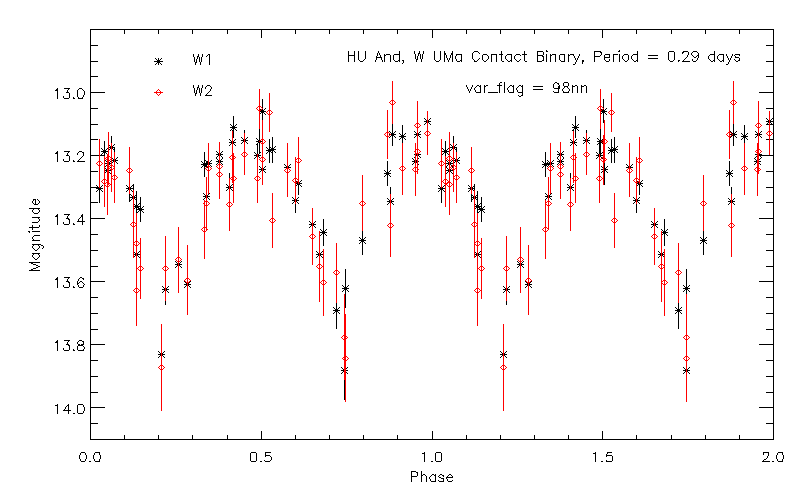 |
| Figure 7 - Phased light curve from the AllWISE MEP DB for the W UMa contact binary HU And (source_id_mf='0096p393_ac51-057756'). |
 |
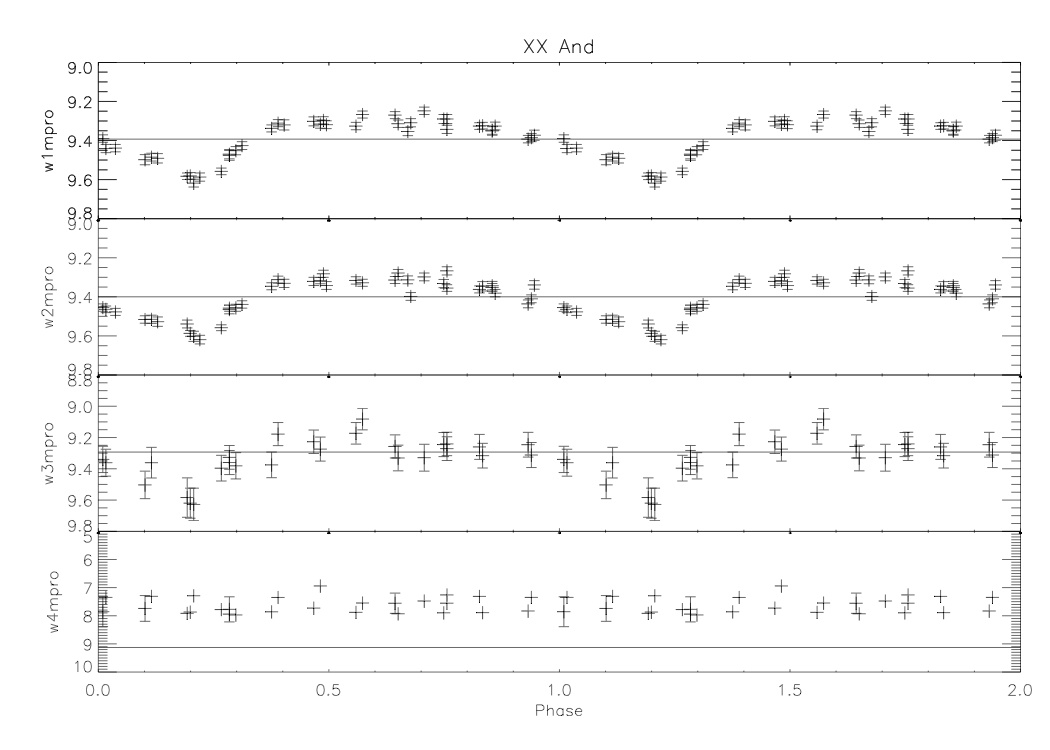 |
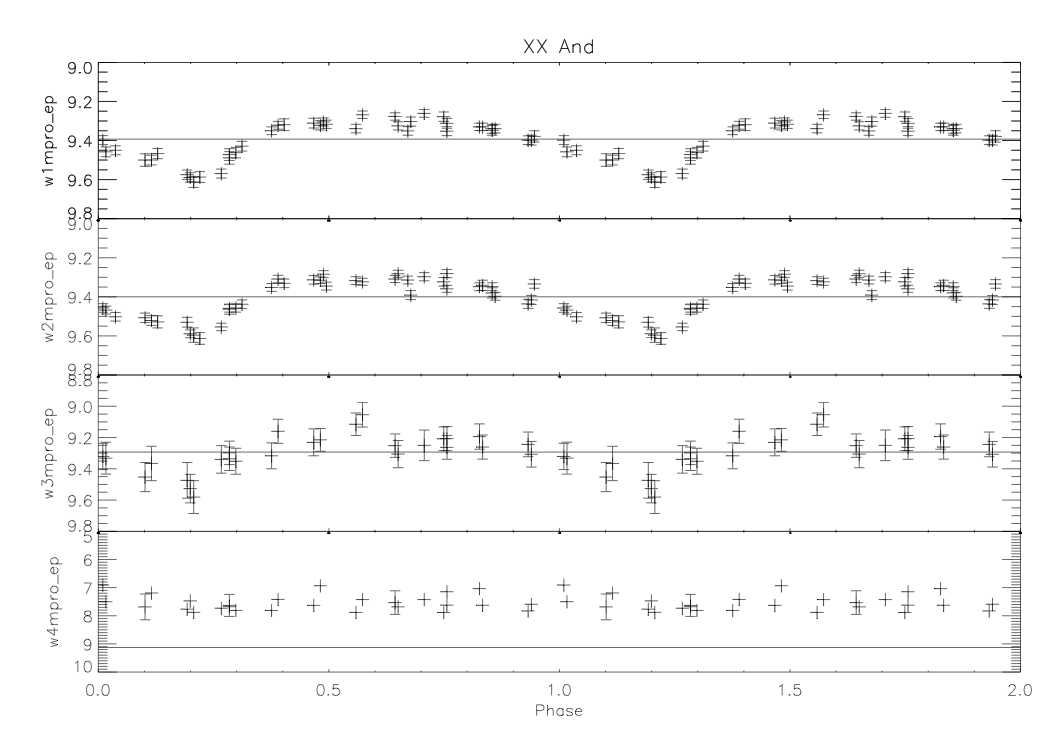
| Figure 8 - Phased light curves from the AllWISE MEP Database photometry for the RR Lyra variable XX And (source_id_mf='0193p393_ac51-017636'). | Figure 9 - Phased light curves for the XX And, using photometry from the WISE 4-Band and NEOWISE Post-Cryo Single-exposure Databases. Once again, horizontal lines indicate the AllWISE Catalog profile-fit magnitudes. |
 |
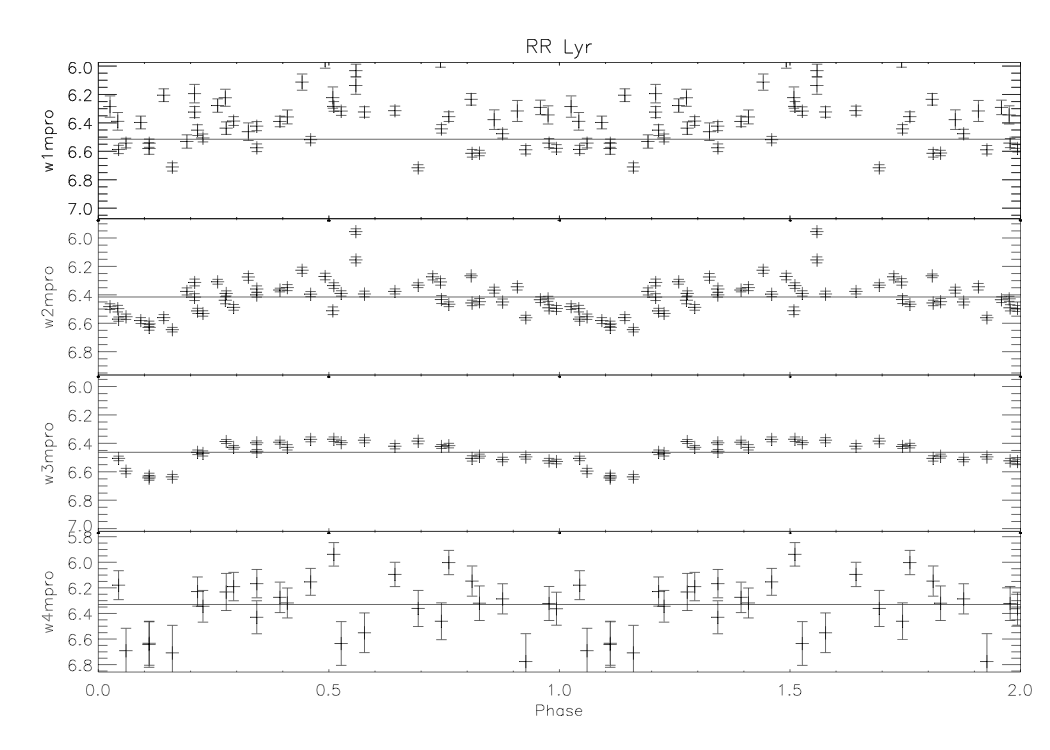 |
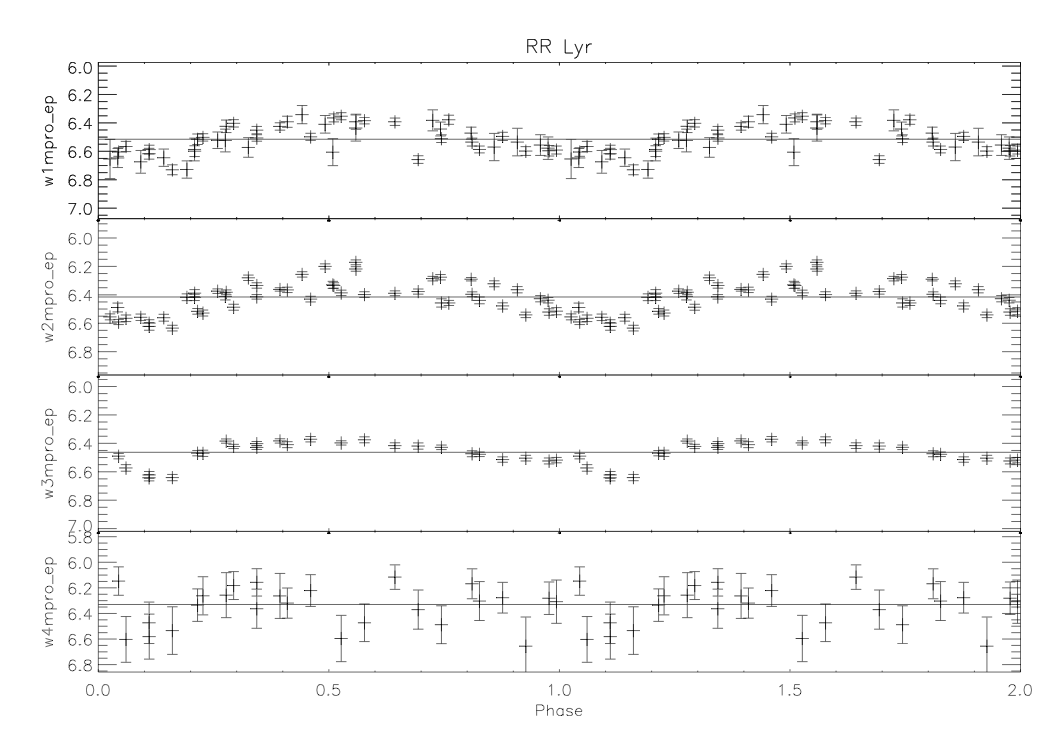
| Figure 10 - Phased light curves for RR Lyr using AllWISE MEP Database photometry. RR Lyr is well above the saturation limit in W1 and W2. The light curves are far less noisy than the Single-exposure Database light curves shown in Figure 10 because the MEP photometry is force at the best-fit sky position from the Multiframe source extraction. | Figure 11 - Phased light curves for RR Lyr constructed using photometry from the WISE and NEOWISE Single-exposure Databases. |
 |
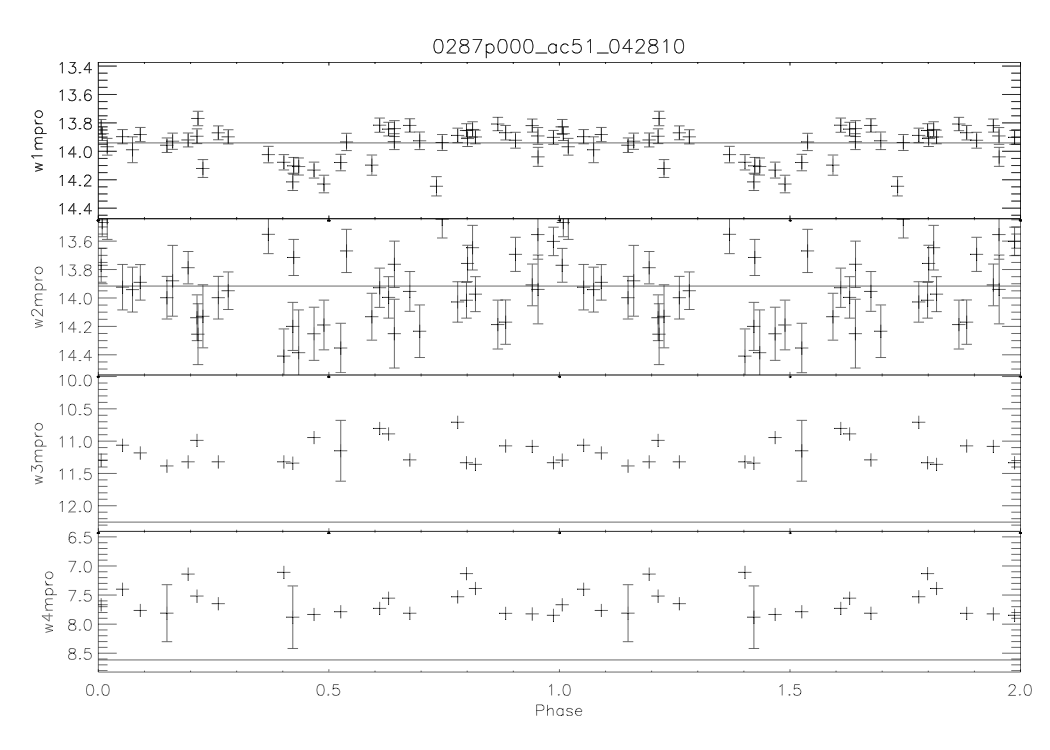 |
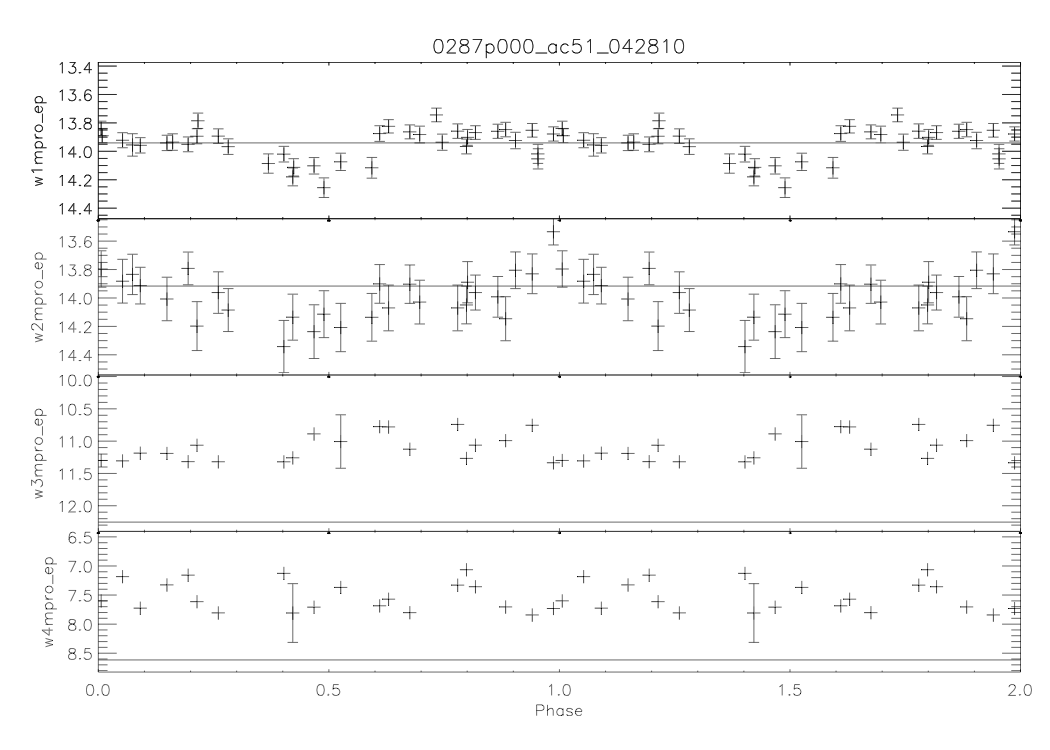
| Figure 12 - Phased light curves from the MEP Database for WISEA J015450.17+001500.5 (source_id_mf='0287p000_ac51-042810), a faint RR Lyr variable star. The MEP light curves are cleaner than the Single-exposure light curve shown in Figure 13 both because of the fixed, best-fit sky position, and also because some of the worst outliers Single-exposures have been removed in Multiframe processing by moon masking. | Figure 13 - Phased light curves for WISEA J015450.17+001500.5 constructed using photometry from the Single-exposure Databases. Many of these measurements are contaminated by scattered moonlight. |
Last Updated: 14 November 2013