


The fundamental objective of WISE is to produce a sensitive mid-infrared all-sky survey. The sensitivity of the WISE All-Sky Data Release is characterized in Section VI.3.a. There is no requirement on sensitivity in the 3-Band Cryo Release products, but it is comparable to the All-Aky Release in W1 (3.4 μm) and W2 (4.6 μm), and an order of magnitude worse in W3 (12 μm) because of reduced exposure times and increased emission from the warming telescope and Si:As detector.
As for the All-Sky Release, WISE sensitivity varies with position on the sky due to changes in the depth of coverage and the zodiacal foreground emission, both of which improve towards the ecliptic poles, and in the local source density (primarily due to Galactic sources) which limits sensitivity because of confusion.
The estimated WISE magnitudes and fluxes for SNR 5 from comparison to Spitzer data for W1 and W2 in the ELAIS N2 field, which has coverage depth 27 (well above the median for the 3-band survey), and from stars with coverage depth 11 to 13 over the full 3-band survey area, are given in Table 1 below. Also shown are the estimated SNR 5 values for the ELAIS N2 field based on the WISE profile-fit photometry noise model
| Noise Model | Noise Model | ||
|---|---|---|---|
| Band | External Check2 | ELAIS N23 | 95%4 |
| W1 (3.4 μm) | 0.0635/17.03 | 0.021/17.92 | 0.043/17.14 |
| W2 (4.6 μm) | 0.0816/15.99 | 0.040/16.58 | 0.083/15.78 |
| W3 (12 μm) | 10.3/8.63 | 1.00/11.16 | 10.4/8.61 |
Notes to Table 1
|
|||
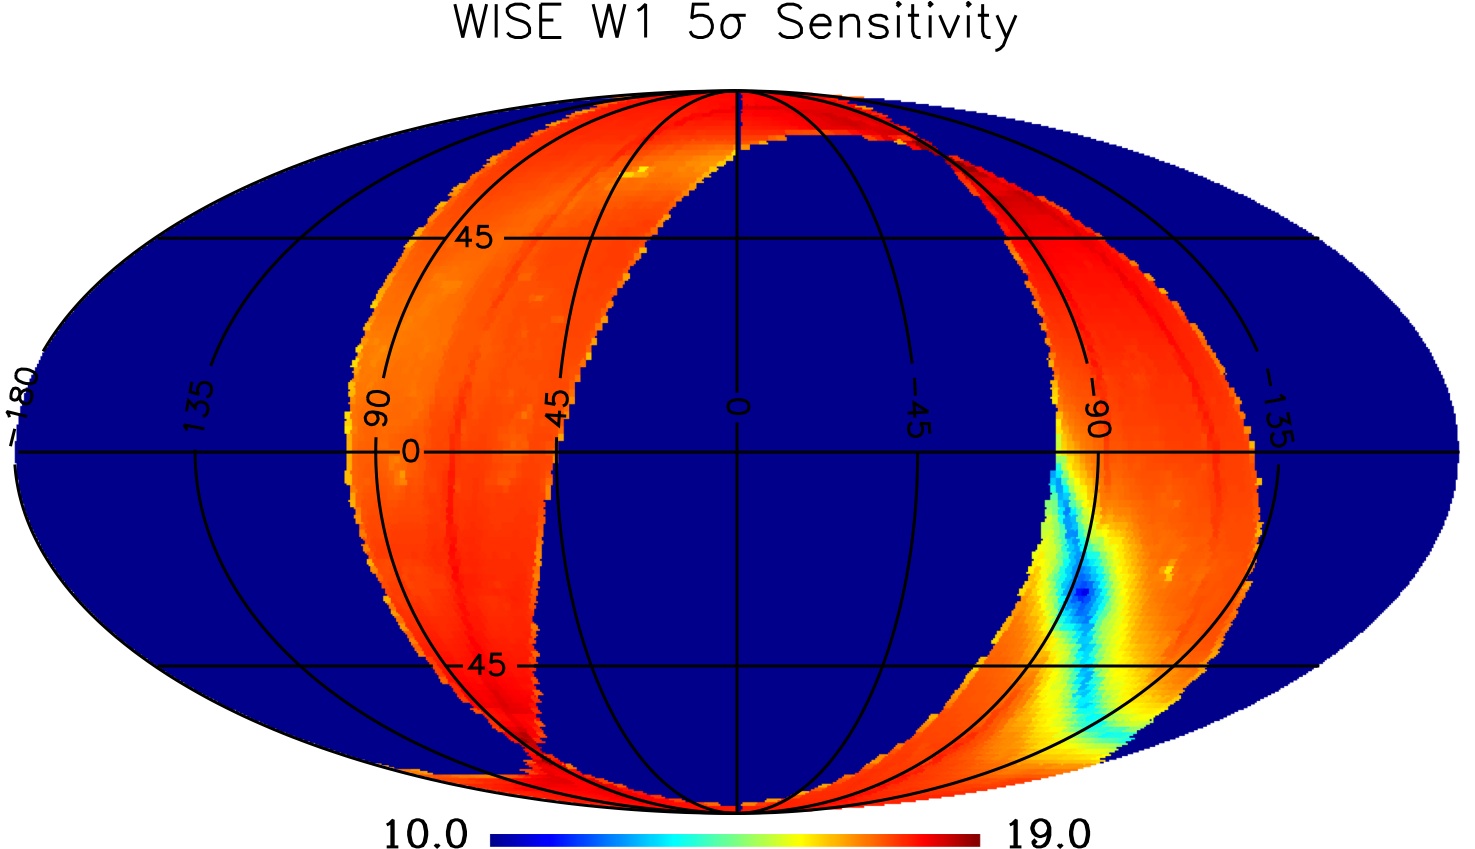
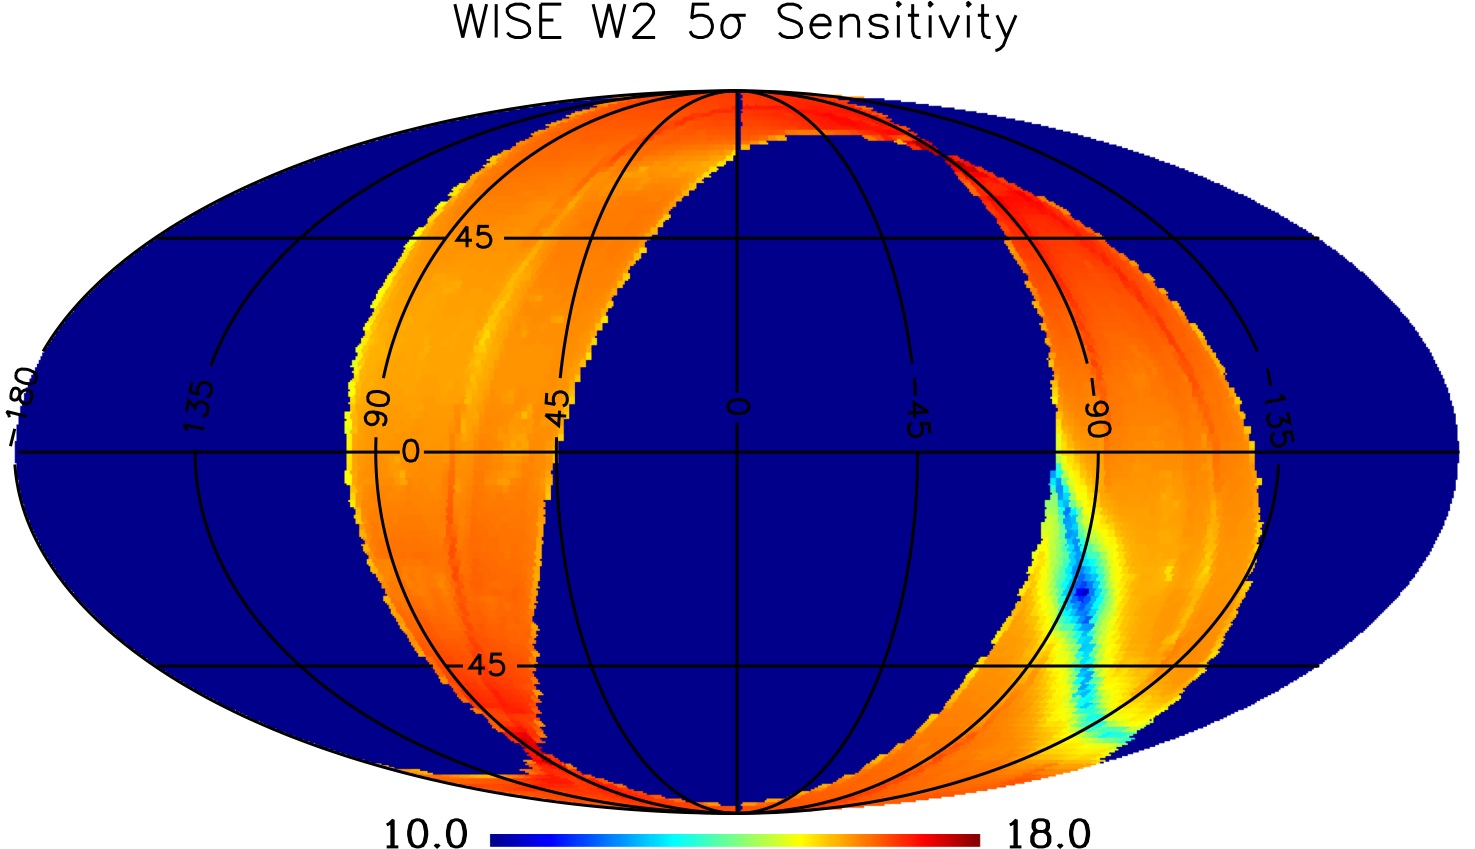
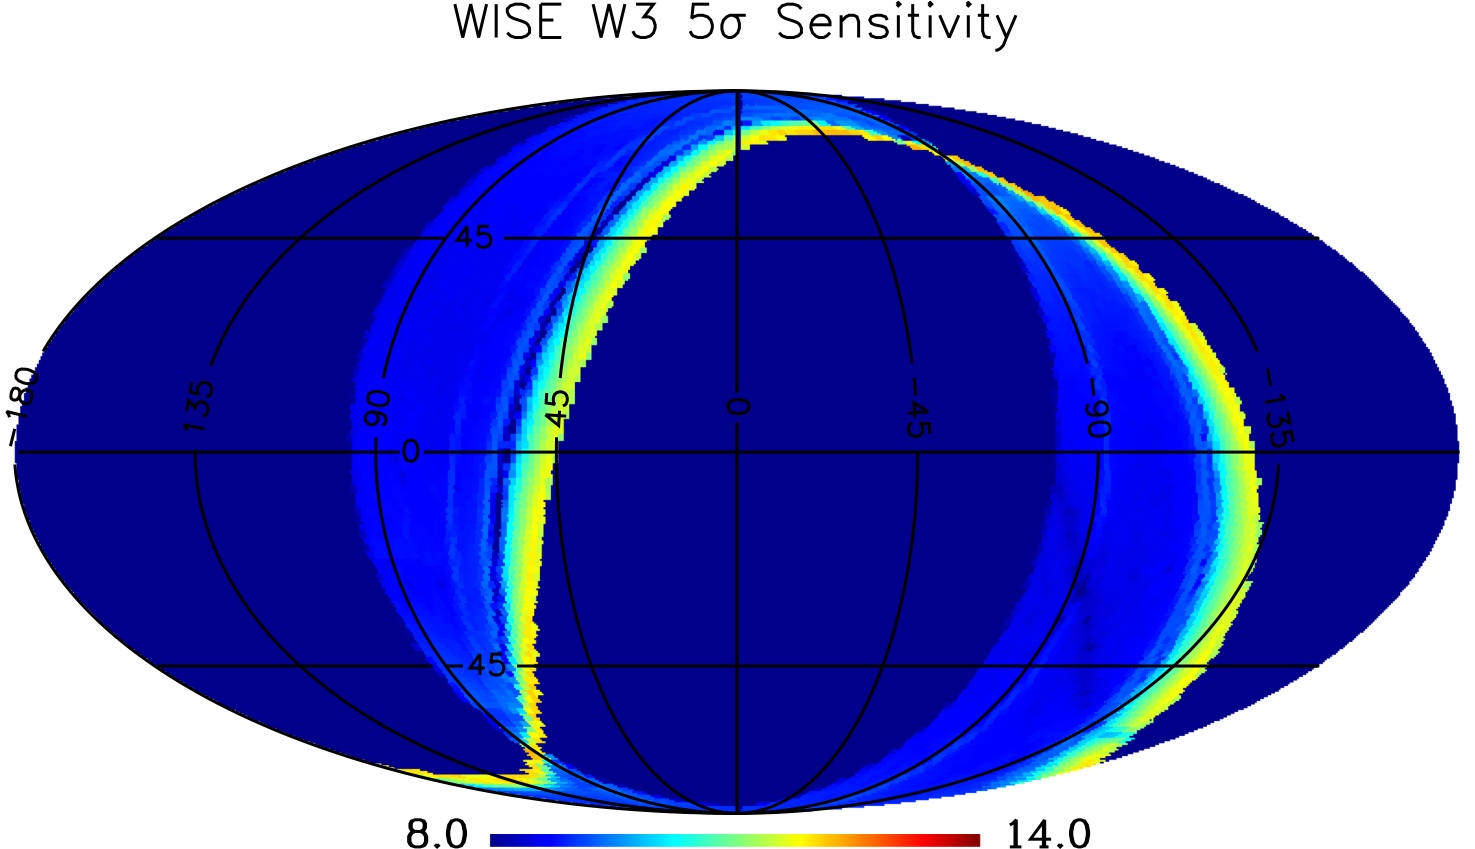
Figure 1 shows the variation over the sky area covered by the 3-Band Cryo data of the the magnitude corresponding to SNR 5 from the noise model for WISE bands W1, W2, and W3, plotted in equatorial coordinates. In Table 2 are listed magnitudes corresponding to SNR 5, 7, and 10 from the noise model for each Tile in the 3-Band Cryo Release in order of declination, For convenience the Tile ID, and equatorial, Galactic, and ecliptic coordinates are also provided.
 |
 |
| W1 | W2 |
 |
|
| W3 | |
| Figure 1 - Magnitude at SNR 5 vs.position on the sky from the WISE 3-Band Cryo Release noise model (equatorial projection). | |
A similar strategy to that used in Section VI.3.a was used to perform external checks of the WISE 3-band sensitivity. Spitzer/IRAC 3.6 and 4.5 μm data (hereafter referred to as [3.6] and [4.5]) from the SWIRE ELAIS-N2 field were used as a "truth table" to compare to the W1 and W2 bands on WISE. For the 12 μm W3 band, stars were selected based on their 2MASS morphologies and 2MASS, W1, and W2 colors, and their W2 magnitudes used to predict the W3 magnitudes.
Although Spitzer/IRAC observations are now in hand for hundreds of square degrees, the majority are near the Galactic plane, where confusion complicates the assessment of WISE sensitivity. A variety of high galactic latitude fields have also been surveyed with Spitzer, but the only one of any significant size which overlaps the WISE 3-Band Cryo survey region is the 2.6 deg2 Spitzer Wide-area InfraRed Extragalactic Survey (SWIRE) ELAIS-N2 field, centered at 16h 40m +41d 15m. This field is at fairly high galactic latitude (42°), and has 27 coverages with WISE due to its high ecliptic latitude (62°).
IRAC [3.6] and [4.5] magnitudes were downloaded from the SWIRE ELAIS N2 Region Spring 05 Spitzer Catalog from IRSA with the requirement that they have 3.6 μm flux densities > 30 μJy in the r=1.9" aperture (aperture 2). To ensure a compact source whose flux could be compared to the WISE point source fitting photometry measurements, the SWIRE 3.6 μm flux in the 4.1" radius aperture (aperture 4) was required to be less than 10% larger than that in the 1.9" radius aperture. In addition, to minimize color effects, especially between [3.6] and W1 (see Figure 2 of VI.3.a), the IRAC Vega-system color was required to satisfy -0.1 < [3.6] - [4.5] < 0.0. This returned 9,150 sources.
Those sources were uploaded and matched to W1 and W2 photometry in the WISE Pass2 3-Band Multiframe Source Table, requiring a matching radius of 2", that the WISE extended source flag (ext_flg) was 0 and the proximity to a 2MASS extended source (xscprox) was null, and that the contamination and confusion flags (cc_flags) were 0 in all four WISE bands (even though only 3 bands are present, all four must be specified). This matching process returned 7,678 sources.
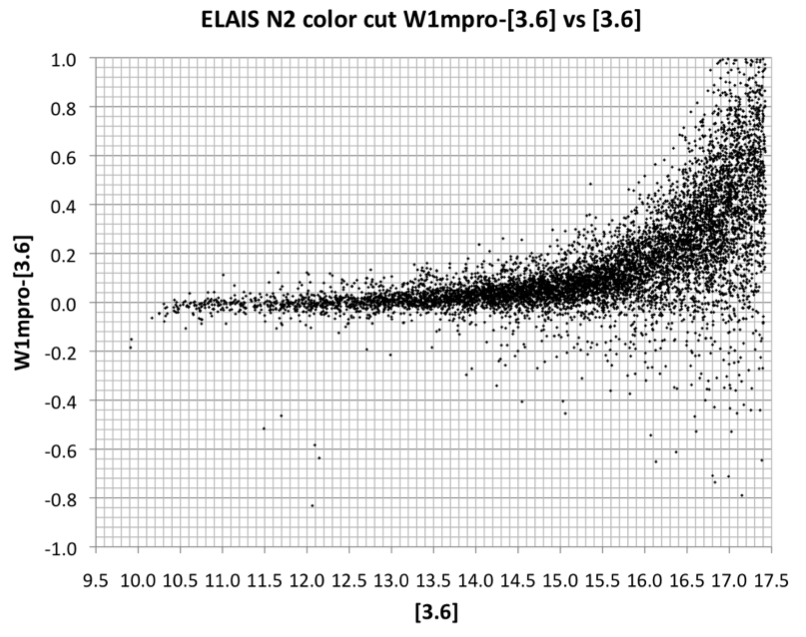
Figure 2 shows a plot of these ELAIS-N2 field stellar sources in W1-[3.6] vs [3.6]. As for the All-Sky release, the difference between W1 and [3.6] becomes systematically larger at faint [3.6] magnitudes, in the sense that the W1 magnitudes are larger (fainter) than the [3.6] magnitudes, and this systemaic trend is not present in the WISE aperture photometry. Figure 3 shows this trend more clearly in a plot of the median difference between W1 and [3.6] vs [3.6] calculated for a moving window including 200 objects at a time. Section VI.3.c provides additional detail on this bias, which is not fully understood.
 |
 |
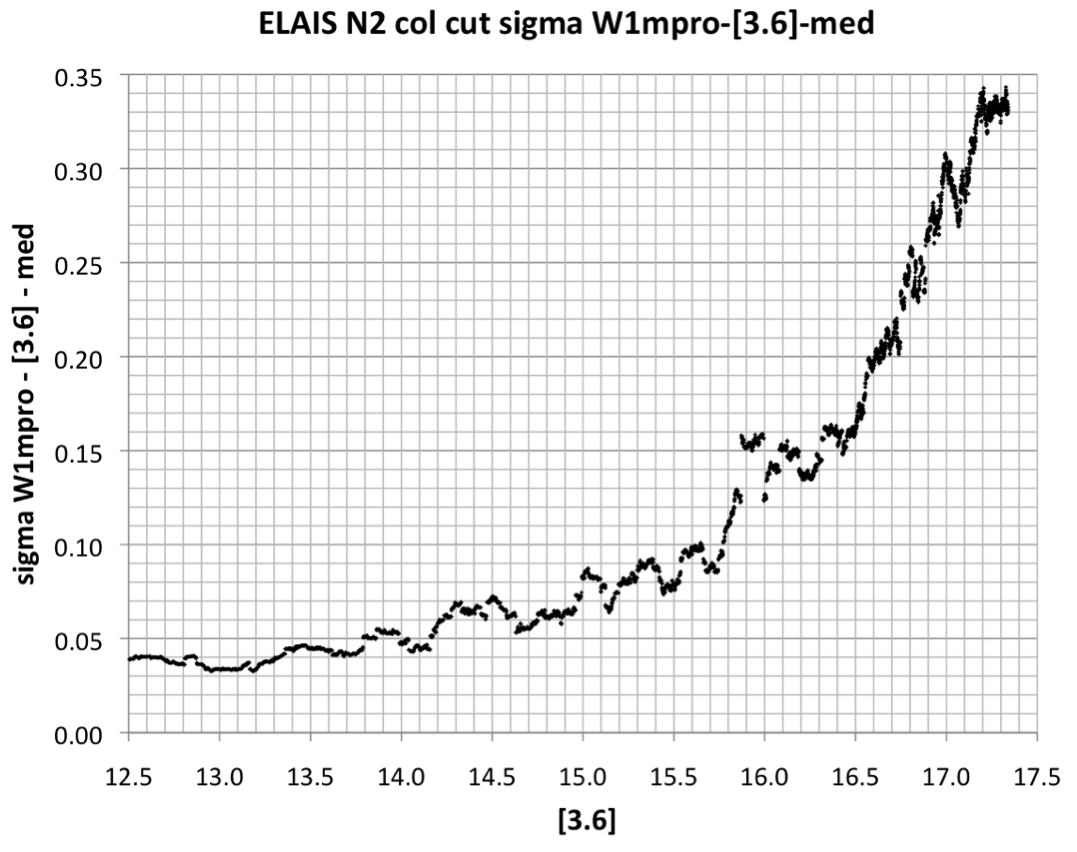 |
| Figure 2 - WISE W1 - Spitzer [3.6] photometry vs. [3.6] for stellar color sources in the ELAIS-N2 field. | Figure 3 - Median W1 - [3.6] color difference vs [3.6] for stellar color sources in the ELAIS-N2 field. | Figure 4 - rms of {W1 - [3.6] - median(W1-[3.6] from figure 3)} vs [3.6] for stellar color sources in the ELAIS-N2 field. |
To estimate the W1 sensitivity, the sigma in W1 - [3.6] - the running median shown in Figure 3, was calculated for a moving window including 200 objects at a time and plotted against the median [3.6] in that window in Figure 4. Since mag = 2.5log10(flux) = [2.5/ln(10)]ln(flux) and thus d(mag) = [2.5/ln(10)] df/f, the rms mag error corresponding to a given SNR=f/df is just 2.5/[SNR*ln(10)] or 1.086/SNR. For SNR=5, the running median rms in W1 - [3.6] is 0.217 mag at [3.6] = 16.72. As noted above, W1 magnitudes become systematically fainter than [3.6] magnitudes as [3.6] increases, so the W1 magnitude which corresponds to a 5σ sensitivity is W1=17.03. However, in the absence of a full understanding of the systematic photometric bias at fainter W1 magnitudes, we assume the correct flux density to associate with SNR 5 is given by that for W1 -[3.6] = 0, i.e. W1 = 16.72, or 63 μJy. This value for the ELAIS-N2 field, which has 27 coverages in the 3-Band Release, is similar to the values obtained in the All-Sky Release of 60 μJy for the XMM-LSS field with 23 coverages and 53 μJy for the SDWFS field with 30 coverages (Section VI.3.a.i.1)
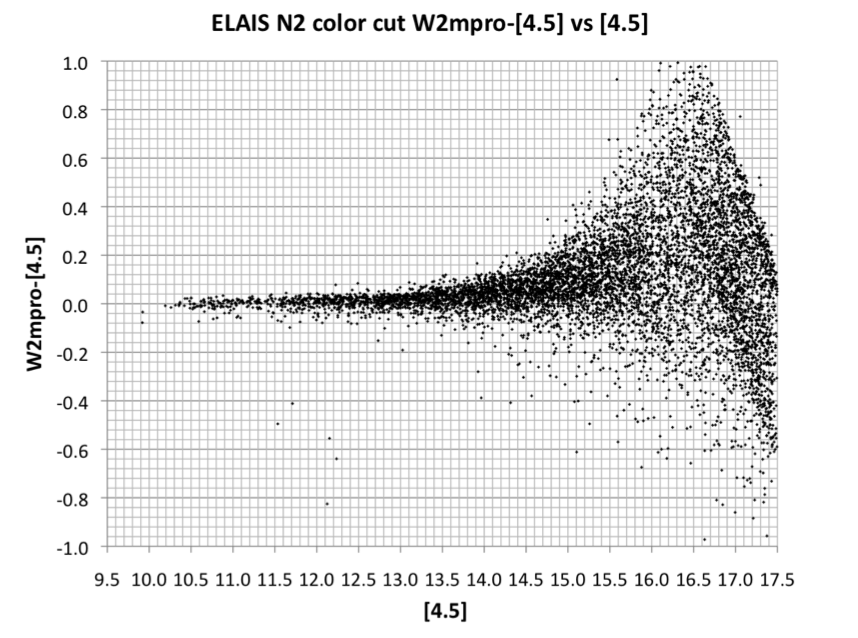
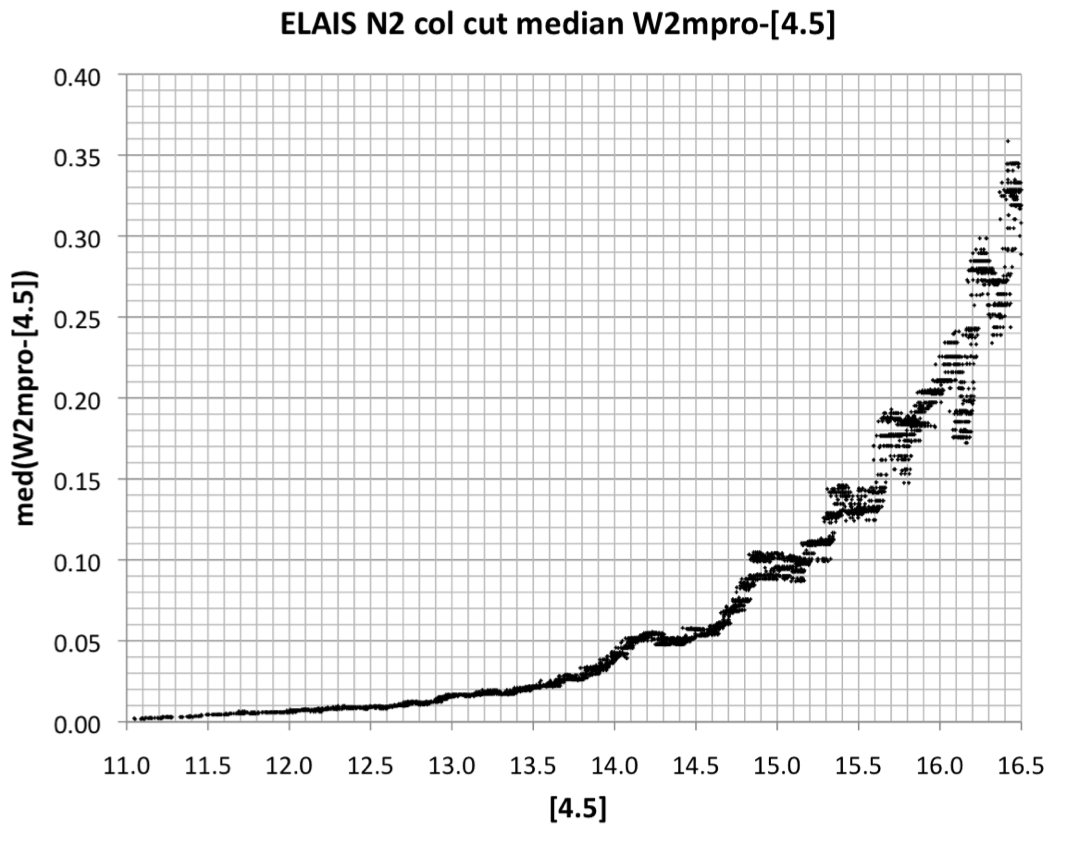
A similar procedure to that for W1 was followed in comparing the W2 band to [4.5] ELAIS-N2 photometry. The trend for W2 magnitudes to become systematically fainter than [4.5] as a function of [4.5] magnitude (Figure 5) is more pronounced in the 3-Band Cryo data than is the case for the All-Sky Release. Figure 6 plots the running median of 200 sources in W2 - [4.5]. Compare figures 5 and 6 here to figures 8 and 9 in Section VI.3.a.i.1. Again the WISE aperture magnitudes do not show this systematic trend.
 |
 |
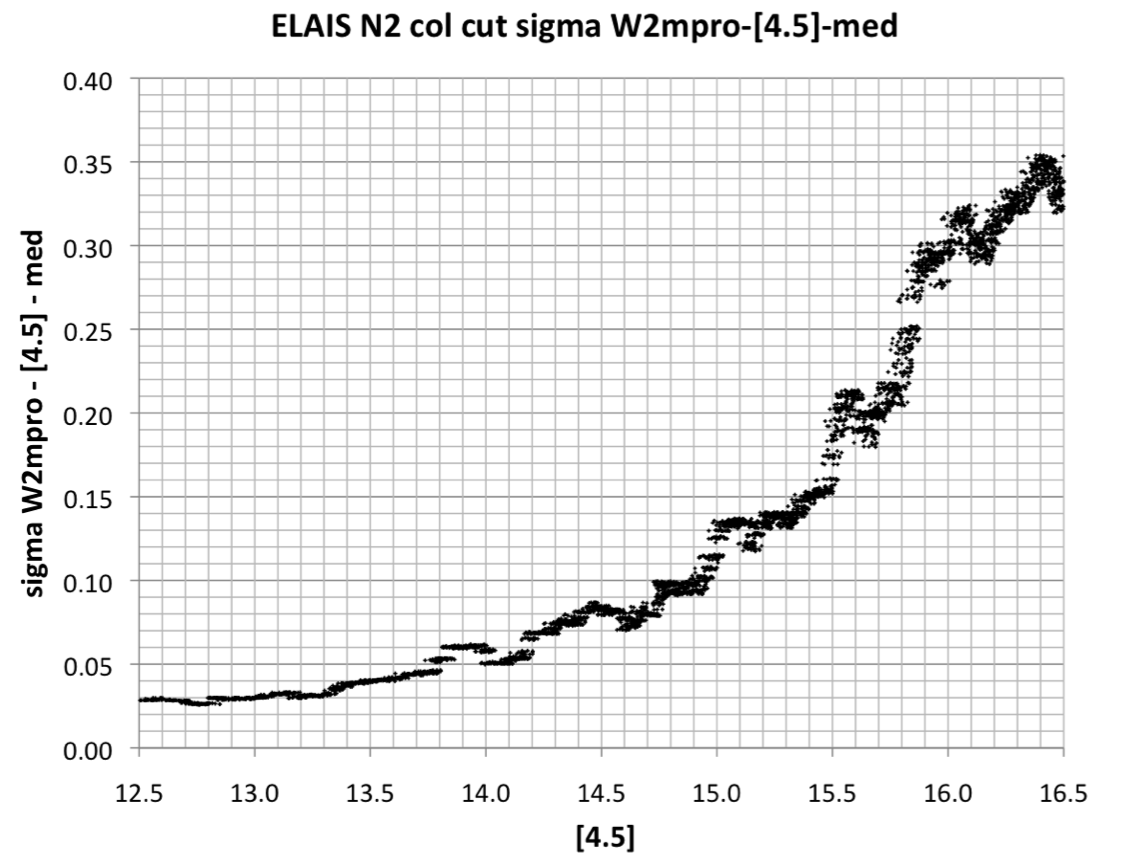 |
| Figure 5 - WISE W2 - Spitzer [4.5] photometry vs. [4.5] for stellar color sources in the ELAIS-N2 field. | Figure 6 - Median W2 - [4.5] color difference vs [4.5] for stellar color sources in the ELAIS-N2 field. | Figure 7 - rms of {W2 - [4.5] - median(W2-[4.5] from figure 6)} vs [4.5] for stellar color sources in the ELAIS-N2 field. |
Figure 7 shows the running rms of 200 sources in W2-[4.5]-median(W2-[4.5]) vs. [4.5]. The SNR 5 value is at [4.5]=15.81. The median offset at this magnitude is W2 - [4.5] = 0.18, but as for W1 we assume the correct flux density to associate with SNR 5 is for W2 - [4.5] = 0, i.e. W2=15.81 or 81 μJy. As for W1, this value is similar to the All-Sky Release W2 value.
2MASS stars were used as an external check on W3 sensitivity. The WISE 3-Band Cryo Source Working Database (WDB) allows direct queries on cross-matched 2MASS sources. An all-sky search on the 3-Band Source WDB was carried out for sources with 11 to 13 coverages in WISE band 3 (w3m=11); a single 2MASS counterpart (n_2mass=1) within 3" (r_2mass<3); not extended or close to a 2MASS extended source (ext_flg = 0 and xscprox is null); well detected in 2MASS (k_m_2mass<10 and k_msig_2mass<0.03); and with colors appropriate for stars hotter than spectral class F7 (-0.05<j_m_2mass - k_m_2mass<0.3 and k_m_2mass - w2mpro<0.1 and -0.05<w1mpro - w2mpro<0.05).
In addition, sources were required to have no contamination or confusion in any band (cc_flags = "0000"); only a single blend component (nb = 1); good PSF fits especially in W3 (rchi2<1.5 and w3rchi2<1.2); to have a Galactic latitude of at least 20° and be at least 30° from the Galactic Center, and to avoid the Large and Small Magellanic Clouds. Finally, because the telescope temperature was rising from 12 to 45K during the 3-Band survey period, the exposure time in W3 was reduced from 8.8 sec on 2010 Aug. 5 to 1.1 sec on Aug. 23. 70% of the sky covered in the 3-Band Cryo survey has 1.1 second exposure in W3. To avoid introducing excess scatter into the W3 external sensitivity estimate, only 1.1 sec exposure data were considered, by restricting the ecliptic longitude to fall within either 60° and 100° or 245° and 285°. These constraints yielded a total of 2,769 sources.
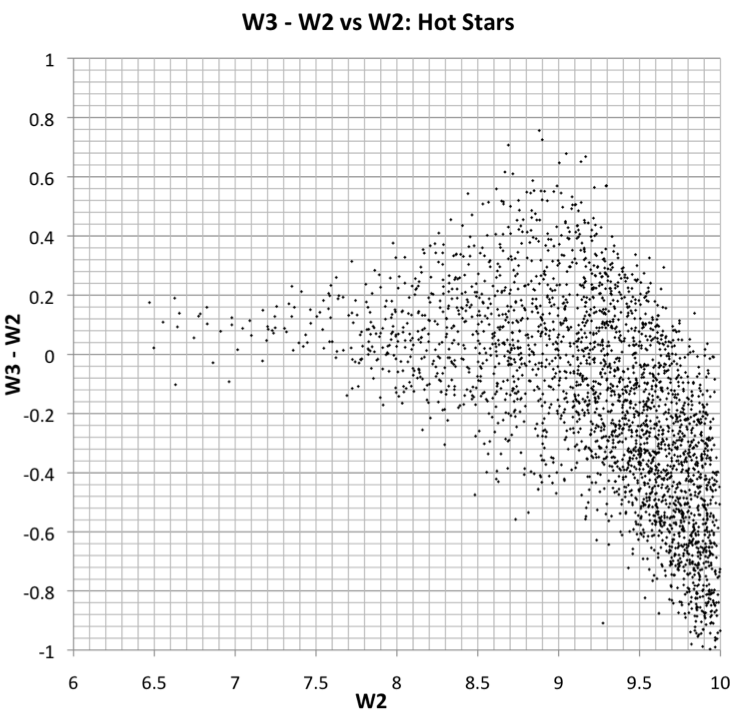
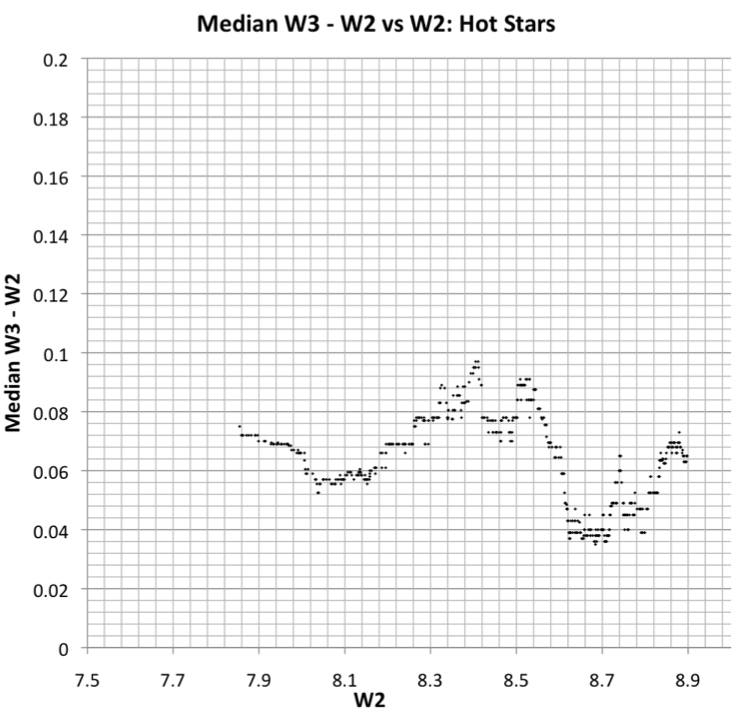
Figure 8 shows a plot of W3 - W2 vs. W2 (with the running median overlaid) for these sources. It is evident that W3 does not reach below 9th mag, which reduces the number of stars to 797 brighter than W2 = 9. Figure 9 shows the median offset, which is noticeable at about 0.08 mag, but the variation with magnitude is probably not significant. Figure 10 shows the rms in (W3 - W2 - median(W3-W2)) vs W2 for stars with W2 < 9, after excluding 5 sources more than 3σ away from them median (these outliers may include sources with excess emission in W3 from debris disks around hot stars). At coverage depth 11 to 13 for 1.1 sec exposure data, SNR 5 in W3 is at W2=8.55, which with the 0.078 median offset here corresponds to W3=8.63, or a flux density of 10.3 mJy. Due to the much shorter exposure time and elevated telescope foreground emission, this W3 sensitivity is an order of magnitude worse than in the All-Sky Release.
 |
 |
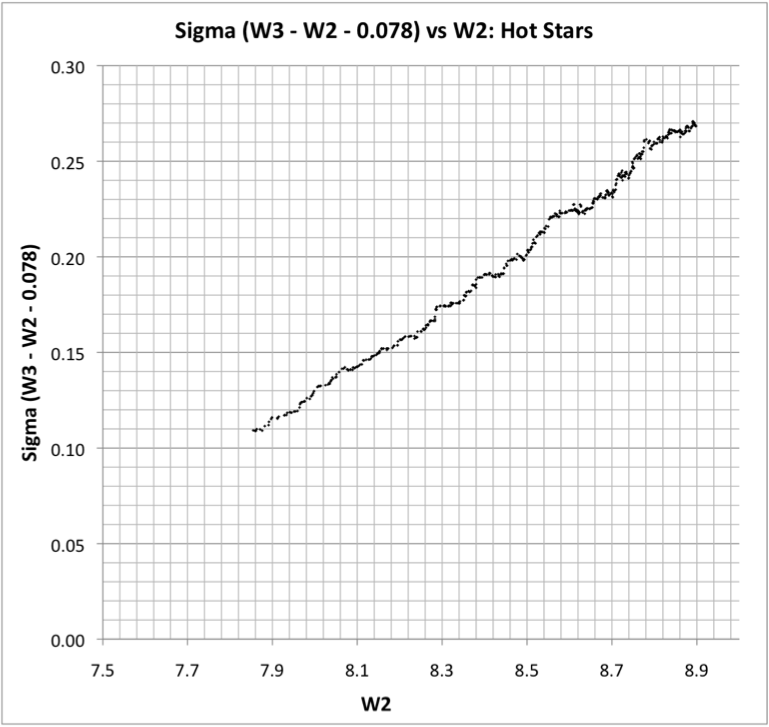 |
| Figure 8 - WISE W3 - W2 photometry vs. W2 for 2MASS stars with 1.1 sec exposure in W3. | Figure 9 - Median W3 - W2 photometry vs. W2 vs W2 for 2MASS stars with 1.1 sec exposure in W3. | Figure 10 - rms of {W3 - W2 - 0.078 (median of W3 -W2 from figure 6)} vs W2 for 2MASS stars with 1.1 sec exposure in W3. |
The 3-Band Cryo Source WDB includes the estimated error for every source based on the noise model. The third column of Table 1 shows the median W1 (and W2 and W3) magnitude for sources with SNR 5 (i.e. (w1sigmpro (and w2sigmpro and w3sigmpro) = 0.217 in the Image Atlas Tile containing the ELAIS-N2 field which are not extended (ext_flg = 0 and xscprox is null) and have cc_flags = 0 in the relevant band. The values are substantially fainter than those found from the external checks for W1 and W2. The flux density for the noise model SNR 5 magnitude has not been corrected for the photometric bias described in Section VI.3.c, which would increase the flux density at the noise model SNR 5 W1 and W2 magnitudes significantly. For W3 the external check is restricted to 1.1 sec data with coverage depth 11 to 13, and the Noise Model value for W3 in ELAIS-N2 has both higher exposure time and coverage depth, so should be significantly fainter.
To provide users with a sense of how the 3-Band Cryo Source Database sensitivity varies over the sky, the same procedure described for the ELAIS-N2 Tile was carried out for sources with SNR 5, 7 and 10 (i.e. w1sigmpro etc. = 0.217, 0.155, and 0.108 mag) in every Tile which had enough sources satisfying the constraints to provide a meaningful estimate in the appropriate WISE band. The results are listed in Table 2 and shown graphically for SNR 5 in Figure 1. The noise model WISE magnitudes for which 95% of Tiles with |b| > 20°, more than 30° from the Galactic center, and avoiding the Large and Small Magellanic clouds, have SNR 5 or higher is listed in Table 1.
Last update: 2012 July 26