Systematic errors in WISE photometry arise predominantly from source confusion, background estimation biases, data corruption (e.g., saturation), and calibration and zero point magnitude errors. The aperture photometry is most vulnerable to the effects of source crowding and saturation, while both aperture and profile-fit photometry are subject to errors in the background estimation, absolute calibration and instrumental zero point offset.
Figure 1 presents differences between WISE profile-fitting and aperture magnitudes plotted as a function of profile-fitting magnitude for sources in a region within the Chandra Deep Field South (CDFS; galactic coordinates: 224, -54 deg; ecliptic coordinates: 42, -46 deg). The two measures should agree, giving an offset of zero magnitude (cyan dashed line). Consider W1 at the bright end: W1 ~ 8th mag, the offset turns sharply negative. Saturation has rendered the aperture photometry to be systematically too faint (because information is lost), while the profile-fitting photometry is still able to capture the flux of the saturated sources. Between 8 to 13th mag, the W1 offset lies at zero mag, demonstrating agreement between the two measurements. For W1 > 13 mag, a systematic positive offset begins where the profile-fit photometry is increasingly fainter relative to the aperture measurements. Two sources contribute to this bias. First, aperture measurements are increasingly contaminated by nearby sources impinging on the measurement apertures, whereas profile-fitting is optimized to mitigate source confusion and source blending. Second, the profile-fitting fluxes are underestimated because of overestimation of the background levels, as discussed in the next section. W2 behaves in a similar fashion to W1, both in saturation, source confusion and background biases. In contrast, the longer wavelength channels, W3 and W4, are significantly less affected by saturation and source confusion difficulties (although they are still present).
 |
| Figure 1 - Differences between the profile-ftting (WPRO) and aperture (WAPPco) measurements plotted as a function of profile-fitting magnitude for sources in the CDF-S field. |
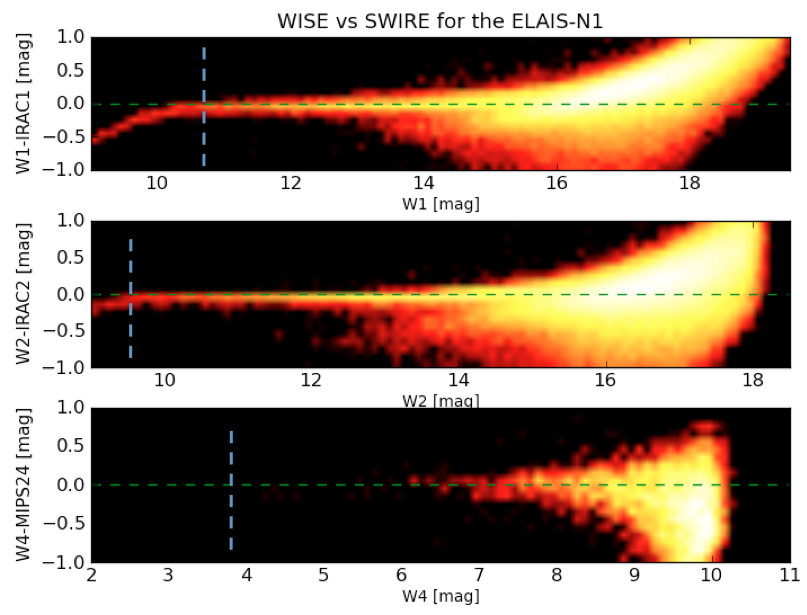
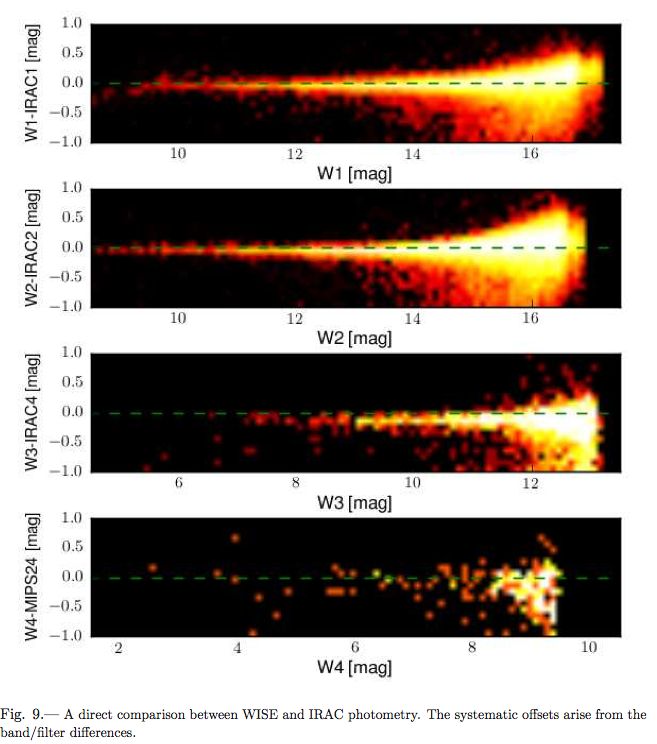
We present comparisons between WISE and Spitzer photometry for a variety of fields in Figures 2-5, including the Ecliptic (North and South) Poles, Chandra Deep Field South (CDFS), ELAIS-N1 (EN1), and XMM South (XMMs). They conclusively show that beginning at approximately W1>=14 and W2>13 mag, the WISE profile-fit measurements are increasingly fainter than IRAC1 and IRAC2 measurements, respectively. This bias occurs because the image background levels were systematically overestimated in the WISE measurements for two different reasons: 1) a false peak was introduced in the image pixel distributions during the image calibration step that skews the mode estimation used to measure background levels; and 2) background levels were not remeasured after subtracting bright sources when multiple sources were fit simultaneously during profile-fitting photometry.
For the W3 and W4 bands there is no apparent difference or bias between WISE and Spitzer photometry.
Note on nomenclature: IRAC1 == [3.4], IRAC2 == [4.5]
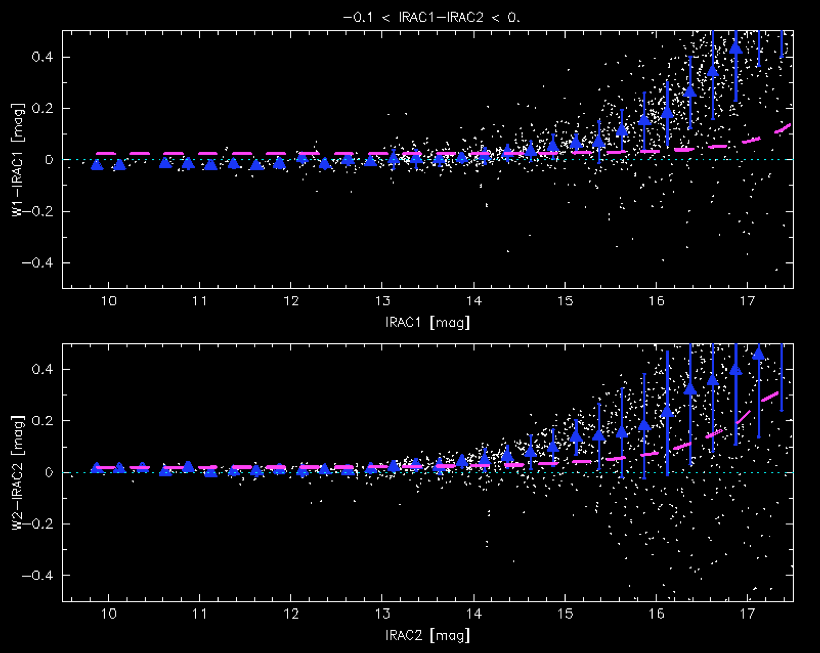
Figure 2a-2c show comparisons between WISE profile-fit photometry and Spitzer profile-fit photometry for the north and source ecliptic poles (the data from both poles are combined in Fig 2a) (Jarrett et al. 2011 ApJ, 735, 112). The WISE and Spitzer data sets have a similar photometric depth and sensitivity. Fig. 2a: for the short-wavelength bands of WISE, which closely match those of IRAC, the agreement is very good for bright sources, within 2 to 3%, while for the longer wavelength bands where the filter response is significantly different (e.g., 12 µm versus 8 µm), there is a 15% offset in the sense that W3 and W4 are brighter than IRAC-4 and MIPS-24, respectively. These differences are consistent with the differences between the relative system response curves (RSRs) and the mid-IR Rayleigh-Jeans spectral characteristics for most field stars along the line of sight. However, at the faint end, W1 and W2 > 15 mag, departures arise due to band-to-band astrophysical differences (fainter sources are galaxies, they are redder and therefore brighter in the Spitzer IRAC-1), and more importantly, the flux biases associated with low S/N measurements described above. Figures 2b and 2c show the NEP and SEP comparisons separately, and include a strict color cut to isolate only A-type stars that should little color bias at the faint end (unlike galaxies, which are expected to be brighter in IRAC1 relative to W1). In both fields, WISE W1 and W2 measurements are increasingly fainter than the Spitzer measurements, with biases approaching 0.3-0.4 magnitudes at the faintest levels. The bias is worse in in the SEP field because of the higher source density in that field (it is close to the Large Magellanic Cloud) and the dependence of background overestimation due to source confusion.
 |
 |
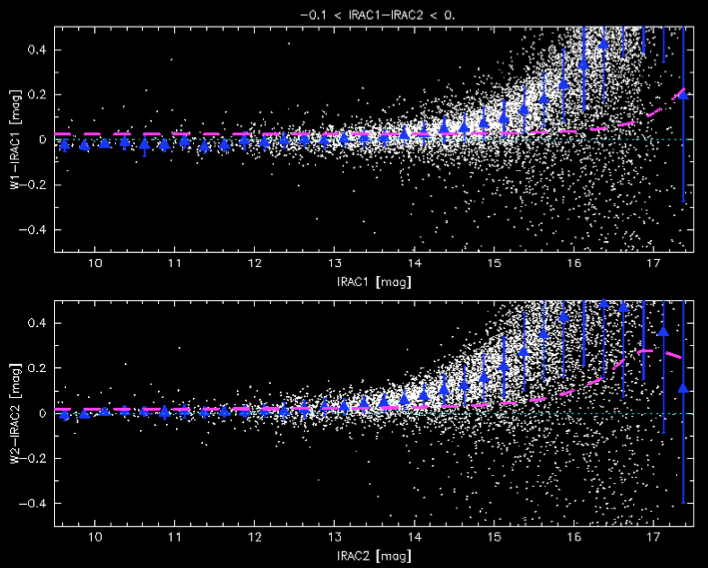 |
| Figure 2a - A direct comparison between WISE and IRAC photometry for the North and South Ecliptic Poles combined. The constant offsets arise from the band/filter differences. (Jarrett et al. 2011) | Figure 2b - NEP: comparing W1 vs IRAC1, W2 vs IRAC2, using a strict color cut: -0.1 < [IRAC1-IRAC2] < 0.0. ; the blue diamonds represent mean bin values, and the dashed magenta line the mean error of the WISE photometry. | Figure 2c - SEP: comparing W1 vs IRAC1, W2 vs IRAC2, using a strict color cut: -0.1 < [IRAC1-IRAC2] < 0.0. ; the blue diamonds represent mean bin values, and the dashed magenta line the mean error of the WISE photometry. |
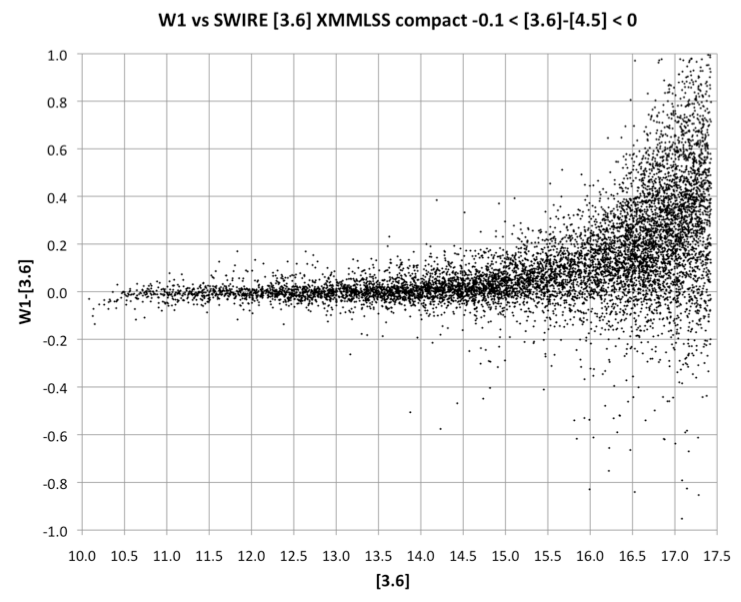
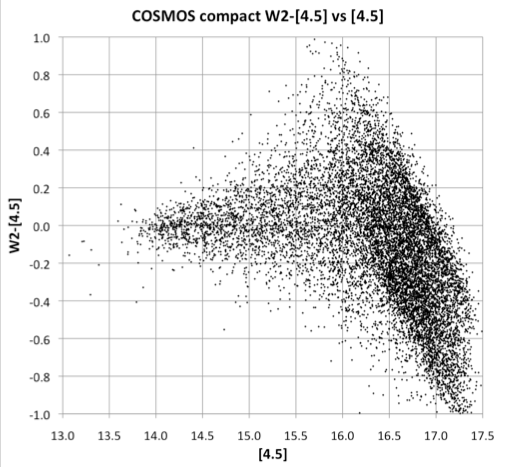
Comparisons between WISE W1, W2 and W4 and Spitzer IRAC and MIPS 24 µm photometry are shown in four additional fields in Figures 3-6. These comparisons all demonstrate the good agreement between the WISE and Spitzer photometry for bright objects, and the systematic flux underestimation for the WISE W1 and W2 measurements towards fainter flux levels.
CDFS
|
EN1
|
XMM-LSS
|
Cosmos
|
A comparison between the W1 magnitudes in the WISE All-Sky and Preliminary Data Release Source Catalogs for sources in the XMM south field is shown in Figure 7. The All-Sky Release Catalog measurements become progressively fainter than those in the Preliminary Release Catalog because the background measurement was switched to a mode estimator in second-pass data processing and was therefore sensitive to the false peak in the pixel distributions. This leads to systematic overestimation of the background levels in the All-Sky Release measurements.
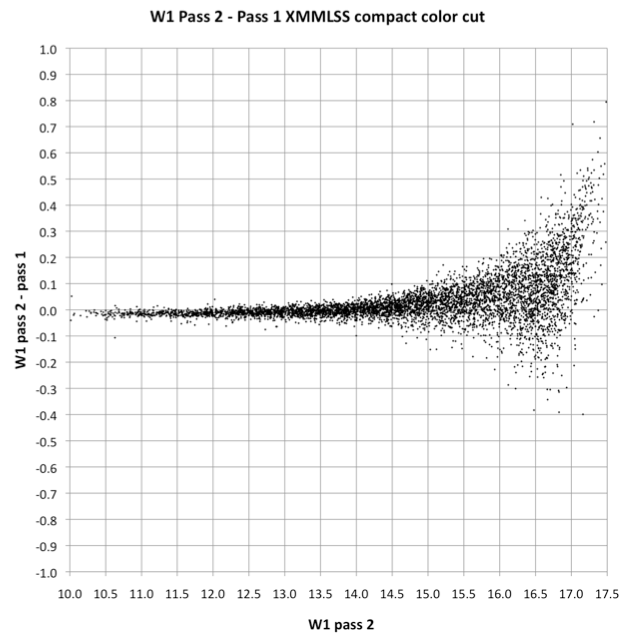 |
| Figure 7 - Comparison between WISE W1 profile-fit photometry between the All-Sky Release (pass-2) and Preliminary Release (pass-1) Source Catalogs for sources in the XMM south field. |
In the case of bright, saturated stars, the profile-fitting photometry algorithm is designed to produce a flux estimate using the unsaturated pixels around the periphery. Photometric biases are nevertheless apparent, especially in W2 and to a lesser extent, W1 and W3. Figure 8 illustrates this behavior using plots of Ks-WISE as a function of magnitude for all four WISE bands, from the results of Scan/Frame Pipeline processing.
 |
 |
 |
 |
| Figure 8 - Photometric bias in saturated regime, illustrated by 2MASS-WISE colors | |||
In W1, there is relatively little bias for about 4 magnitudes beyond saturation, after which the flux becomes systematically underestimated. For W2, however, a pronounced flux-over estimation bias starts ~0.5 mag after saturation (6.5 mag) and continues to the brightest magnitudes that are extracted. We have investigated these biases and have ruled out such effects as nonlinearity and errors in sky background estimation. We have, however, found that the PSF shape is flux-dependent in the saturated regime, and attribute the bright star flux biases to that effect. The reason for the flux-dependence of PSF shape and, in particular, why it should be so much more pronounced for W2, are not known.
The color-magnitude diagrams in Figure 8 can be used to estimate empirical corrections for the WISE saturated source photometry biases. Corrections for W1 and W2 in all phases of the WISE and NEOWISE surveys are presented in section II.1.c.iv.a of the NEOWISE Explanatory Supplement.
The WISE system photometric response was stable to <<1% over the life of the cryogenic survey (IV.4.h). Therefore, standard star calibrators provided the necessary information to anchor the zero point calibration. Residuals biases with respect to the mean brightness of the standard stars is <0.01 magnitudes in all bands. Additional information regarding uncertainties in the calibration measurements is discussed in IV.4.h.vii.
As discussed in Wright et al. (2010 AJ, 140, 1868), there is a clear discrepancy between red (typically sources with fν ~ ν-2) and blue (stars with fν ~ ν2) calibrators in W4, the 22µm band. This amounts to about 9% in the fluxes for W4, with the red sources appearing too bright in W4. It not clear if there is a similar W3 bias, and thus we recommend that no corrections are applied at this time.
Last update: 2019 July 15