
| Catalog Sources Associated with Nebulae | |
The WISE All-Sky Release Source Catalog contains detections of point-like objects, such as stars and unresolved galaxies, as well as resolved sources such as close multiple stars and galaxies, and detections of sections of large nearby galaxies and clumps or filaments in Galactic nebulosity, as long as they meet the Catalog selection criteria described in V.3. Because their emission peaks at longer wavelengths, fragments of large Galactic nebulae are most likely to appear as WISE W3- and W4-dominant sources. While such objects are real source of astrophyscial emission, they will not be well characterized and can often contaminate flux- and color-selection Catalog searches for compact sources. In this section, we offer suggestions on how to identify Catalog sources that may be nebula fragments.
Source extraction in the WISE processing pipelines was optimized for point-like and compact objects, and did not include a specific module for identifying and measuring extended objects. Consequently, resolved sources such as large galaxies, Galactic HII regions and nebulae, are not well-characterized in the Catalog. Efforts are made to help identify Catalog entries that are extended with respect to the WISE PSF with the Extended Source flag (ext_flg). This flag is based on positional associations with 2MASS Extended Source Catalog (which for all intensive purposes is a galaxy catalog), and a the goodness-of-fit to a single WISE PSF. However, this flag does not always effectively identify sources that are associated with Galatic nebulosity.
WISE source measurements include a number of parameters that may be used to identify and eliminate pieces or fragments of bright nebula. Foremost, the profile-fitting goodness-of-fit is measured through the reduced chi2 (w?rchi2). Large chi2 values indicate a poor fit to a single PSF. Applying a tight threshold, such as w?rchi2 > 3, to identify extended sources is the first line of defense. The second is the aforementioned Extended Source Flag. These two methods are slightly redundant because the Extended Source Flag also tests the chi2 value. Finally, curve-of-growth analysis may be the most effective, but also the most labor intensive method to identify fragments of nebulae in the Catalog.
Fig. 1 shows the field as seen by WISE channels 1, 2 and 3. The field is dominated by Galactic stars (most evident in W1 and W2) and bright ISM nebulosity (W3 and W4). We will use the center of the field to extract stars and calibrate the curve of growth signature for point-like objects. We then compare with sources located against the bright nebula in the lower right hand corner (Fig 1b). The nebula has induced an overdensity of sources extracted by WISE (Fig 1c), some of which are stars superimposed against the nebula, some are YSO's associated with nebula, and (most) are fragments of the nebula. The fragments are dominated by W3 extractions (blue circles in Fig 1c). In the following analysis we will concentrate on W3.
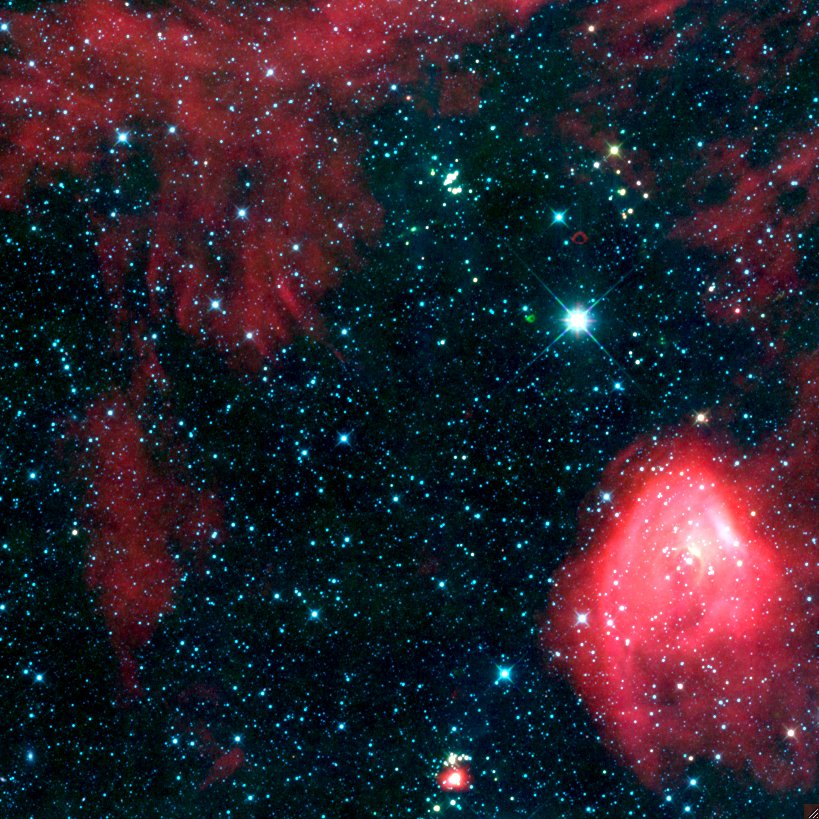
Fig. 1a -- FOV is 0.78 deg, centered on 85.78716, -9.086667 J2000 (galactic 213.4398 -19.2696 deg). blue == W1, green == W2, red == W3. |

Fig. 1b -- Zooming in to the bright nebula at 5h41m27.12s -9d26m26.4s J2000. |
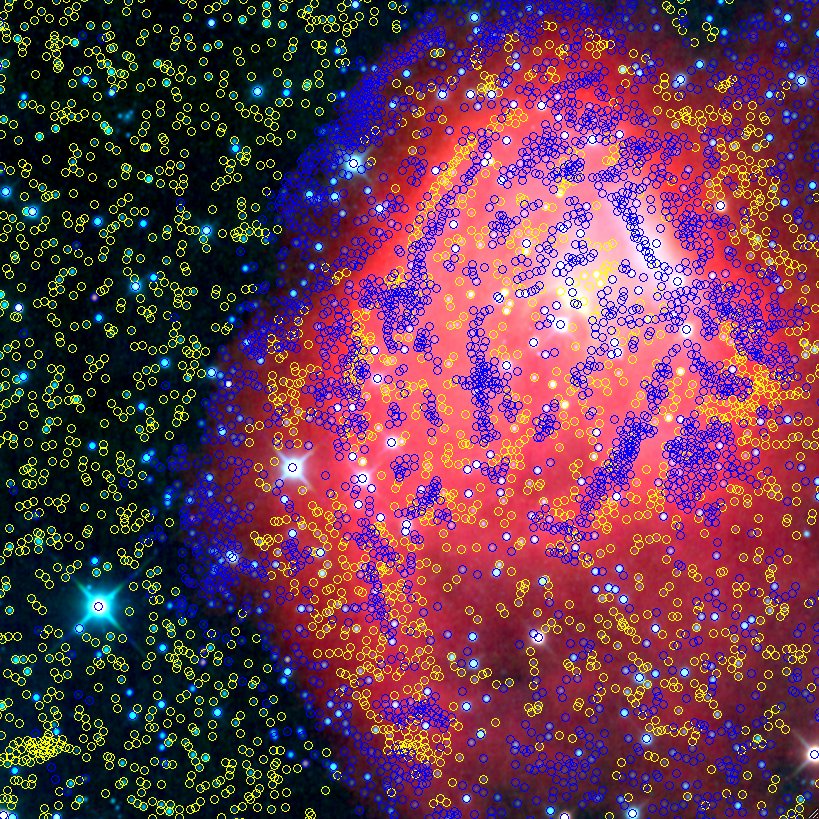
Fig. 1c -- Yellow circles demark WISE source extraction; blue sources demark W3 extractions. Note W3 sources lie on bright nebulae ridges. |
The bright nebula is most apparent in the WISE W3 (12 micron) channel, as seen in Fig 2. Sources extracted along bright ridges (Fig 2b) are poorly characterized by the WISE photometric pipeline because they are assumed to be point sources. There are of course real, compact sources, some of which are YSO's. But for the most part, the extractions in this region are fragments of the nebula. The key is to identify sources that do not follow the curve-of-growth expected for point sources. As we will show below, there is a way to identify fragmented nebular sources and remove them accordingly. Fig 2c shows the result after applying such a curve-of-growth analysis: the magenta circles are sources that were identified as having point-like growth. Inspection of the image reveals that indeed the magenta sources look much cleaner and are point-lik source extractions.
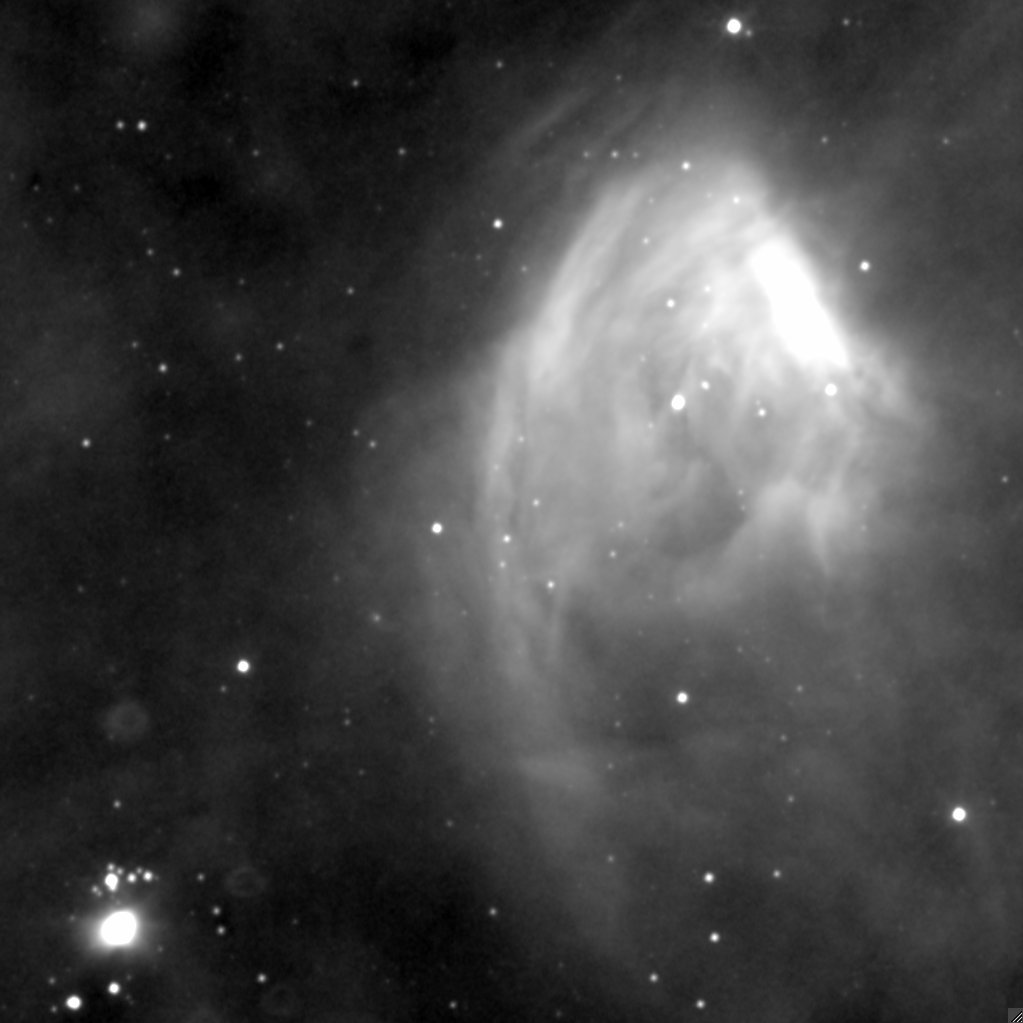
Fig 2a -- W3 view of the bright nebula at 5h41m27.12s -9d26m26.4s J2000. |

Fig 2b -- W3 source extractions. Note W3 sources lie on bright nebulae ridges. |
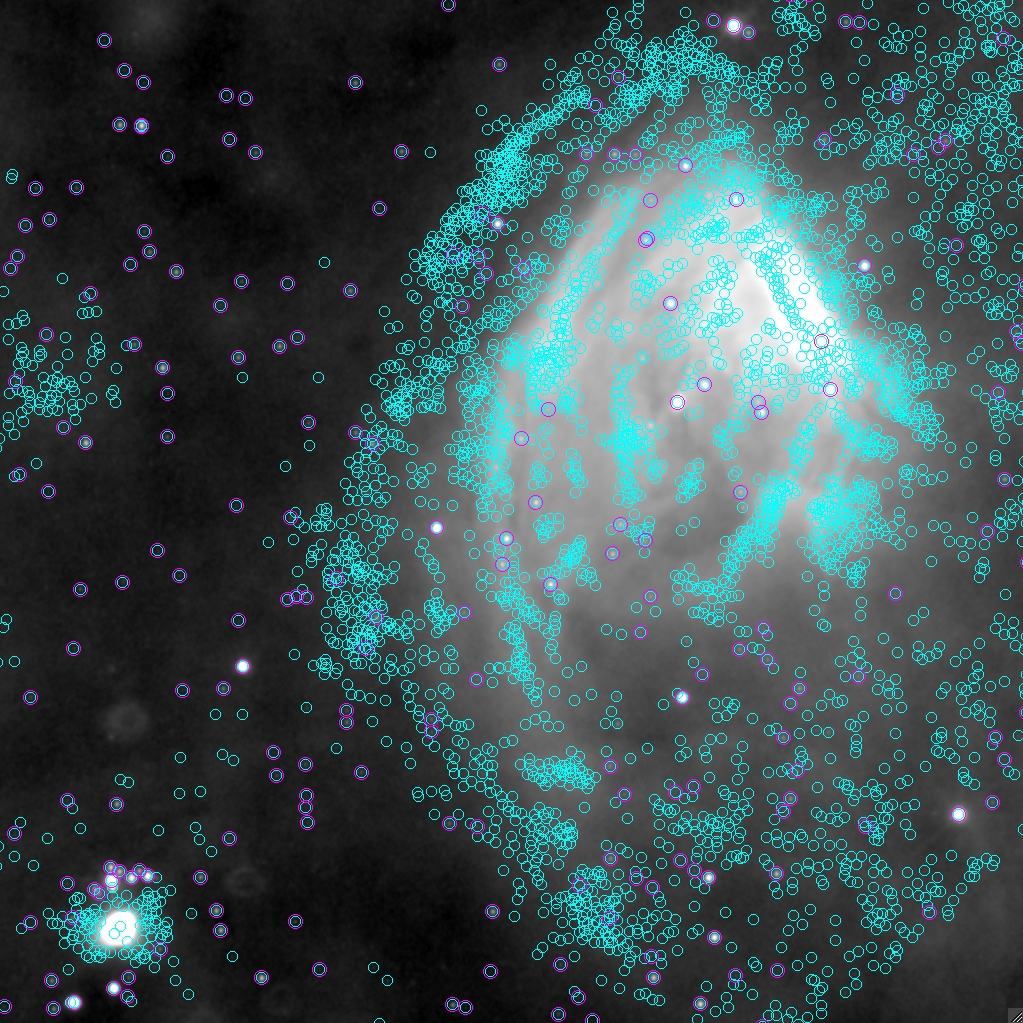
Fig 2c -- W3 view of the nebula centered on 85.78716, -9.086667 J2000. W3 source extractions: cyan the standard extraction, and magenta after cleaning "extended" sources that have discrepant W3 curve of growth. See Fig. 5 for the full region view results. |
| W1 | W2 | W3 | W4 |
|---|---|---|---|
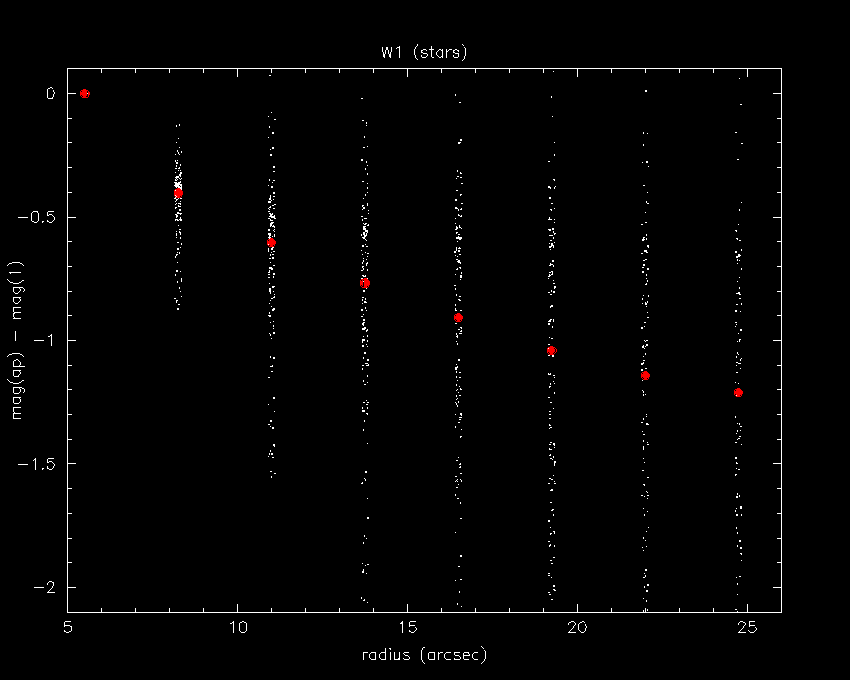
Fig 3a -- W1 curve of growth for sources located within the center of the field, and are presumably dominated by stars (i.e., point sources). The red points denote the median value. |
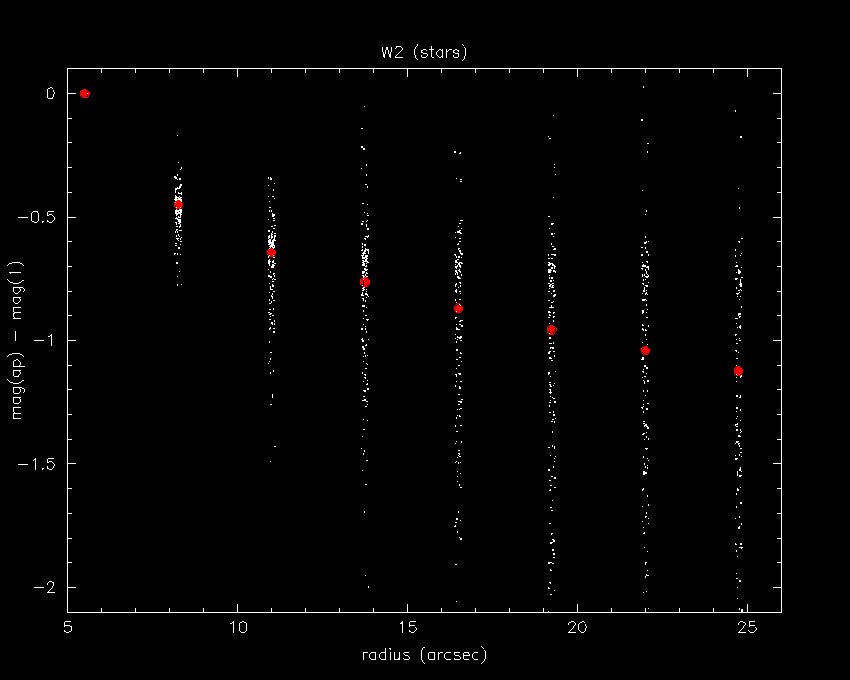
Fig 3b -- W2 curve of growth for sources located within the center of the field. The red points denote the median value. |
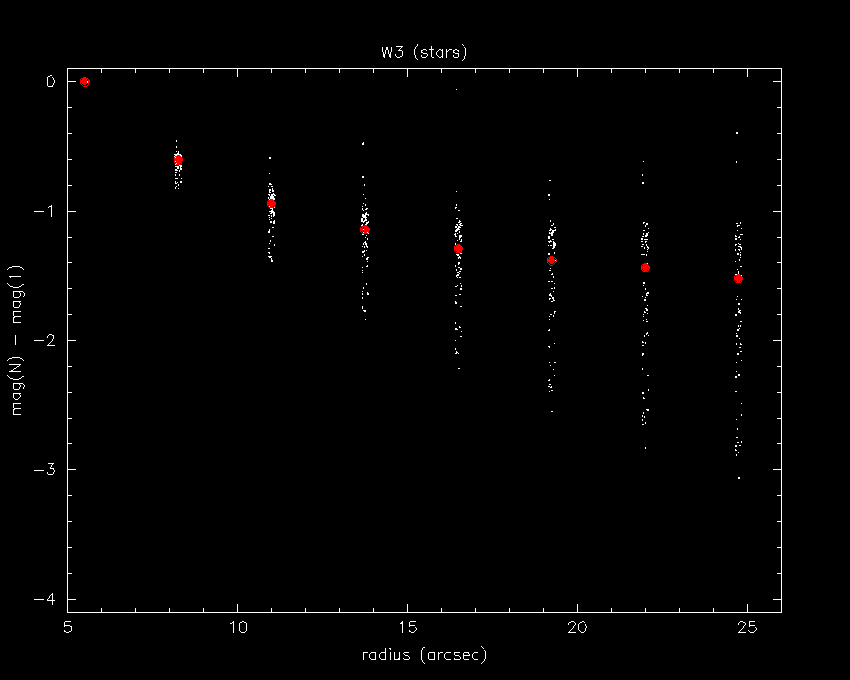
Fig 3c -- W3 curve of growth for sources located within the center of the field. The red points denote the median value. |
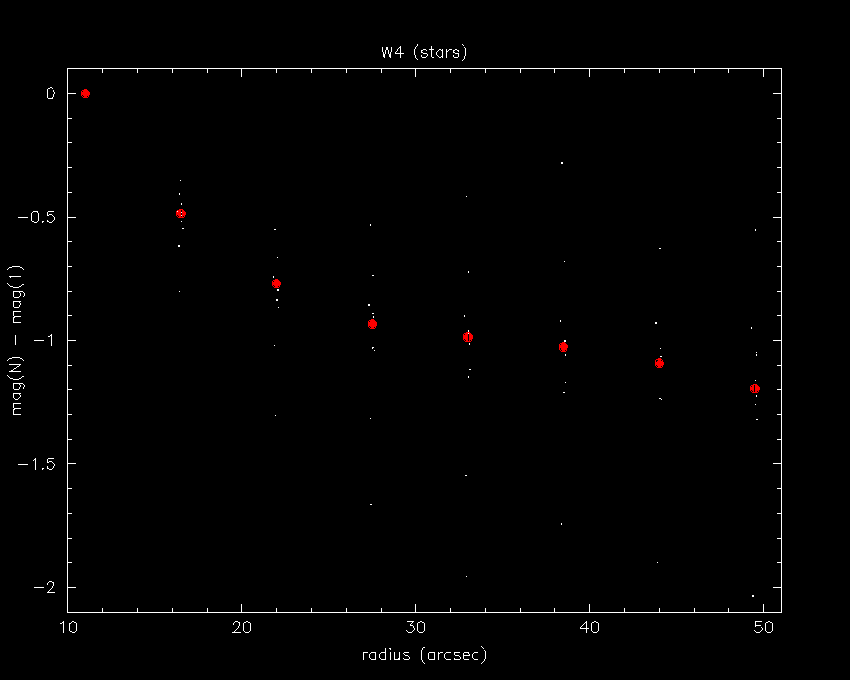
Fig 3d -- W4 curve of growth for sources located within the center of the field. The red points denote the median value. |
Figure 4a shows the same curve-of-growth analysis for all sources that are in close proximity to the bright nebula (the cyan sources in Figure 2). Most of these sources are extended fragements of the nebula and should behave differently from the field stars. The red filled points are the median values for the "nebula" sources and the white points are for the field stars. Again, W1 and W2 have erratic behavior due to aperture contamination, but there is still a clear difference between the two data sets. This is most apparent in the long wavelength W3 and W4 bands: the nebula sources have much more 'aggressive' growth -- they are extended well beyond the PSF wings (white points).
| W1 | W2 | W3 | W4 |
|---|---|---|---|
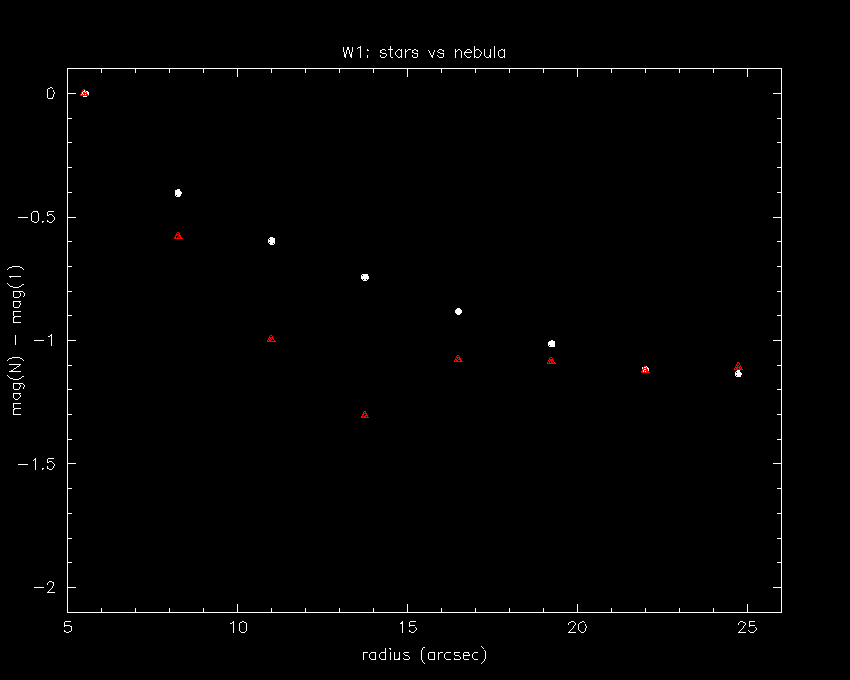
Fig 4a -- W1 mean growth curves for stars (white points) and for sources associated with nebulae (red points). |
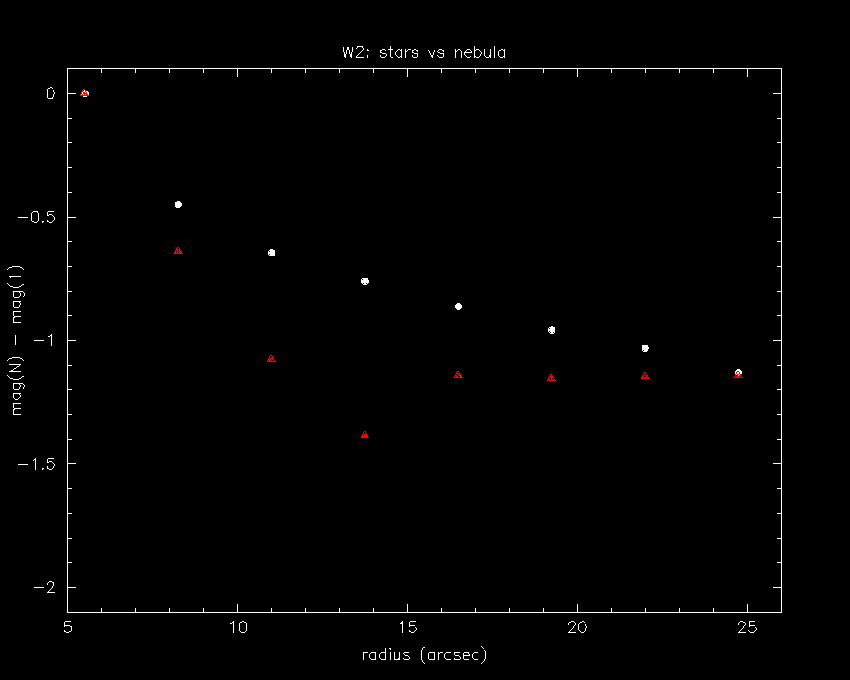
Fig 4b -- W2 |
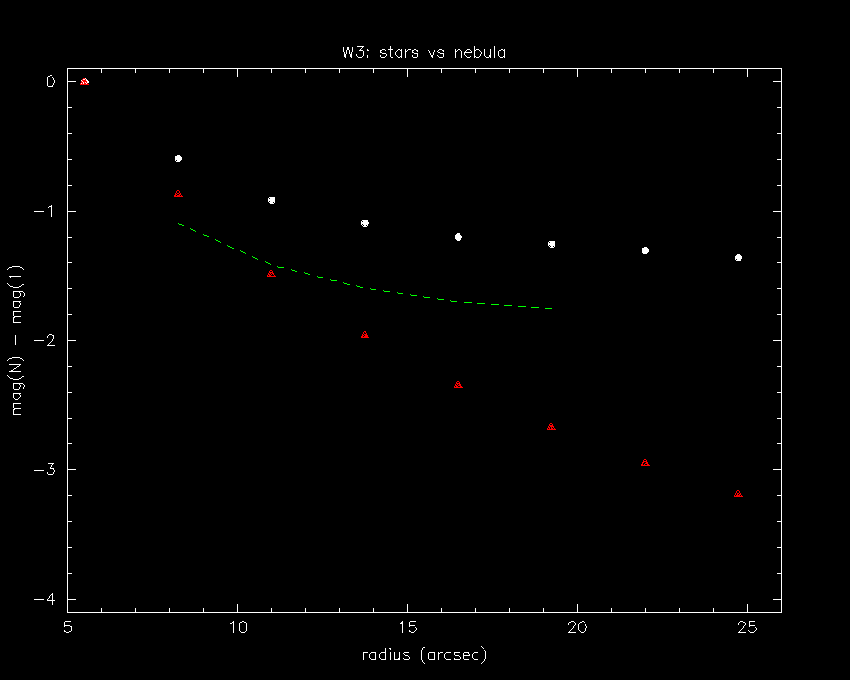
Fig 4c -- W3; the green dashed line represents the adopted threshold for 'extended' sources; see below. |
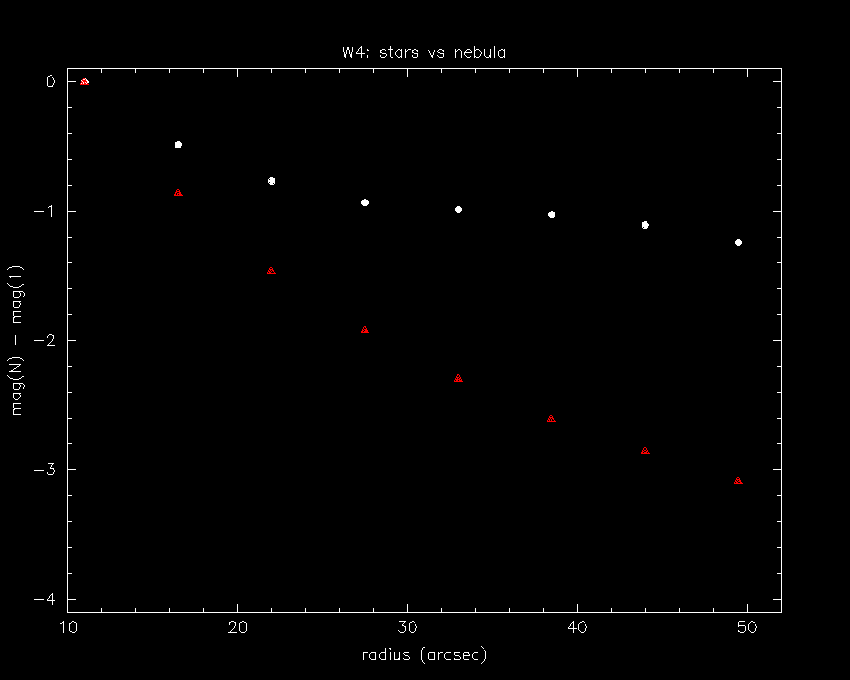
Fig 4d -- W4 |
We now propose a simple presciption for identifying extended sources associated with nebulosity. We use the W3 stellar growth curve (white points, Fig 4c) to define a threshold:
where DM is the mean [mag(N) - mag(1)] difference for point sources (white points, Fig 4c), and delta_mag is the actual difference [mag(N) - mag(1)] for the source in question. The "-0.5" term is needed to account for the scatter in the CoG relation (Fig 3), but clearly different values may be used to apply a more or less aggressive test threshold.
We apply this test to each aperture, from N = 2 to 6. (see Fig 4c). Note that we do not use the largest apertures (i.e., 7 to 8) because they are more unstable and susceptible to contamination. So we only test apertures 2 to 6, counting the number that fail the test (ie. fall outside the threshold, implying growth that is well beyond a point source). If the number of aperture failures matches or exceeds 2, then we mark the source as extended.
The final results for the field are shown in Figs. 2 and 5, where the former is a zoom of the nebula region, and the latter is the full field. The magneta circles denote extractions that survive the CoG tests; ie., they are the most point-like W3 sources. Of the original 20,274 sources (see cyan sources in Fig 5, below), only 1240 (6% of total) survive the W3 CoG test. Careful inspection of these results clearly suggests that applying a W3 CoG test is a very effective (reliable) method for identifying spurious and extended (ie. poorly characterized) sources. There will, of course, be legitimate sources that fail the test, perhaps due to nearby source contamination or complexity of the source (multiple source, bright backgrounds in close proximity, etc). There is always a tradeoff with completeness and reliability.
An important caveat to this is that the Curve-of-growth signature for a point source may change from field to field slightly because the number and orientation of the single-exposures that are combined during the coaddition and extractions process varies around the sky. Therefore, it may require local calibration of the Curve-of-growth relation for the specific field in question.
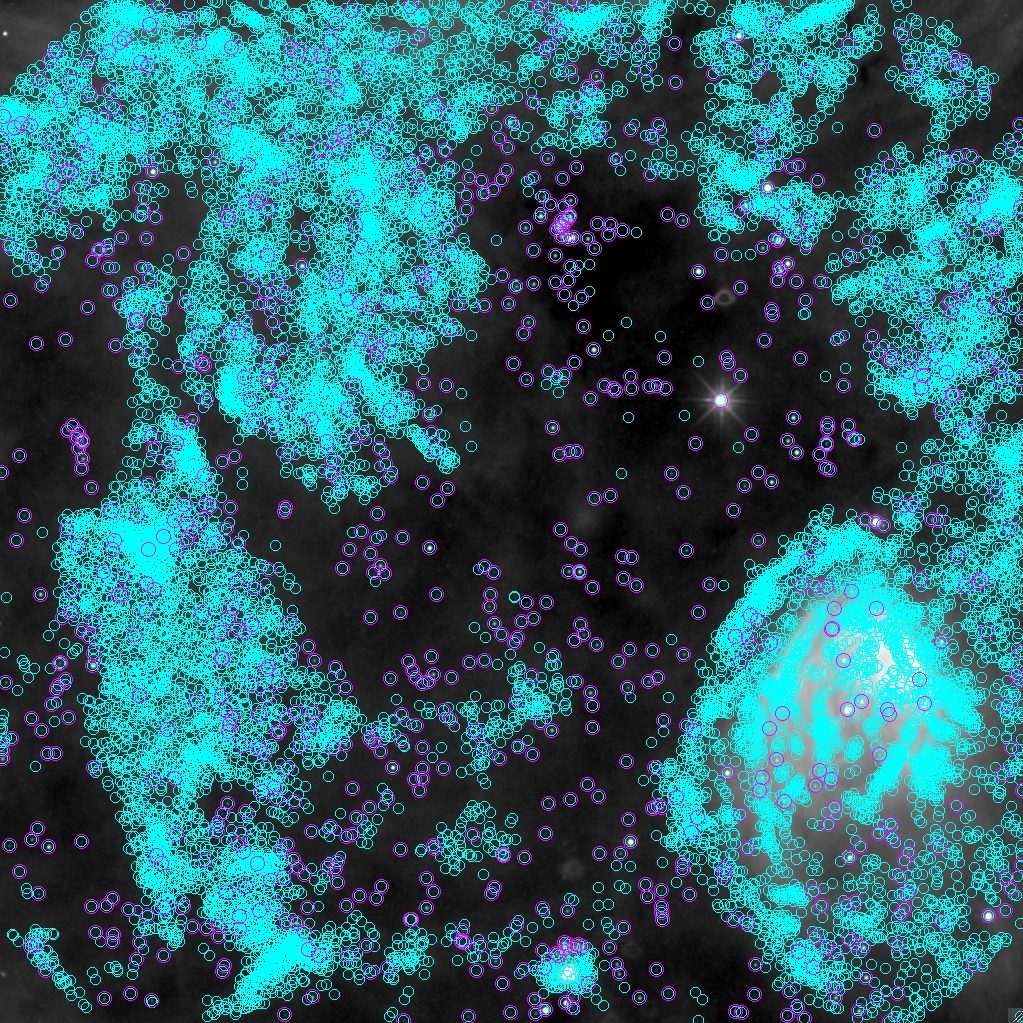
Fig 5 -- W3 view of the region. W3 source extractions: cyan the standard extraction, and magenta after cleaning "extended" sources that have discrepant W3 curve of growth. For a zoom of the bright nebula in the lower right side of image, see Fig 2d. |