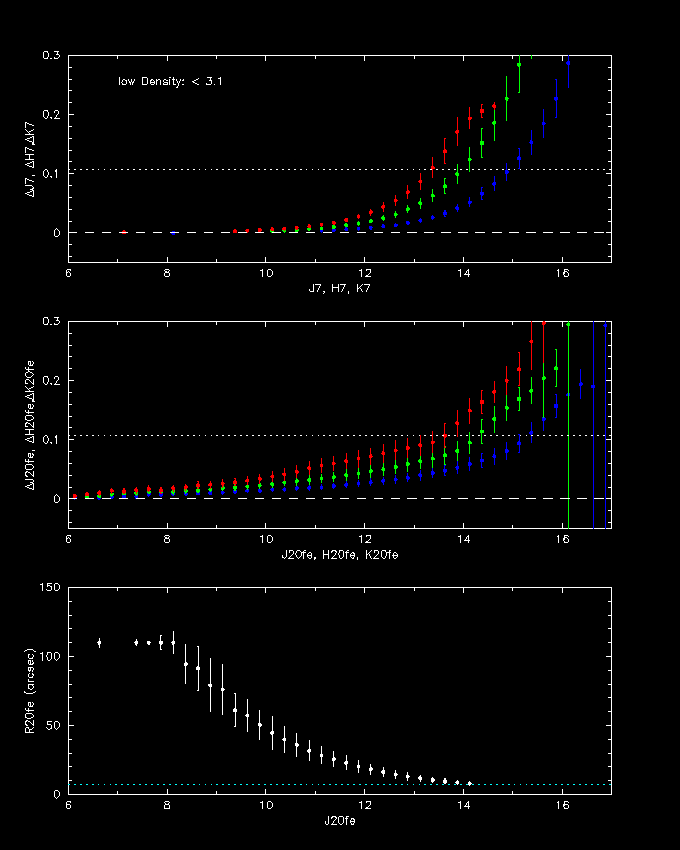
Low Density Fields

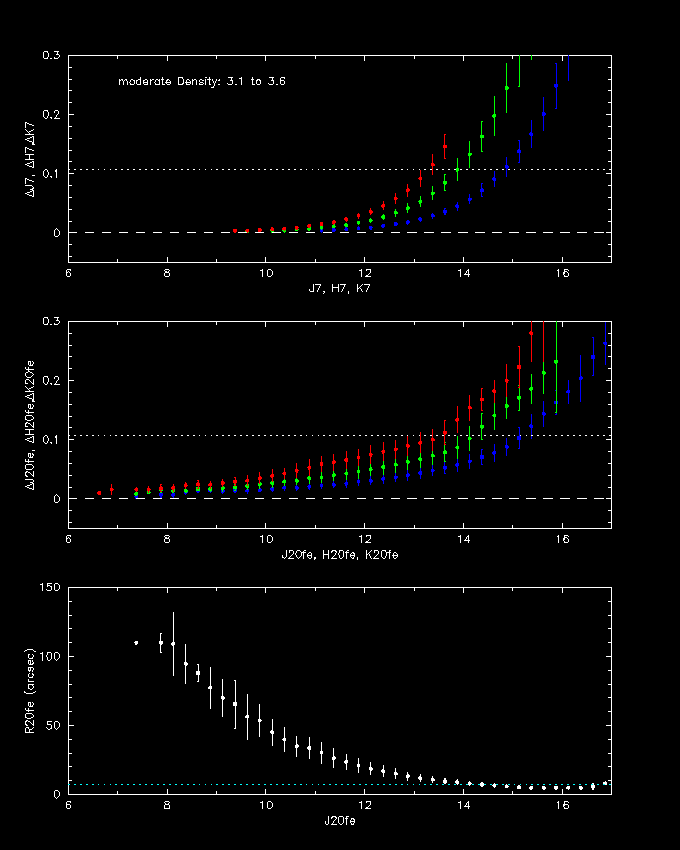
Moderate Density Fields

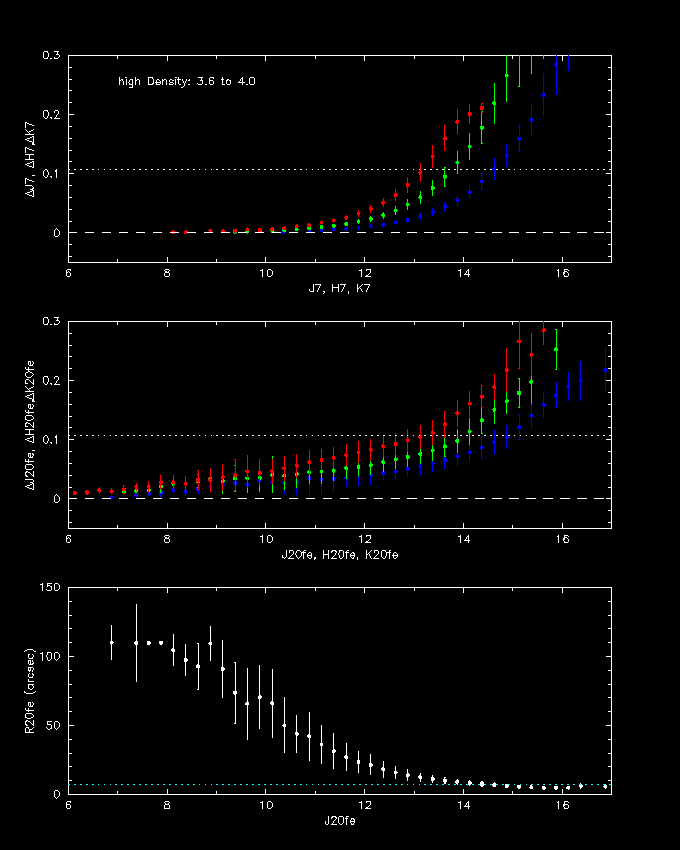
High Density Fields

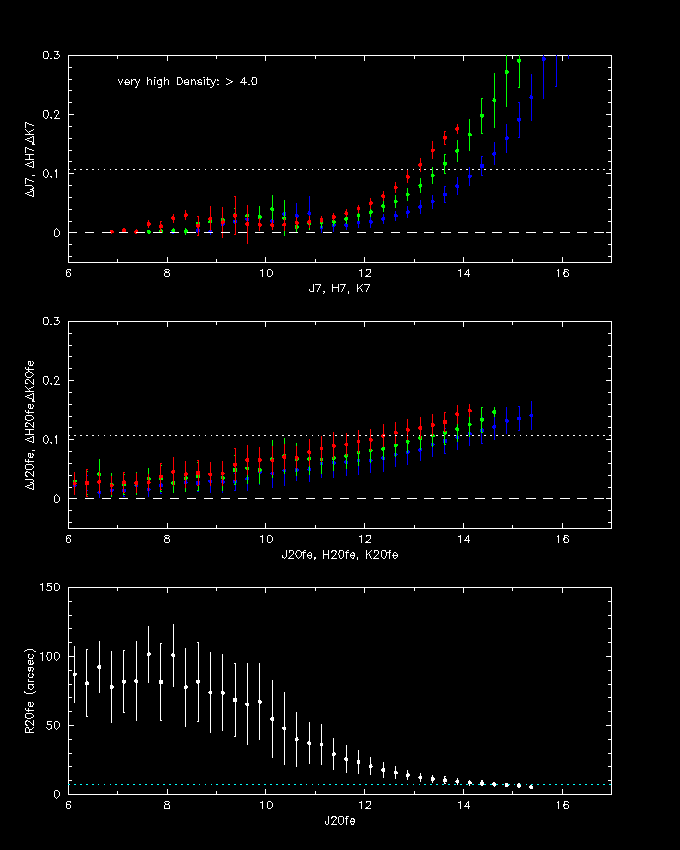
Very High Density Fields
Extended sources are archived within the Survey Extende Source Database, containing 2,590,500 sources. The reliability and photometric sensitivity of this database is summarized below.
i. Summary of Confusion Flag, Visual classification, & Reliability Scores
The "confusion flag",
cc_flg,
indicates whether a source is identified as as artifact, associated with an artifact, associated with a large galaxy
or is part of the Large Galaxy Atlas.
The visual classification flag,
vc,
indicates if a source has been visually inspected
to verify its morphology (e.g., extended, point-like, ... etc).
The reliability flag,
rel,
is a probability score that indicates the confidence level that the source is truly extended.
It is derived using a probabilistic
method that employs the visual inspection "truth" table.
ii. Photometric Sensitivity and Size Distribution
The following plots show the integrated flux in two apertures
(fixed circular 7" radius, and the K-band fiducial 20 mag/arcsec^2
isophotal) compared to the estimated flux uncertainty,
and compared to the isophotal radius (R20fe). As usual, J is
indicated with blue-colored points, H with green and
Ks with red. The results are divided by the stellar source
density: low density ( < 3.1), moderate density (3.1 < density < 3.6),
high density (3.6 < density < 4.0), and very high density ( > 4.0).
Note: The completeness of the extended source database can
be deduced from the repeatibility of source detection, which
is discussed in
Merging Extended Source Repeated Observations; see in particular
this plot.
cc_flg summary:
number of sources cc_flg value comment
2530813 0 nominal
57848 A artifact
1131 z large galaxy "chaff"
0 Z Large Galaxy Atlas
708 X associated with large galaxy
vc summary:
number of sources vc value comment
56841 -2 nature unknown
1949066 -1 no classification
526745 1 galaxy or Galactic fuzzy
57848 2 point-like or multiple star
"rel" summary:
number of sources vc value comment
2220396 A 90 to 100% reliability
153730 B 80 to 90% reliability
25145 C 70 to 80% reliability
43756 D 50 to 70% reliability
69897 E 20 to 50% reliability
77576 F 0.0 to 20% reliability
 Low Density Fields |
 Moderate Density Fields |
 High Density Fields |
 Very High Density Fields |
iii. Color-Color Results
Animated gif figures showing J-K color
versus mag and J-H color. The data is separated
by the reliability score ("A" to "F").
Comments about plot:
The "B" group is characterized by lower (relative to "A") S/N
colors, producing a spread in color about the redshift track.
The color-mag plot shows three groupings: the faintest galaxies
resolved by 2MASS (K ~ 14.5 mag), faint galaxies (K ~ 14th mag),
and a group with K ~ 13th mag. The latter is probably dominated
by point-like galaxies (i.e., bright, but not very extended).
The reliability appears to be good (the blue locus is probably
a mixture of stars and galaxies).
Group "C" is dominated by faint but "blue" galaxies (they are blue with
respect to typical faint cosmic-reddened galaxies), perhaps associated
with nearby galaxy clusters with blue compact galaxies. A few of these
sources may be Galactic stars (since the reliability is dropping fast in this group).
Groups "D" and "E" show sources with K fainter than 13.5 mag (S/N < 7),
with a distribution that appears a mixture of Galactic ("main sequence" track)
and distant galaxies. The reliability is clearly lower for these groups.
Group "F" (not shown) are either artifacts (bogus sources) or Galactic stars.
[Last Updated: 2004 Oct 4; by Tom Jarrett]

Color vs. Mag, Color vs. Color for all data

Color vs. Mag, Color vs. Color for |glat| > 30 degrees
The "A" group looks nominal, with a clear locus of points
following the expected redshift track ("k-correction").
The galaxies are dominated by normal galaxies with
J-Ks = 1.0 mag. The redward tail is dominated by
faint, cosmic-reddened galaxies, and also includes
intrinsically red galaxies (AGN, Seyferts, starbursts, ... etc).
The reliability appears excellent.
Previous page. Next page.
Return to Explanatory Supplement TOC Page.