T. Jarrett, IPAC
(980501)
Several nights of 2MASS data have been specifically designated as RTB data sets (to be used to debug and check different versions of the 2MAPPS pipeline reduction).
The extended source results (GALWORKS output) for 980114n has been fully analyzed to gauge the performance of GALWORKS on a much larger scale than previously attempted. The plots and tables given below summarize the results. For a summary of other RTB nights, see Summary of GALWORKS Results for RTB 971205n -- low source density fields -- and Summary of GALWORKS Results for RTB 971110n -- low source density fields -- and Summary of GALWORKS Results for RTB 970125n -- low source density fields -- .
The 980114n data set includes >70 full 6 degree science scans. Unfortunately, all of the scans >062 (which includes VIRGO!!) failed quaility due to poor photometric conditions. This leaves about 32 scans with calibrated results. Eight of the 32 are from low stellar density regions (<10**3.0 stars/deg^2, K < 14), while the remaining 24 scans are from relatively high source density (3.3 to 3.6 in the log) corresponding to glat=2 to 3 degrees toward the anticenter. Only the scans subject to high stellar source density are discussed here.
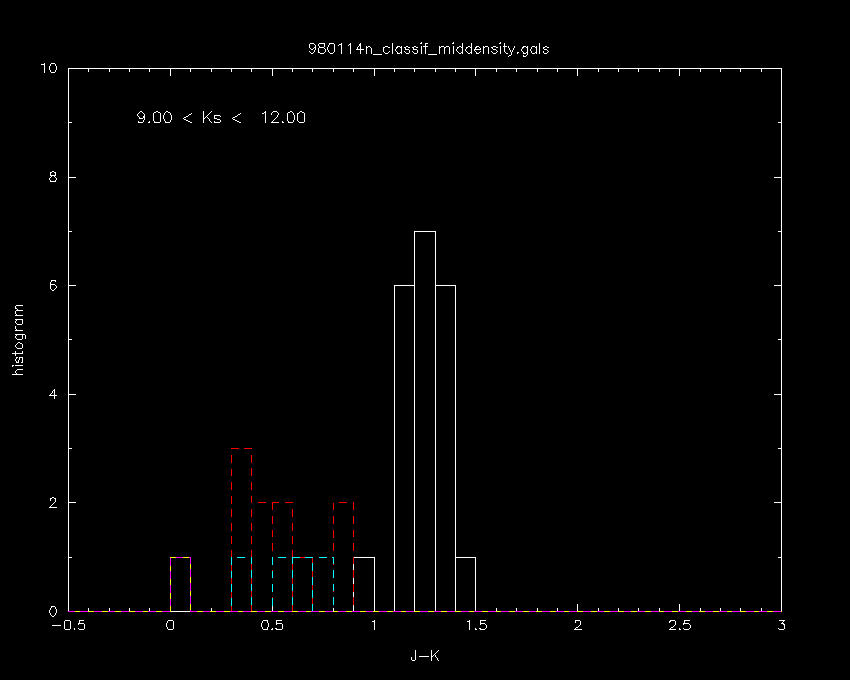
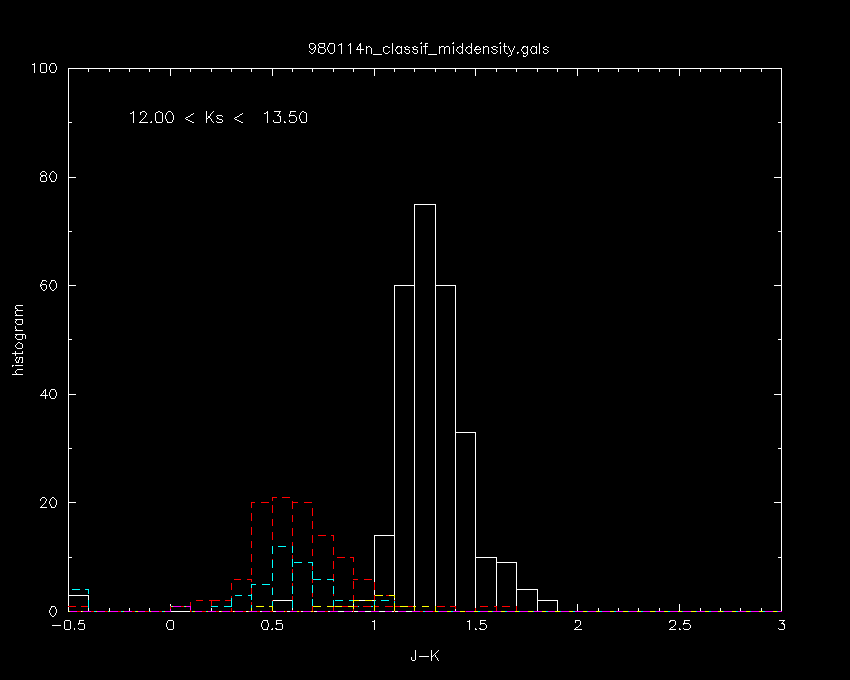
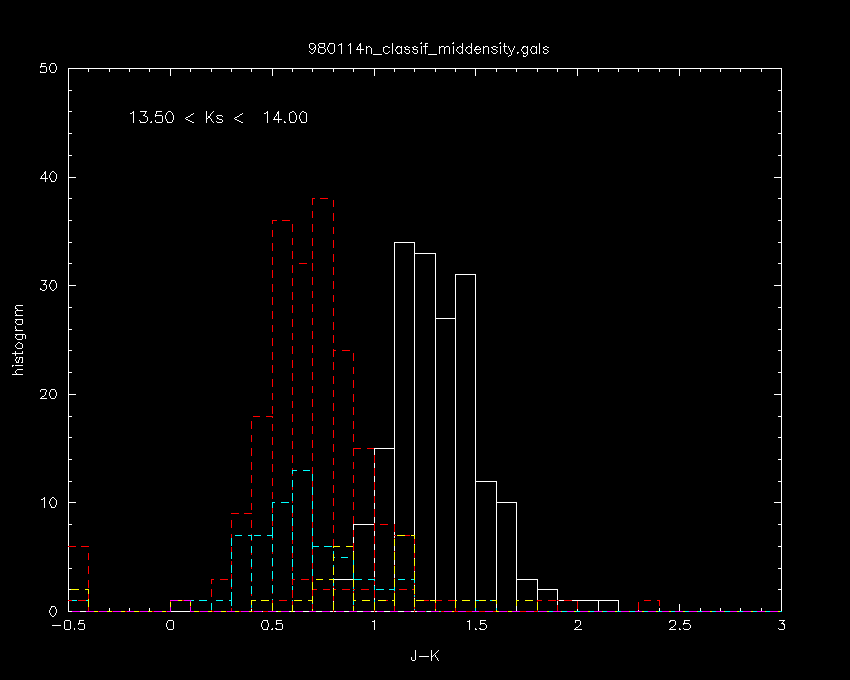
Each source deemed "extended" by GALWORKS was carefully examined by 'eye' using tools developed by Jarrett. Nearly 1500 sources were part of the 980114n extended source output (from mid/high density scans). Each source was 'classified' by viewing the J,H and K postage stamp images, as well as the corresponding DSS (optical) stamp images and the '3-color' image generated from the JH&K images (the latter is quite powerful since it helps the user see "color" as well as increase the snr for the low surface brightness "fuzz" around galaxies). Sources were classified into the following catagories:
GALWORKS is 'tuned' to optimize galaxy completeness at the
expense of reliability. The minimum acceptible reliability
chosen to optimize completeness is about 60 to 80% (for high
source density). That is to say,
we tolerate a 20-40% contamination of false galaxies
to our extended source database in order to be >90% complete
in galaxy detection/extraction.
We will, however, apply various methods to weed out the false sources
(which, as will be shown below, are double stars and artifacts,
like meteor streaks). These methods will be applied in
a 'post-processing" phase; they include application of
decision trees,
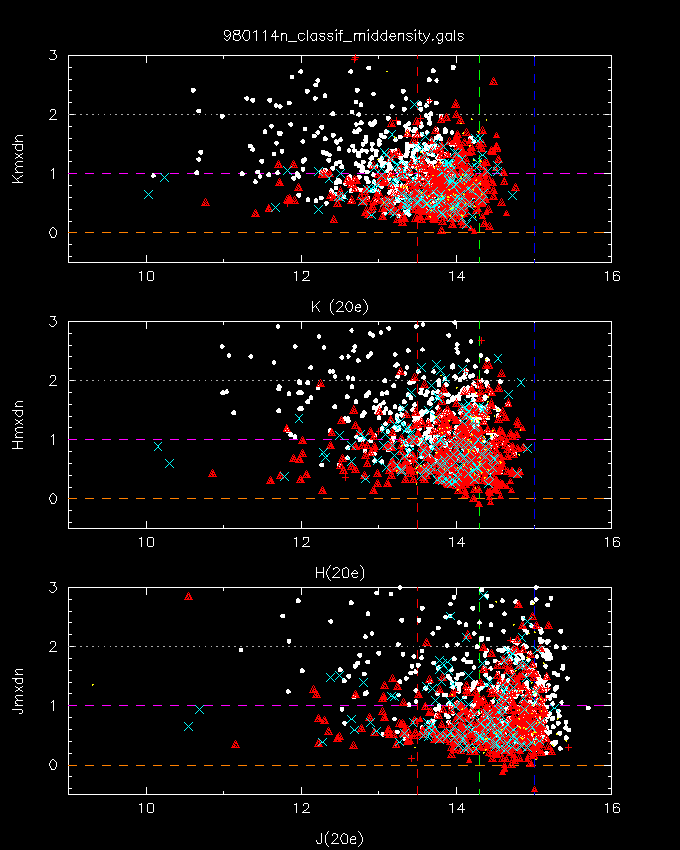
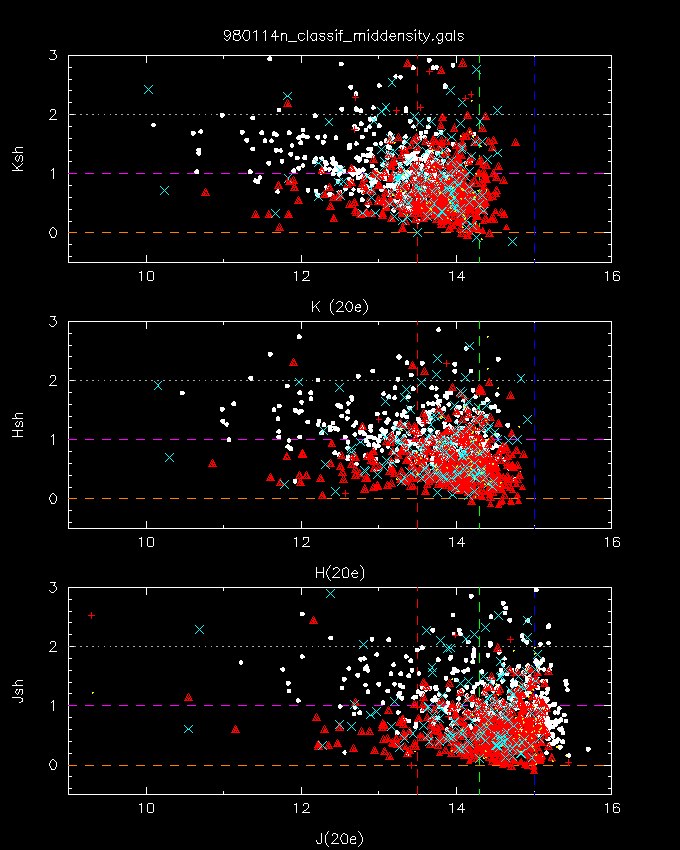
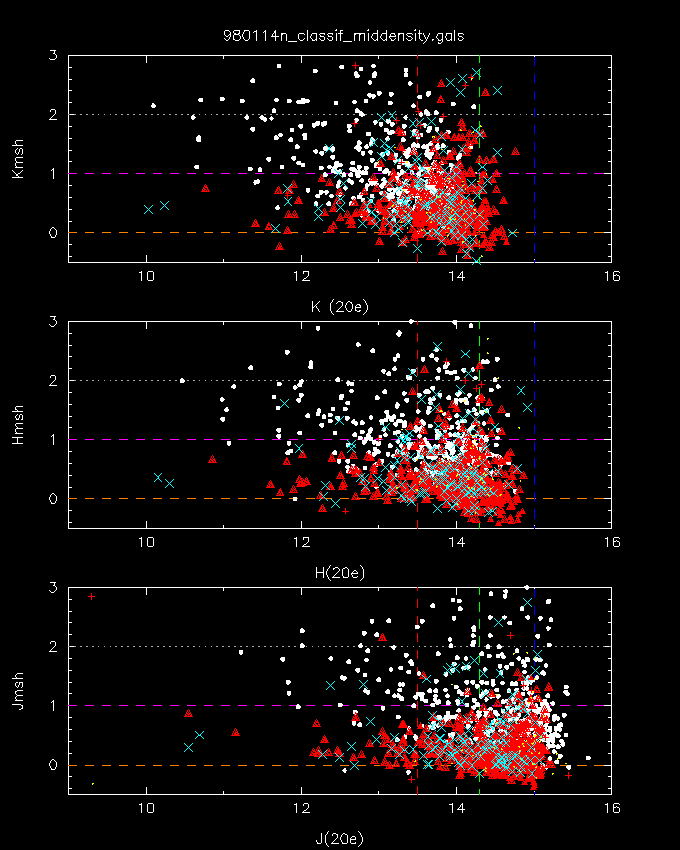
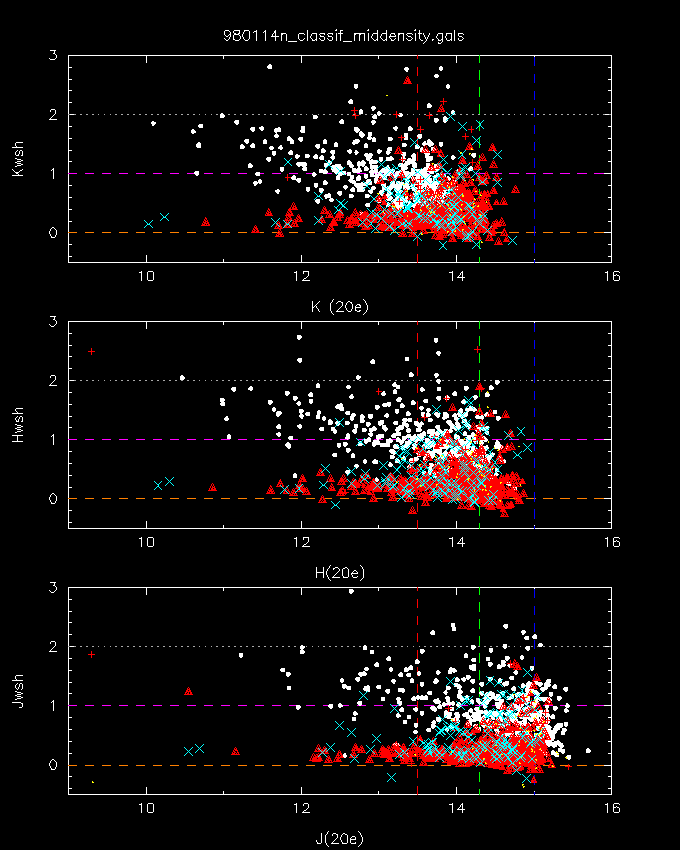
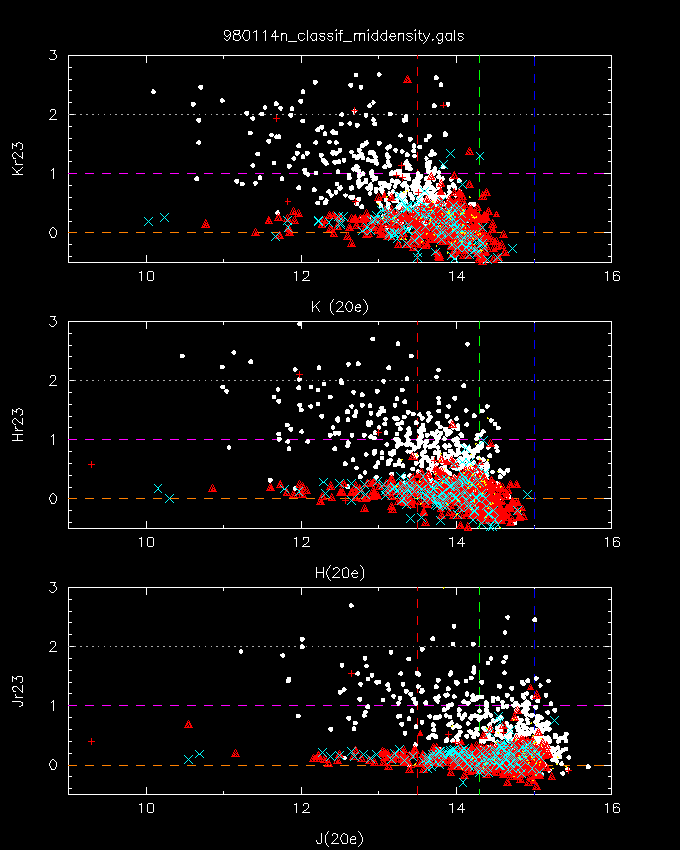
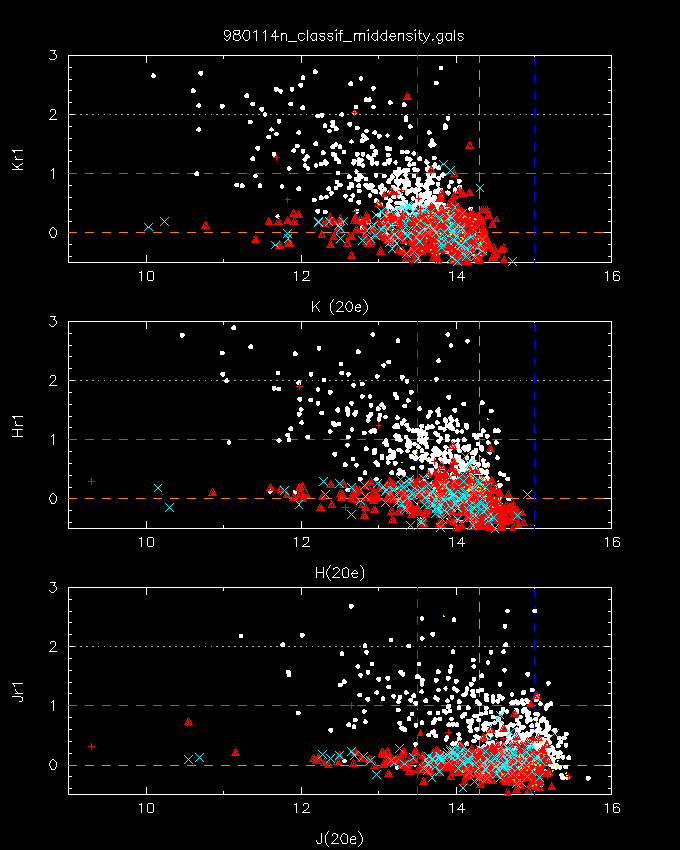
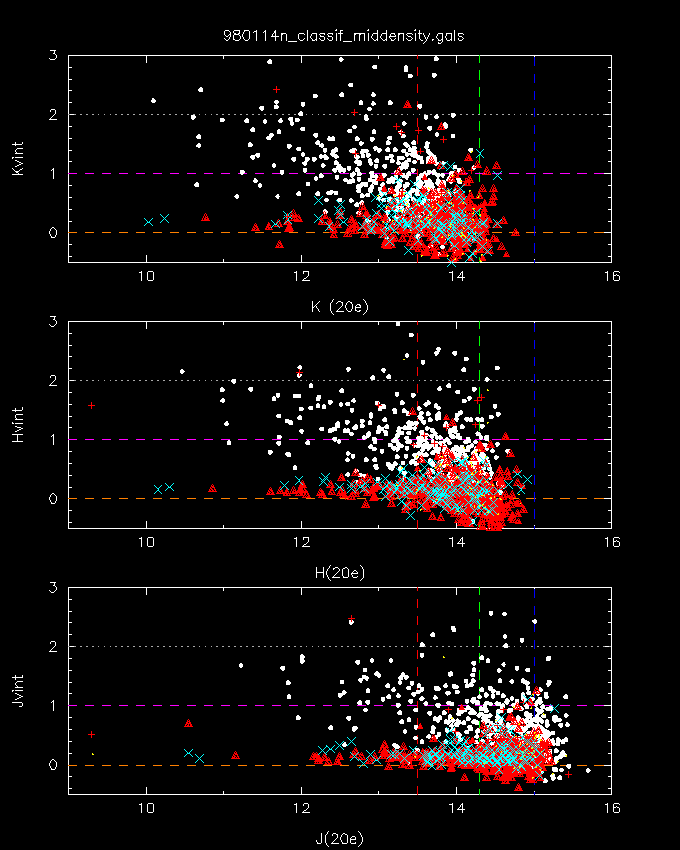
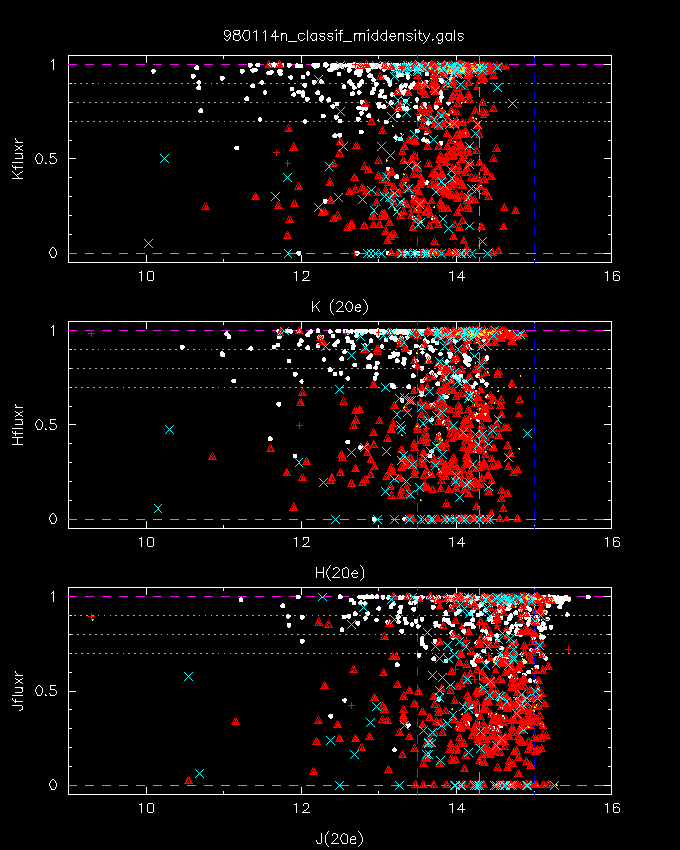
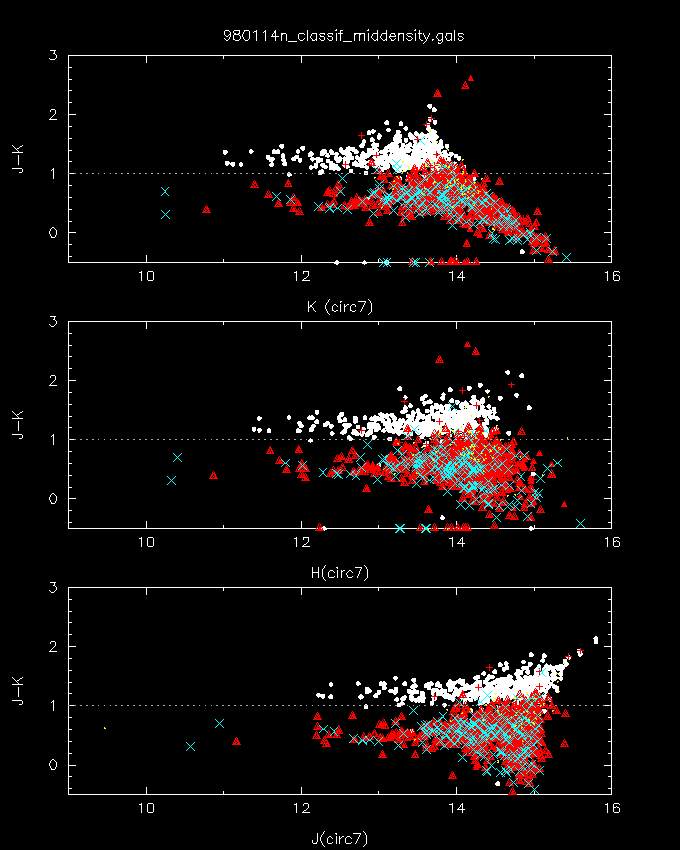
Star - Galaxy Discrimination Parameters
Notes:
galaxies == filled white circles
stars == small red triangles
doubles == large red triangles
triples == blue crosses
artifacts == red crosses
unknowns == yellow dots
Extended Source Colors
Notes: colors computed using fixed circular radius=7" apertures; galaxies are denoted by the white filled circles; double stars by the red triangles; mean colors are represented K-corrections for spirals are represented by the magenta line and triangle points -- each point is 0.1 in redshift -- and ellipticals by the grey line and square points; the main sequence (dwarf and giant branches) are shown in green.
Yellow dotted lines represent "redshift" zones; they are roughly parallel to the "giant" star branch, and roughly perpendicular to the K-correction track.
The blue dashed line represents a color-color criterion (color break) between galaxies and false sources (double stars mostly). TChester has investigated this line in more depth by looking at the point sources in the database. See Distinguishing Galaxies from Point Sources Using Point Source Color-Color Plots .