


Unlike earlier WISE data processing, AllWISE processing on the stack on individual frames includes an additional parameter in the profile-fitting photometry step that minimizes χ2 for positions across time in addition to the usual χ2 minimization to determine band-by-band photometry. As a result, motions are measured for all sources, giving researchers a powerful new tool with which to study and/or identify nearby stars and brown dwarfs. This section characterizes these new motion measurements. Further details can be found in Kirkpatrick et al. (2014).
The AllWISE time baseline is typically between six months and a year for any point on the sky. Except for ecliptic polar regions, the time sampling will be confined to discrete epochs separated by roughly six months. Multiple measurements, spanning a range of a few days, are taken at each epoch. Although most of the non-polar sky has only two discrete epochs covering six months, ~15% of the sky has three epochs spanning a time range of one year.
It is important to understand what this time sampling means for motion measurements. In general, it is the closest objects to the Sun that exhibit the largest proper motions. Being close, these objects will also exhibit substantial parallax. Because data are taken near 90 degrees solar elongation, WISE observed these objects at their maximum parallax factors. As an example, an object seen at two epochs in AllWISE will have motion that is a combination of half its yearly proper motion (because the two epochs are only separated by six months) and twice its parallax (because the vantage point between epochs has shifted by 2 AU). AllWISE thus measures motion on the sky as opposed to proper motion because parallax and proper motion cannot be disentangled.
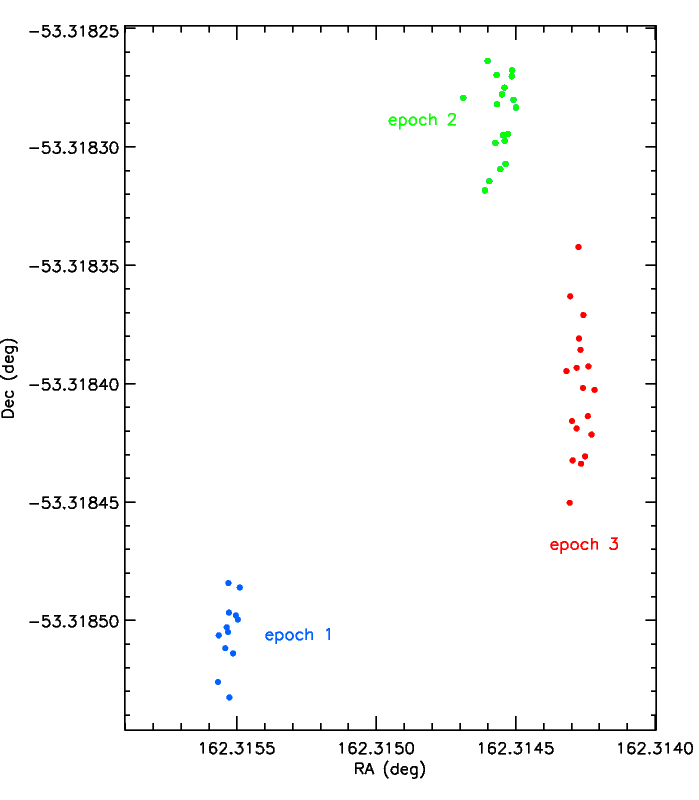
Figure 1 shows the individual Level 1b frame measurements of the position of the nearby L+T dwarf binary WISE J104915.57-531906.1. This source has three epochs of coverage in AllWISE, but the motion is not linear since this binary's parallax (0.50 arcsec) and proper motion (2.78 arcsec/yr) are comparable (Luhman 2013) in size. It would be possible to measure the proper motion by using only the epoch 1 and epoch 3 points, since these clusters of points were taken at the same parallax factor; however, AllWISE uses data from all three epochs and thus will measure a motion that is not the actual "proper" motion. The extreme M subdwarf LHS 161 in Figure 2 demonstrates a case at the opposite extreme, where the parallax (0.025 arcsec) is swamped by a much larger proper motion (1.412 arcsec/yr). As expected for this case, the three separate epochs of data more closely follow a linear progression in time.
 |
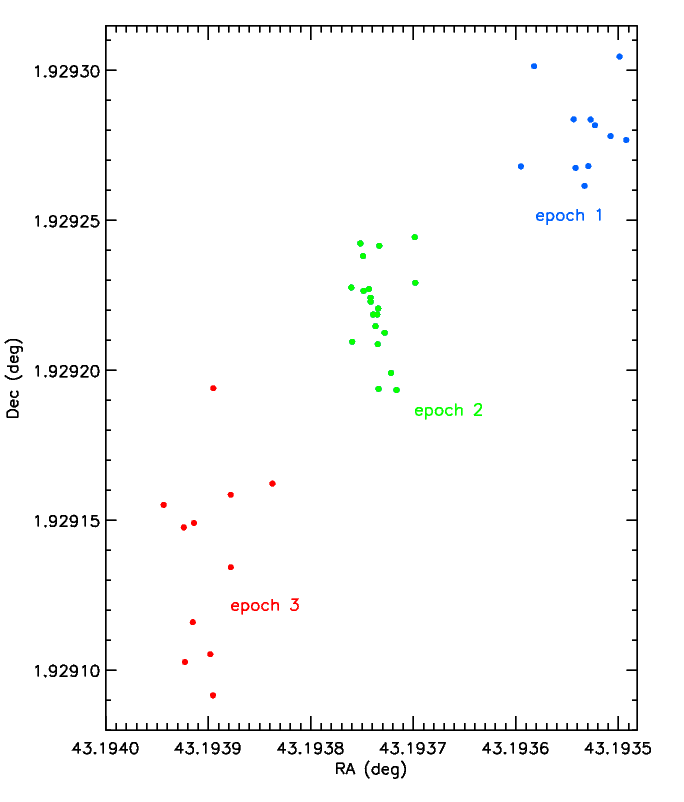 |
| Figure 1 - Astrometry measured from the individual Level 1b frames for the nearby L+T dwarf binary WISE J104915.57-531906.1. The three clusters of points labeled "epoch 1", "epoch 2", and "epoch 3" represent the data separated by six-month intervals. | Figure 2 - Astrometry measured from the individual Level 1b frames for the esdM2 star LHS 161. The three clusters of points labeled "epoch 1", "epoch 2", and "epoch 3" represent the data separated by six-month intervals. |
We can further demonstrate this with a couple of examples drawn from areas with two-epoch coverage, which represents the vast majority of AllWISE data. Figures 3 and 4 illustrate the expected motions of two objects on the sky during the AllWISE epochs. Figure 3 shows the predicted path of the white dwarf LHS 239 on tile 1174p075_ac51 and Figure 4 shows the path for the T dwarf Gliese 570 D in tile 2243m213_ac51. In each of these plots, the black/grey track shows the predicted position (one plus sign per day) of the object from the date of the first WISE epoch (black square) to a date one year later (green square). The date of the second (i.e., final) AllWISE epoch is shown by the red square. The predicted track is black between the dates of the WISE observations and is grey for dates after the last WISE sighting. The motion that AllWISE should measure is the positional difference between the black and red squares, whereas the true proper motion would be that measured between the black and green squares. The true proper motion and parallax, the predicted motion from AllWISE, and the actual AllWISE values are given on the diagrams. Note that the actual AllWISE values are very close to the predicted values, although not necessarily close to the true proper motion measures. We should therefore think of the AllWISE measurements as motion values (parallax + proper motion) but not as pure proper motion values.
 |
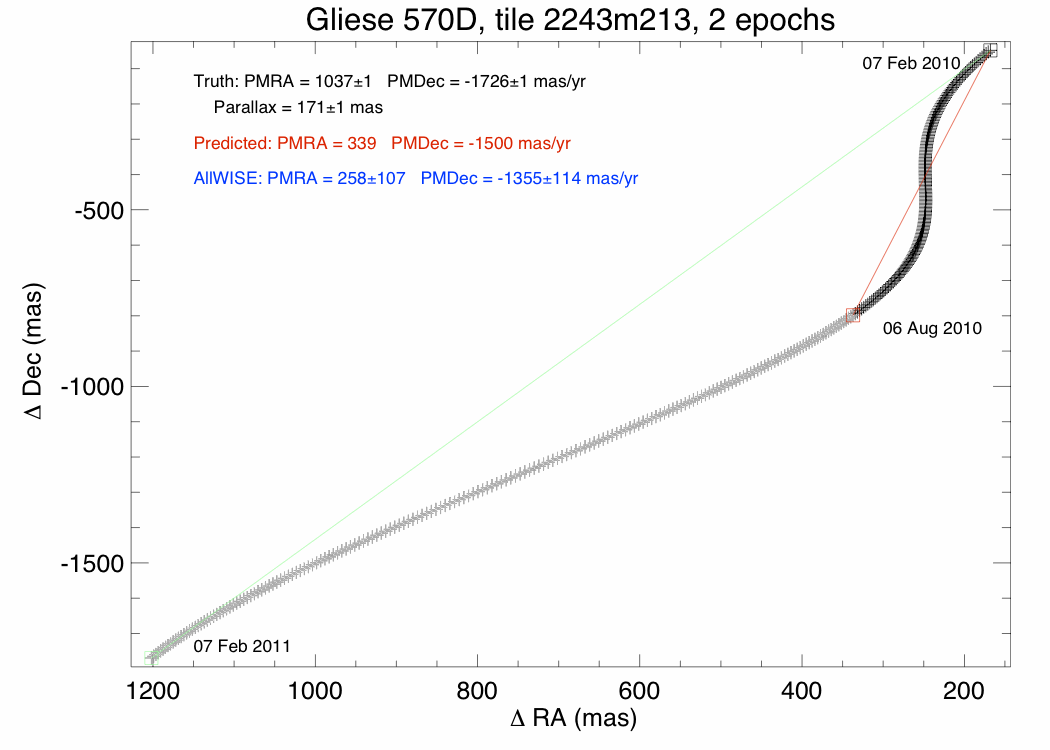 |
| Figure 3 - The predicted motion track (black/grey plus signs) for the DC12 white dwarf LHS 239. AllWISE measures a motion over six months as noted by the red line, whereas the true proper motion over a full year is denoted by the green line. | Figure 4 - The predicted motion track (black/grey plus signs) for the T7.5 brown dwarf Gl 570D. AllWISE measures a motion over six months as noted by the red line, whereas the true proper motion over a full year is denoted by the green line. |
Figure 5 illustrates the predicted sky path for the K dwarf Gliese 554, located in an area with three epochs of coverage. In this case, the AllWISE data fall almost perfectly along the proper motion vector. The AllWISE motion measure should be very close to the true proper motion, which we find to be the case. (It should be noted that a measurement using only epoch 1+2 data would show a larger motion than a measurement using only epoch 2+3 data, although both would have the correct position angle.
 |
| Figure 5 - The predicted motion track (black plus signs) for the K3 dwarf Gliese 554. The WISE data points (denoted by open squares) fall along the proper motion vector and cover a full year, so AllWISE measures a motion that is very close to the true proper motion. |
Because the AllWISE-measured motions do not decouple proper motion and parallax, these motions cannot be used to predict source positions at other epochs. Rather, their utility is in highlighting potentially interesting, nearby objects for further follow-up.
Motion measurements for a typical AllWISE Atlas Image are illustrated in Figure 6. The total proper motion is plotted as a function of χ2motion = (pmra/sigpmra)2 + (pmdec/sigpmdec)2. AllWISE tiles typically have ~1e5 extracted sources, so any source with Q = e−χ2motion < 1e−6 violates, with a very high degree of confidence, the hypothesis of a real object with zero motion (and errors correctly characterized by the Gaussian uncertainties). This limit on Q corresponds to χ2motion > 27.63. Sources in this tile that satisfy this criterion are labeled in red on Figure 6. Although a few of these objects may be true motion stars, other sources may have complications that create high values of χ2motion but do not indicate real motion. Examples are spurious objects flagged as such by cc_flags, objects with low signal-to-noise in all bands, and blended or extended sources (many of which can be identified by the nb, w?chi2, and rchi2 criteria.) Users are encouraged to check these parameters to eliminate sources whose seemingly significant motions are false.
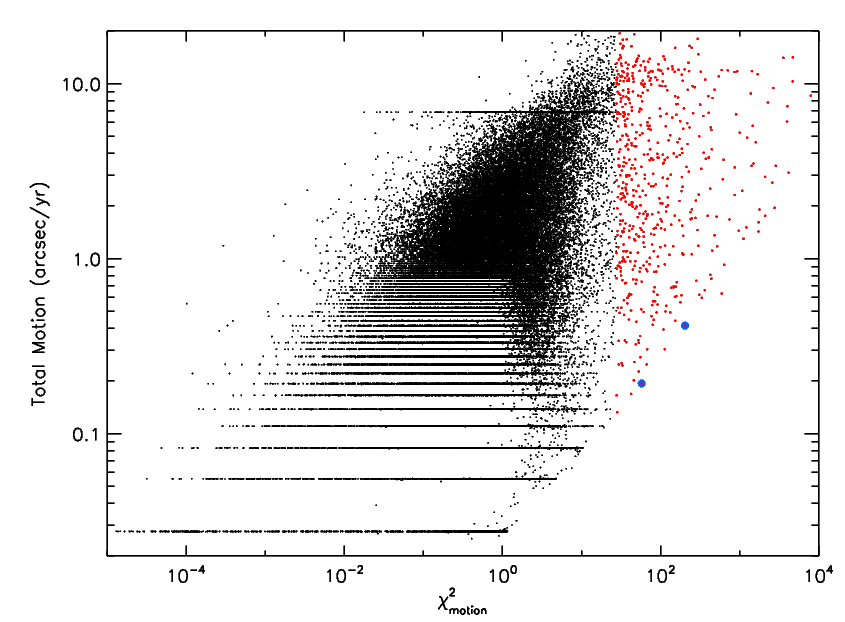 |
| Figure 6 - Total motions for sources in AllWISE coadd 0440p166_ac51 plotted as a function of χ2motion. Red symbols represent sources satisfying the criterion χ2motion > 27.63. The previously known motion stars LTT 10950 and NLTT 9223 are circled in blue. |
Figure 6 also shows two phenomena discussed further below. The horizontal bands obvious at motion values less than 1.0 arcsec/yr illustrate motion quantization and the horizontal streak at motion values of 6.875 arcsec/yr represents the so-called "pile-up" effect.
Two objects circled in Figure 6 passed additional criteria such as having pristine cc_flags (= '0000'), no blending (nb = 1), and w?rchi2 values indicating a point source (less than 2.0 in all bands), and also passed a visual inspection step showing them to be clean, uncomplicated sources. The first, WISEA J025517.56+161832.7 (Figure 7), has AllWISE measured motions in (RA, Dec) of (367±29, 190±29) mas/yr and is the known motion star LTT 10950 with published proper motions in (RA, Dec) of (203.09±0.82, -47.76±0.58) mas/yr. The discrepancy in measured values is likely due more to the fact that this source is heavily saturated in AllWISE (W1 = 5.7 mag) rather than to parallax, which is only 37.32±0.66 mas.
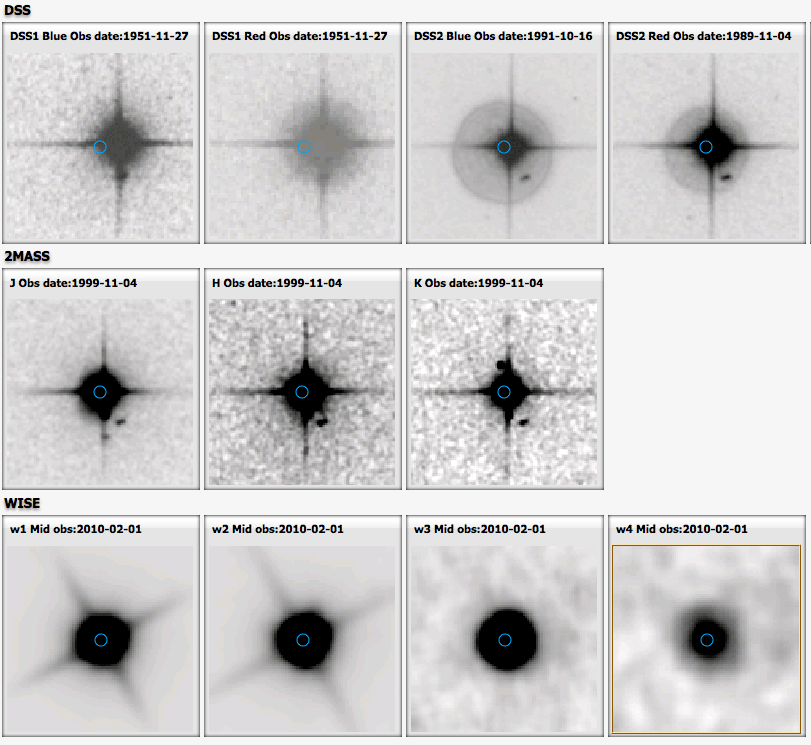 |
| Figure 7 - 2×2 arcminute fields from DSS1, DSS2, 2MASS, and WISE centered on the position of the motion source WISEA J025517.56+161832.7 (aka LTT 10950). The object shows clear motion between 1951 and 2010. |
The second source, WISEA J025326.12+172429.8 (Figure 8), has AllWISE measured motions in (RA, Dec) of (-55±26, -185±25) mas/yr and is the known motion star NLTT 9223 with published proper motions in (RA, Dec) of (20, -258) mas/yr. This source is also saturated in AllWISE (W1 = 7.7 mag), which is likely the reason for the poor agreement between AllWISE and published values.
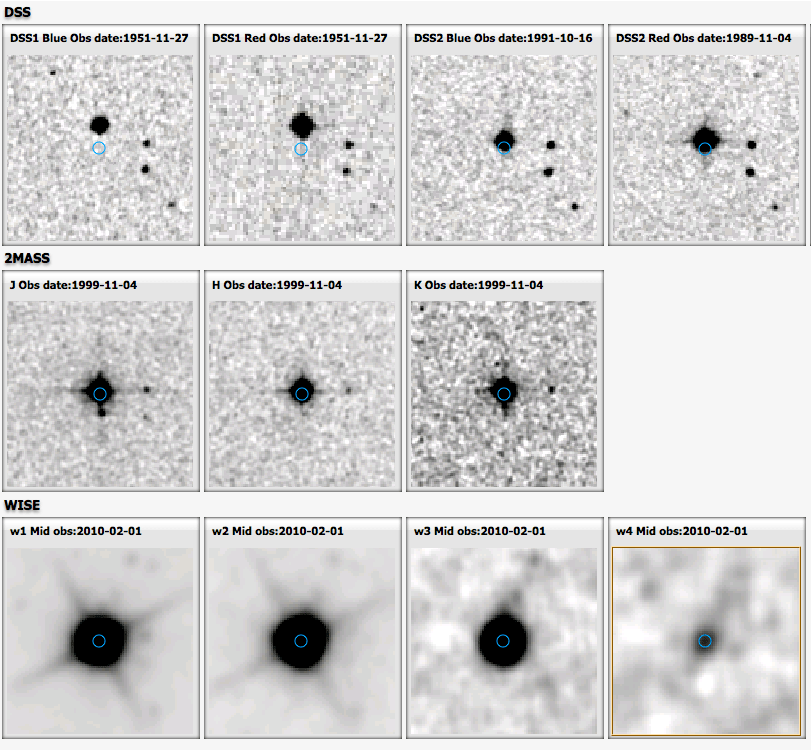 |
| Figure 8 - 2×2 arcminute fields from DSS1, DSS2, 2MASS, and WISE centered on the position of the motion source WISEA J025326.12+172429.8 (aka NLTT 9223). The object shows clear motion between 1951 and 2010. |
Figure 9 shows an AllWISE high-motion object that was previously unknown. This source, WISEA J070720.50+170532.7, has AllWISE-measured motions in (RA, Dec) of (1355±59, -1256±62) mas/yr. Using earlier archival data from DSS1, DSS2, and 2MASS along with more recent imaging, Wright et al. measure a motion in (RA, Dec) of (1229±3, -1307±1) mas/yr over a 62-yr baseline. This value agrees very well with the one measured by AllWISE for this uncomplicated, unsatured (W1 = 12.65 mag) source. Spectroscopic follow-up of this source (Wright et al.) reveals that the object as an M-type ultrasubdwarf.
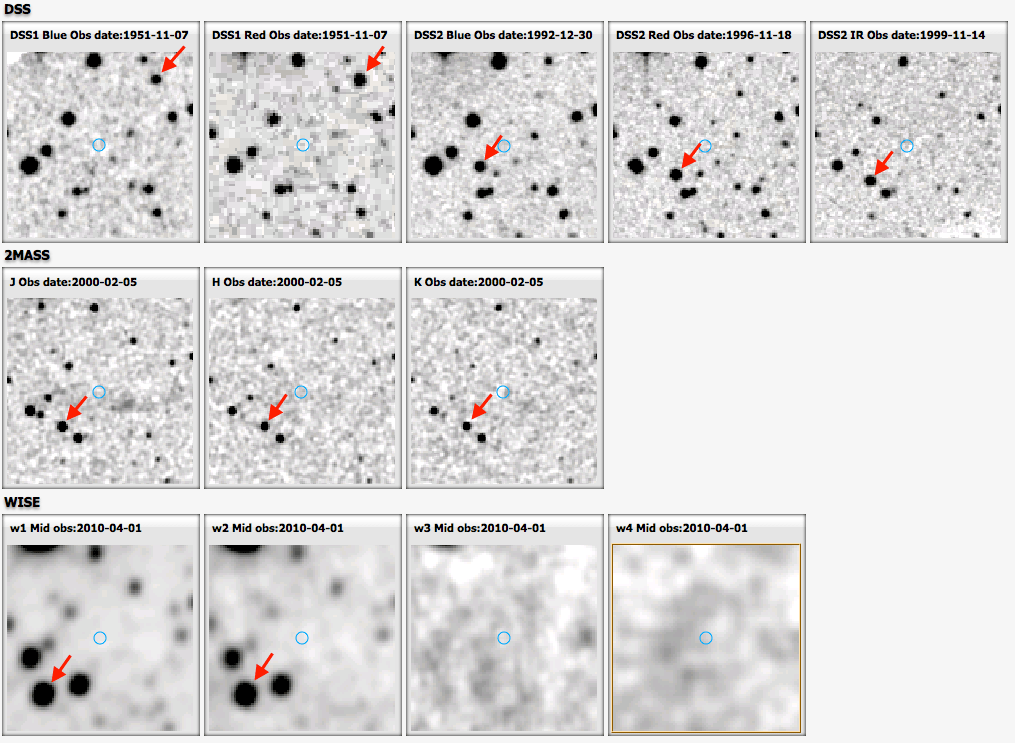 |
| Figure 9 - 2×2 arcminute fields from DSS1, DSS2, 2MASS, and WISE showing the motion of source WISEA J070720.50+170532.7. The object is marked by a red arrow at each epoch. |
In order to check the accuracy of the AllWISE-measured motions, we have compared them to published astrometry from a set of known low-mass stars and brown dwarfs. These objects were selected because they have high signal-to-noise ratios in one or more WISE bands but are not saturated. Specifically, we use objects in the Database of Ultracool Parallaxes compiled (as of October 2013) by Trent Dupuy. This list contains proper motions and parallaxes for all late-M, L, T, and Y dwarfs that have published parallaxes. After excluding close binaries and blends, 233 objects are available for comparison.
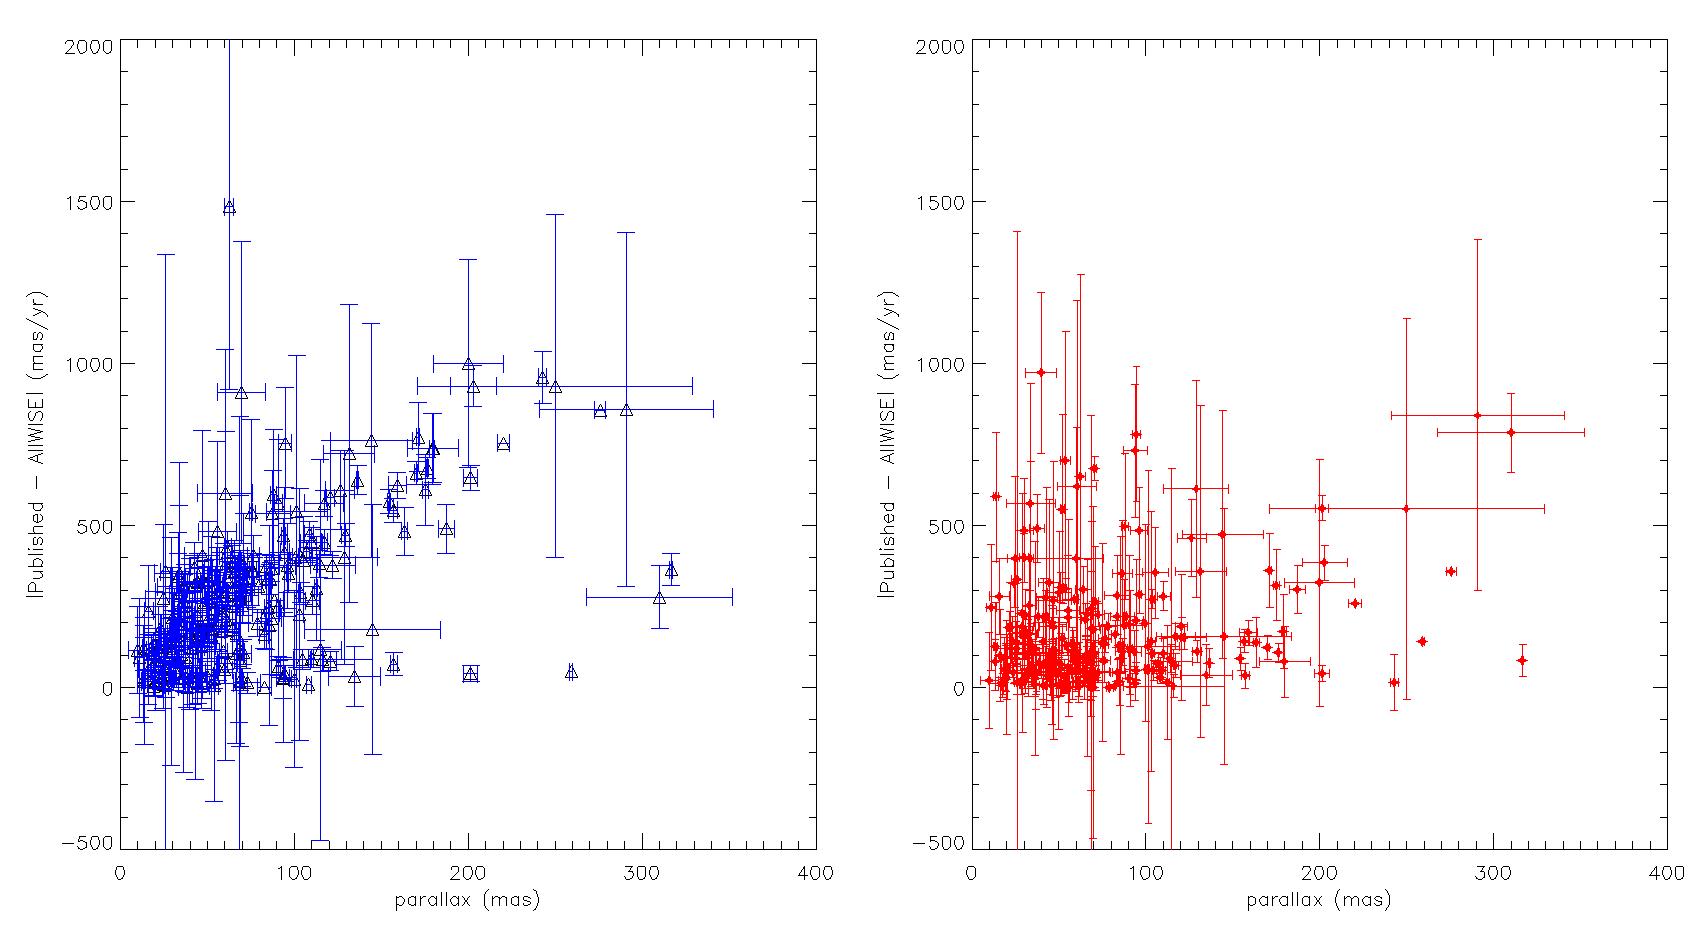
As shown in Figure 10, the difference between the published proper motions and the AllWISE motions shows a larger dispersion in RA than in Dec. Both dispersions, however, are larger than would be expected based on the average AllWISE motion errors, which are 122.3 mas and 129.4 mas for RA and Dec, respectively. The most likely reason for this is the influence of parallax on the AllWISE motion measurements. This appears to be the case, as shown in Figure 11, which illustrates the motion differences in RA and Dec plotted as a function of parallax. While the Dec differences show a slight increase at the largest parallaxes, the RA differences clearly increase with increasing parallax. This is expected behavior because the parallactic motion, which is along lines of constant ecliptic latitude, will affect RA more severely than Dec.
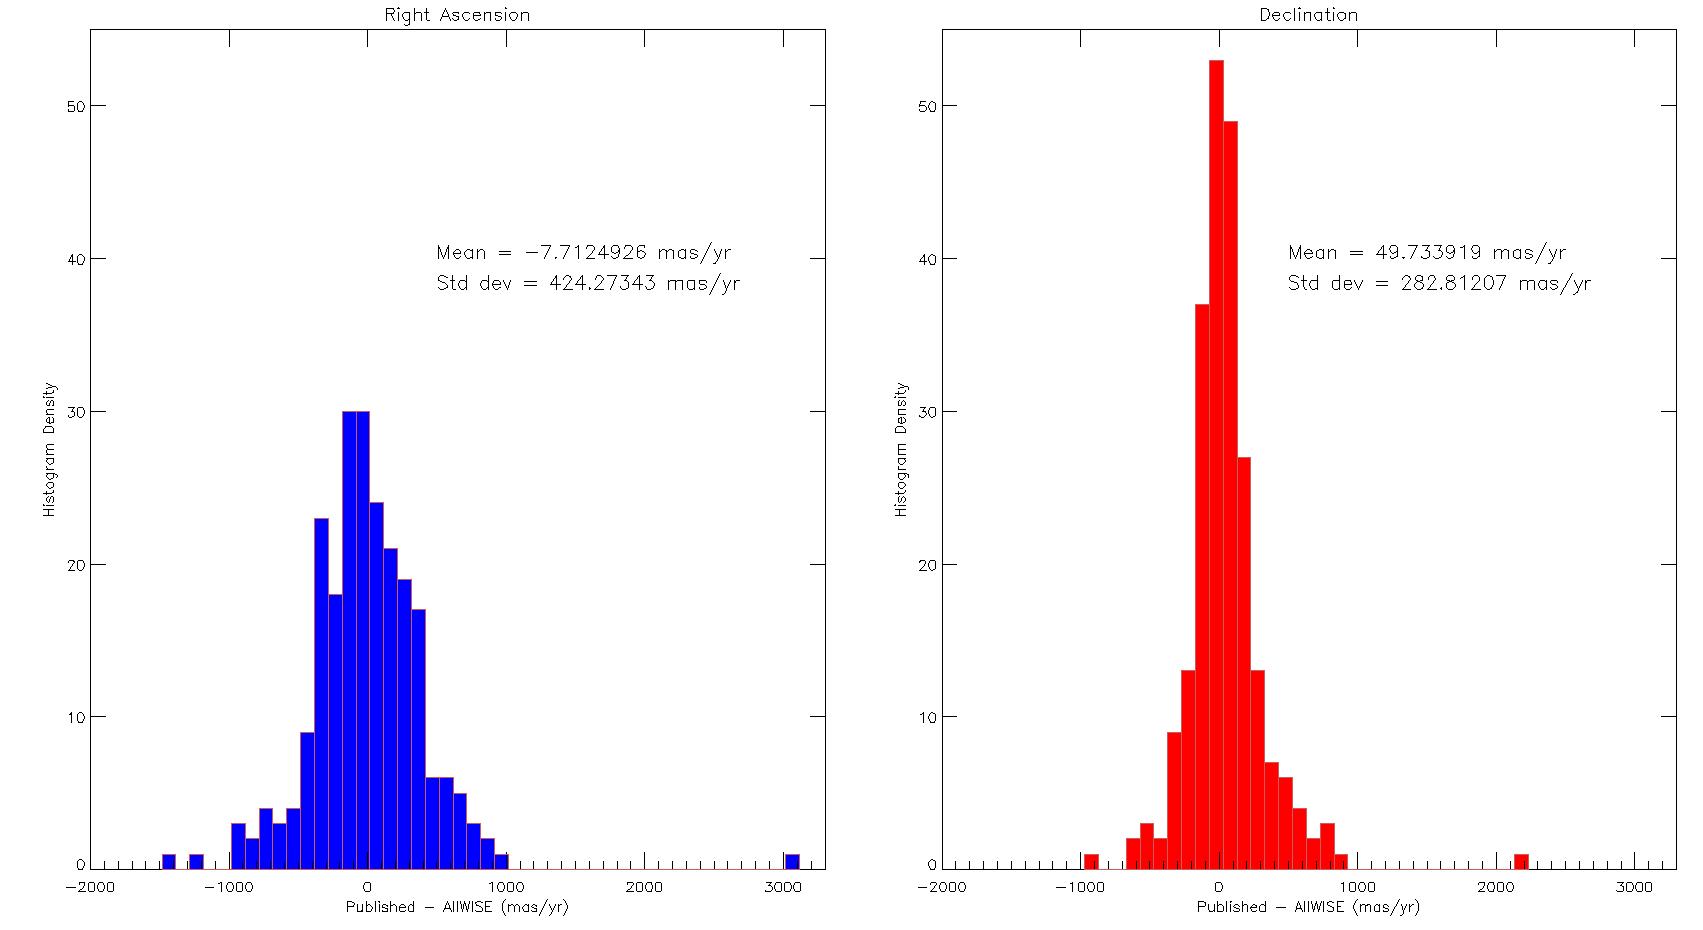 |
| Figure 10 - Histograms of the difference between published and AllWISE motions in RA (left panel) and Dec (right panel). |
 |
| Figure 11 - The absolute value of the difference between published proper motion and AllWISE motion in RA (left) and Dec (right) as a function of parallax. |
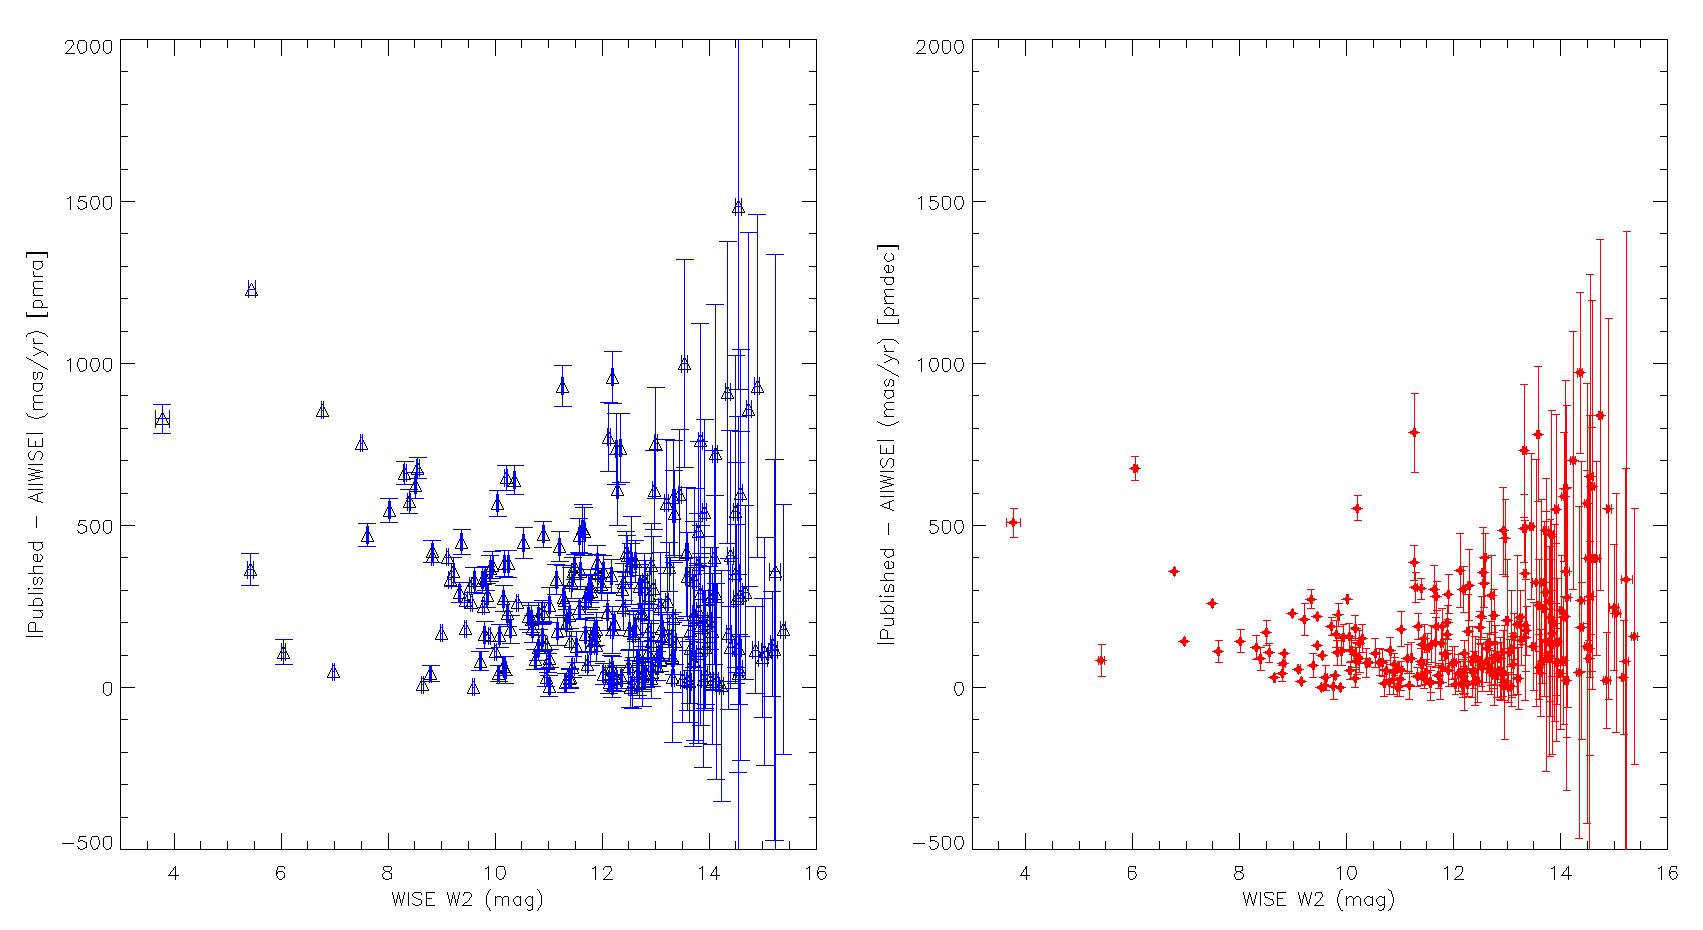
Figure 12 shows the motion difference ploted as a function of W2 mag, which for most L, T, and Y dwarfs is the WISE band with the highest signal-to-noise ratio and thus the band driving the astrometry. Agreement is best in the range 7 < W2 < 12 mag. Astrometric precision is degraded at brighter magnitudes (W2 < 7 mag) because such objects have saturated cores, and it quickly degrades at fainter magnitudes (W2 > 12 mag) due to poorer photon counting statistics.
 |
| Figure 12 - Difference between published proper motion and AllWISE motion in RA (left) and Dec (right) as a function of WISE W2 magnitude. |
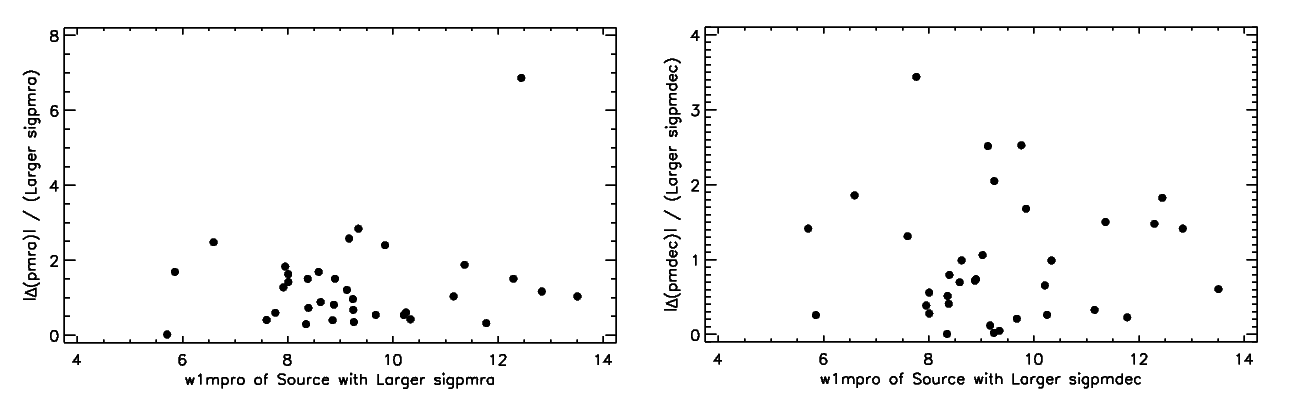
As part of AllWISE quality assurance (QA) checks, the QA software reported sources in each tile that had a high likelihood of being real motion stars. Over the course of inspecting the 18,240 tiles comprising the AllWISE data release, the QA reviewers noted 35 pairs of closely-separated objects with significant motion measurements. These systems were checked in SIMBAD and confirmed to be known common proper motion systems. The AllWISE measured motions should be identical for each member of the pair because the common parallax between components will affect the motion measures identically. Therefore, we can use these systems to perform an internal consistency check to see whether the AllWISE motions are the same within the errors for both objects.
Figure 13 shows the difference in motion between the two members of each pair. The difference is shown per axis, is expressed in units of the larger motion error within the pair, and is plotted as a function of the W1 profile-fit magnitude of the source with the larger motion error. The typical difference is 1 to 2 times the error, with one source whose motions differ by >3 times the error. Overall, agreement is very good.
 |
| Figure 13 - Difference in motion in RA (left) and Dec (right), expressed in units of the larger motion error within the pair, for 35 common proper motion binaries noted during QA reviewing. These differences are plotted as a function of the W1 profile-fit magnitude of the source with the larger motion error. |
AllWISE is able to identify objects with very high motion. Table 1 lists the eleven highest proper motion systems known (μ ≥ 4.6 arcsec/yr) and compares their published proper motions to the motions derived by AllWISE. Agreement is not expected due to the effects of parallax and saturation on the AllWISE positional measurements. (Most of these sources are extremely bright and heavily saturated on the WISE arrays.) Nonetheless, the comparison shows that the highest motion stars can be identified as such in AllWISE data.
TABLE 1: Motion Comparisons for the Eleven Highest Proper Motion Systems Known

Object            Spec.   AllWISE   AllWISE                   AllWISE            AllWISE            SIMBAD                SIMBAD                 SIMBAD
Name              Type    w1mpro    Coordinates J2000         RA motion          Dec motion         RA proper motion      Dec proper motion      parallax
                          (mag)                               (arcsec/yr)        (arcsec/yr)        (arcsec/yr)           (arcsec/yr)            (arcsec)
Barnard's Star    M4 V    5.02      269.4501364   4.7228069   -1.630 +/- 0.071  +13.703 +/- 0.065   -0.798  +/- 0.0017   +10.328  +/- 0.0012     0.548 +/- 0.002
Kapteyn's Star    sdM1    4.92       77.9450829 -45.0345902   +8.166 +/- 0.029   -8.065 +/- 0.032   +6.5051 +/- 0.00098   -5.7308 +/- 0.00096    0.256 +/- 0.001
Groombridge 1830  G8 V    4.33      178.2595249  37.7018521   +2.224 +/- 0.059   -1.431 +/- 0.066   +4.0039 +/- 0.00037   -5.8136 +/- 0.00023    0.110 +/- 0.001
Lacaille 9352     M2 V    2.59      346.4911197 -35.8492227   +1.866 +/- 0.056   -0.841 +/- 0.060   +6.7682 +/- 0.00059   +1.3275 +/- 0.00068    0.305 +/- 0.001
CD -37 15492      M1.5 V  4.40        1.3723131 -37.3641778   -0.471 +/- 0.077   -2.662 +/- 0.086   +5.6347 +/- 0.00086   -2.3377 +/- 0.00071    0.230 +/- 0.001
61 Cygni A        K5 V    0.18      316.7404426  38.7585762   -4.028 +/- 0.052   +5.420 +/- 0.054   +4.1683 +/- 0.00657   +3.2692 +/- 0.01208    0.287 +/- 0.007
61 Cygni B        K7 V    0.97      316.7453921  38.7512583   -1.171 +/- 0.058   +0.215 +/- 0.066   +4.1069 +/- 0.00032   +3.1447 +/- 0.00044    0.286 +/- 0.001
Ross 619          M4.5 V  7.18      122.9929951   8.7581843   +1.661 +/- 0.034   -5.277 +/- 0.032   +1.099  +/- _______   -5.123  +/- _______    0.148 +/- 0.003
Teegarden's Star  M7 V    7.15       43.2639363  16.8703546   +3.471 +/- 0.056   -3.666 +/- 0.025   +3.386  +/- _______   -3.747  +/- _______    0.261 +/- 0.003
Lalande 21185     M2 V    2.47      165.8319761  35.9562323   +0.338 +/- 0.050   +0.786 +/- 0.048   -0.5803 +/- 0.00062   -4.7658 +/- 0.00064    0.393 +/- 0.001
epsilon Indi A    K5 V    0.87      330.8612320 -56.7932110   +1.218 +/- 0.032   -0.026 +/- 0.036   +3.9609 +/- 0.00024   -2.5392 +/- 0.00017    0.276 +/- 0.001
epsilon Indi B    T1+T6  10.72      331.0656363 -56.7901370   +3.132 +/- 0.041   -3.124 +/- 0.038   +4.157  +/- 0.041     -2.478  +/- 0.025      0.276 +/- 0.001
Wolf 359          M6 V    5.84      164.1091270   7.0069591   -2.618 +/- 0.044   -4.881 +/- 0.042   -3.842  +/- _______   -2.725  +/- _______    0.418 +/- 0.003
All of these sources satisfy the criteria for inclusion in the AllWISE Source Catalog except for 61 Cygni A. This object is part of a small-separation same-tile source (SSSTS) group and unfortunately, despite our best efforts to recover such sources, neither member of the SSSTS group satisfies all the criteria necessary for Catalog consideration. This source can, however, be found in the AllWISE Reject Table.
Objects with motions as high as Barnard's Star (10.4 arcsec/yr) can be successfully recovered with AllWISE, but what is the theoretical limit to the largest motion that AllWISE can measure for a real, astrophysical source? There are sources in the combination of the AllWISE Source Catalog and Reject Table that have single-axis motions as large as 670 arcsec/yr (670,000 mas/yr); spot checks of these sources show them to be artifacts associated with extended structures like diffraction spikes and optical ghosts. Ultimately, the algorithm of χ2 minimization is only limited by the detection step on the coadd images; that is, as long as a source is identified on the coadds, extremely large motions can be recovered. The only real sources that will not have a coadd detection are those moving so fast that outlier rejection will have eliminated them from the coadd entirely. Real examples include main belt asteroids and near-earth objects. Outlier rejection is more likely to eliminate objects seen less than 50% of the time in the frame stack. For the two-epoch case, it is just possible for an object near the ecliptic plane moving at ~2.5×FWHM between the first and last exposures over one epoch, or 15 arcsec per ~2 days (~2700 arcsec/yr), to have survived coaddition and be detected. For areas of sky with three epochs of coverage, assuming equal numbers of frames per epoch, a source moving at ~2700 arcsec/yr would be seen within a 2.5×FWHM window only 33% of the time, and would thus be removed from the coadd because it fails to meet the 50% outlier threshold. For such a three-epoch case, the motion limit is more likely to be ~2.5×FWHM between two consecutive epochs, or 15 arcsec per 6 months (30 arcsec/yr).
Figure 14 shows the motion errors of sources in a typical AllWISE Atlas Image plotted against W1 magnitude. Bright sources free of saturation effects (8 < W1 < 10 mag) approach an asymptote of ~0.035 arcsec/yr in their per-axis errors. Requiring a 3σ detection per axis means that the smallest significant motion that is measurable is ~0.14 arcsec/yr; requiring the stricter χ2motion > 27.63 criterion above give a smallest motion of ~0.18 arcsec/yr. At fainter magnitudes, the smallest measurable significant motion increases dramatically as the minimum motion errors themselves increase. At W1 = 15 mag, for example, the motion errors are roughly 10× larger, meaning that the smallest measurable significant motion is ~1.5 - 1.8 arcsec/yr.
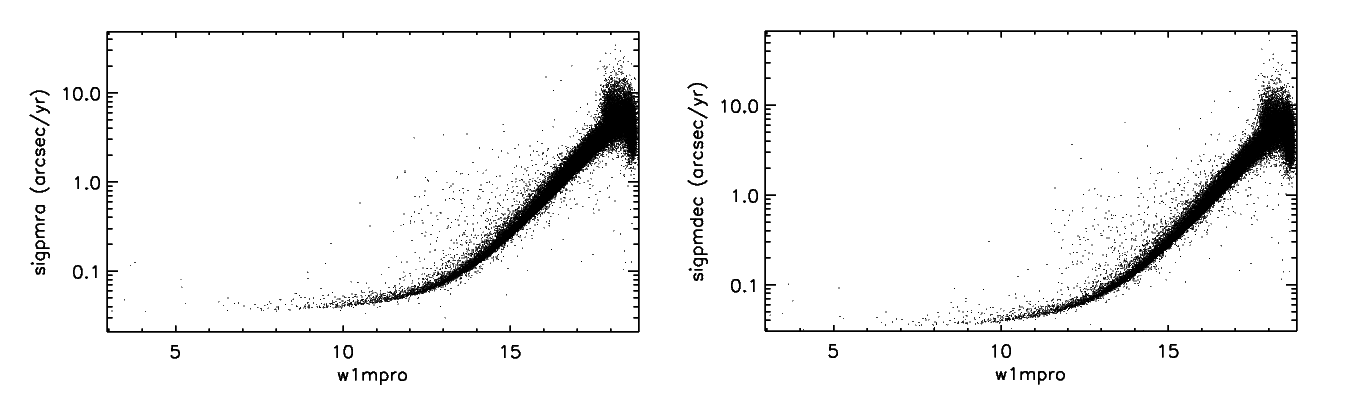 |
| Figure 14 - Uncertainty in motion measured by AllWISE in RA (left), and Dec (right) for all sources in coadd 2243m213_ac51, plotted as a function of the W1 profile-fit photometry. |
As in any motion survey, blended or extended objects in AllWISE create the potential for false motions. One such source is WISEA J130716.06+061032.7, an object whose AllWISE measurements indicate a significant motion of 4795±471 and 2381±493 mas/yr in RA and Dec, respectively. A very faint, extended source is seen at this position in the SDSS r and i band imagery taken in 2003 (Figure 15), so the source is clearly not moving. This source is extended in the W2 band and the photocenters at W1 and W2 do not align, giving rise to the false motion.
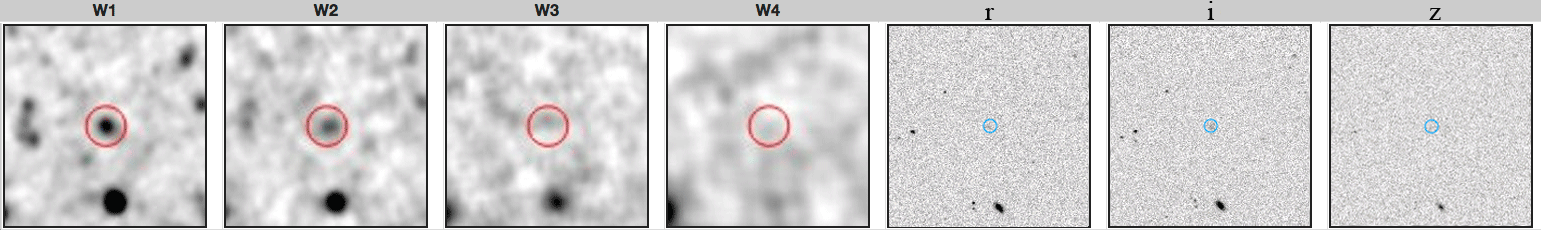 |
| Figure 15 - 2×2 arcminute cutouts around the source WISEA J130716.06+061032.7 from the AllWISE Atlas Images at W1, W2, W3, and W4 (first four images) and from SDSS at r, i, and z (last three images). The AllWISE position of this source is marked in red on the WISE images and in blue on the SDSS images. |
WISEAR J103558.13-370522.0 is a source in the AllWISE Reject Table with a seemingly high and statistically significant motion; AllWISE measures 3527±350 and -1209±119 mas/yr in RA and Dec, respectively. This, however, is a small-separation, same-tile source (SSSTS) and is flagged as such by the rel flag in the Reject Table. As seen in Figure 16, this source falls in the wings of a real object, named WISEA J103558.04-370520.9 in the AllWISE Source Catalog, that has motion measures of -4 ±44 and 27 ±44 mas/yr in RA and Dec, respectively, indicating no apparent motion. Users are cautioned to pay particular attention to the rel flag when using motion measures from the Reject Table.
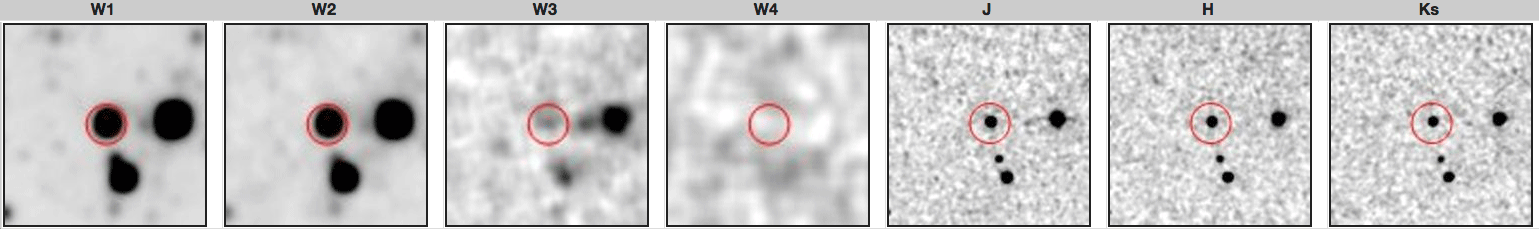 |
| Figure 16 - 2×2 arcminute cutouts around the source WISEAR J103558.13-370522.0 from the AllWISE Atlas Images at W1, W2, W3, and W4 (first four images) and from the 2MASS Atlas Images at J, H, and Ks (last three images). The AllWISE position of this source is marked in red. This object is an SSSTS. The true source, WISEA J103558.04-370520.9, is located just to the northwest by 1.5 arcseconds (still in the red circle, but offset from center) and clearly shows no motion between the WISE and 2MASS epochs. |
Flux transients can sometimes trigger false motions. When an object appears at only one epoch, a nearby noise blip at the other epoch(s) may trigger a false, generally large motion. Because the derived motion is so large, it may appear to be statistically significant despite having rather large errors. An example of this is WISEA J122559.53+070005.2 (source_id = 1861p075_ac51-002577), which has AllWISE-reported motions of 24902±4071 and 11567±7922 mas/yr in RA and Dec, respectively. This object appears only in the first epoch and not the second (Figure 17), as confirmed by the Multi-Epoch Source Table, which gives a mean w1mpro value of ~15.3 mag for the first epoch and limits of >17.0 mag for the second.
 |
| Figure 17 - The top row of images show a 2×2 arcminute cutout of the AllWISE Atlas Images (W1, W2 W3, and W4 bands) centered on WISEA J122559.53+070005.2. The object is clearly detected in W1. The bottom two rows show a selection of 2×2 arcminute Single Exposure images from epoch 1 (first row) and epoch 2 (second row), centered on the object. Note that the source is detected only in epoch 1. |
Sources that are detected only at W3 and/or W4 may show spurious motions. Such sources will be seen only at the earlier epochs before cryogen was exhausted and not at the later epochs when those bands were not operational. Nearby noise blips at the later epochs in W1 and/or W2 can trigger false motions. One such example is the planetary nebula PN SB 24, also known as WISEA J185716.62-175050.4 (Figure 18), which has AllWISE-measured motions of 6243±1101 and -11981±1162 mas/yr in RA and Dec, respectively, despite the fact that the nebula is known to have near-zero proper motion.
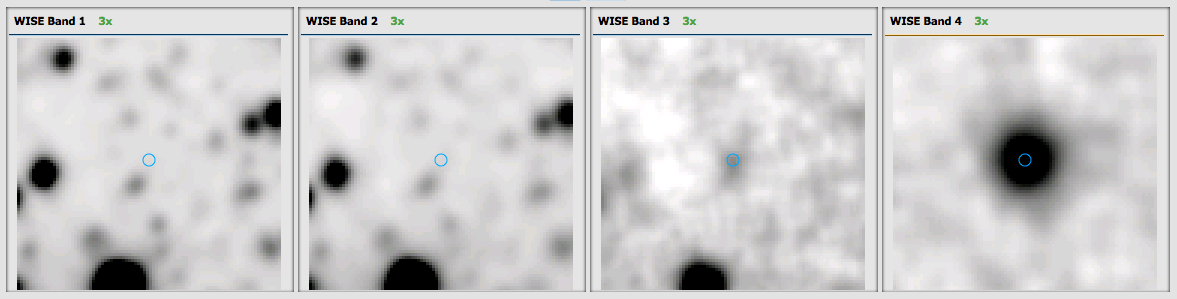 |
| Figure 18 - 2×2 arcminute cutouts of the AllWISE Atlas Images (W1, W2 W3, and W4 bands) centered on WISEA J185716.62-175050.4. The object is detected only in W3 and W4. |
Areas having less than five frames of coverage do not reap the benefit of outlier rejection in the coaddition step, so spurious sources can bleed through into the coadds. In some cases, these spurious sources have falsely measured, yet significant, motions in AllWISE. One example is WISEA J210220.65-083948.6 (Figure 19), a cosmic ray that appears in only one W3 frame in an area of sky having only that one W3 frame of coverage. A nearby noise blip nonetheless causes AllWISE to measure a large, although false, motion for it of 4573±1094 and 6531±1213 mas/yr in RA and Dec, respectively, despite the fact that the source is actually only seen in a single band at a single epoch.
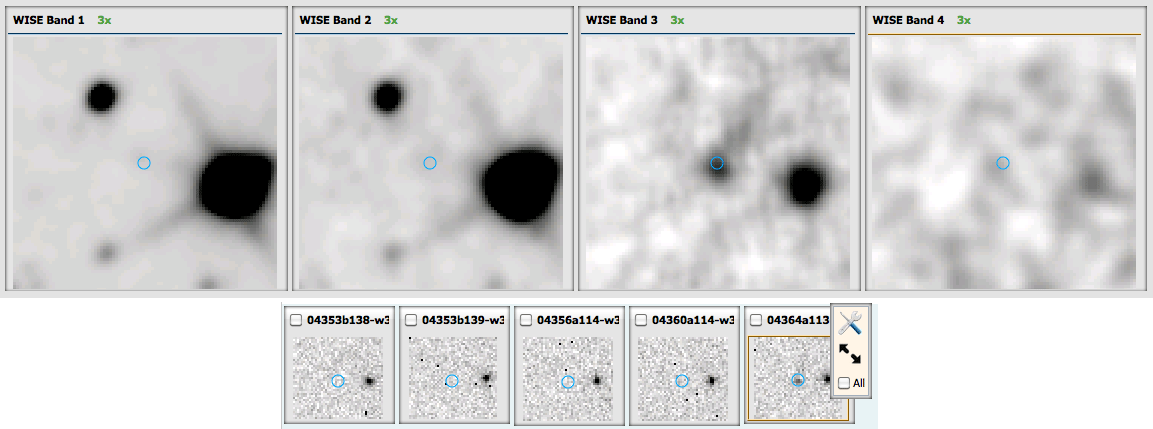 |
| Figure 19 - (Top row) 2×2 arcminute cutouts of the AllWISE Atlas Images (W1, W2 W3, and W4 bands) centered on WISEA J210220.65-083948.6 (blue circle). The object is detected only in W3. (Bottom row) Although only one W3 frame (04364a113; far right) at this sky location meets quality control criteria, other rejected frames (the four to the left) clearly do not show an object at this location (blue circle), leading us to believe that this is merely a cosmic ray. |
Another consequence of low-coverage areas is the increased influence of the occasional poorer frame going into the coadd. The most extreme example is one in which only a single frameset is available for one of the WISE epochs, and that frameset has non-optimal quality. False motions may result, as is the case for source WISEA J061658.37+701209.5 (Figure 20). This object lies in an area of sky with single-frameset coverage (02821a200) at the first epoch, but this four-band image is slightly smeared due to momentum dumping by the spacecraft (see torque-rod scars for more information). The astrometric solution for the entire frameset is slightly biased in RA because of this smearing, The later epoch of data is not affected by smearing. As a result of the mismatch in positions across epochs, a false motion of 1547±129 and -5±127 mas/yr in RA and Dec, respectively, is created. It should be noted that this is an extremely rare occurrence in AllWISE, as quality assurance flagged almost all of the smeared frames and eliminated them from consideration for coaddition. Nonetheless, users are advised to treat with caution any motion measures in areas of low-coverage at a single epoch.
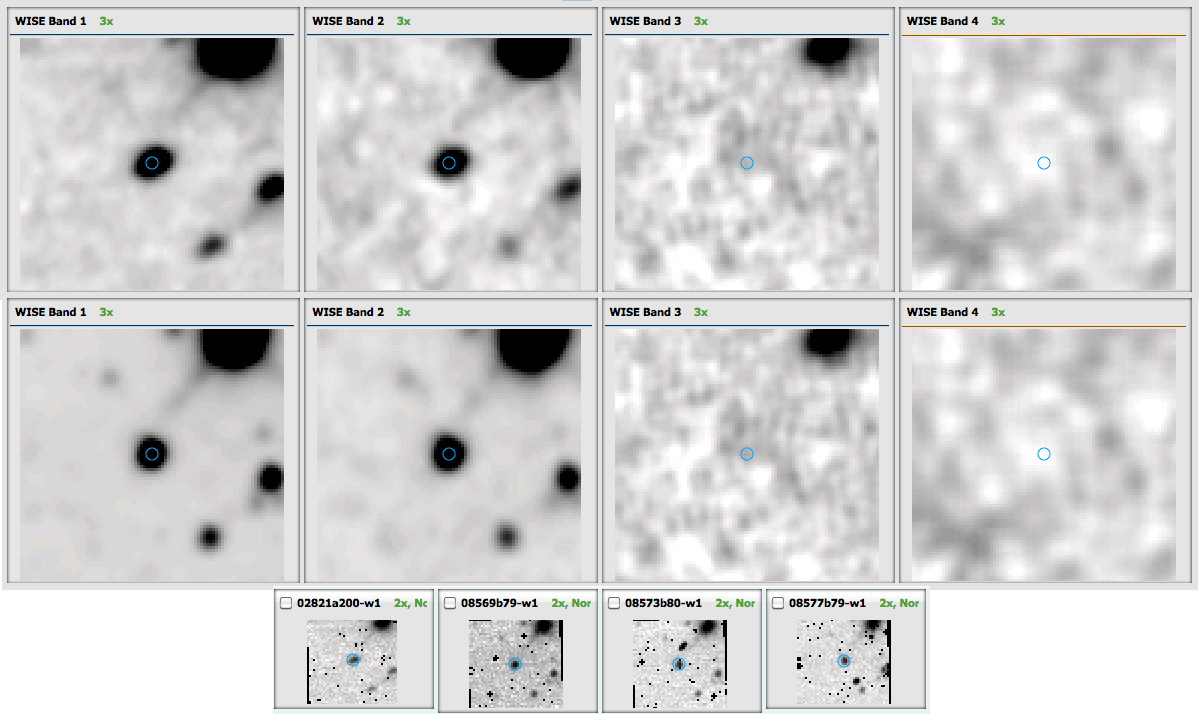 |
| Figure 20 - (Top row) 2×2 arcminute cutouts of the WISE All-Sky Atlas Image 0962p696_ac41 centered on WISEA J061658.37+701209.5 (blue circle). Note that sources are elongated, because all of the framesets at this epoch are smeared. (Middle row) 2×2 arcmin cutouts of the AllWISE Atlas Image 0962p969_ac51 at the same sky location. Note that the addition of many frames of second-epoch, high-quality data have greatly helped to overwhelm the one reamining bad frameset at the earlier epoch. (Bottom row) The four earliest individual W1 frames used in AllWISE. Note that the only data available in the first epoch (frameset 02821a200) are badly elongated. |
A plot of the AllWISE motion values (Figure 21) shows that certain, discrete values have a higher frequency of occurrence. The solution for motion values and source positions is an iterative process whereby a minimization of χ2 is sought in the phase space of source position and motion. Convergence is rapidly achieved in the above phase space for position estimates, using initial values. On the other hand, convergence on motion values is achieved only after one or more iterative steps. The step size used for motion estimates is 0.0275 arcsec/yr, and converged motion values are thus quantized at multiples of this value. The phenomenon is further discussed in Section V.3.b.ii.
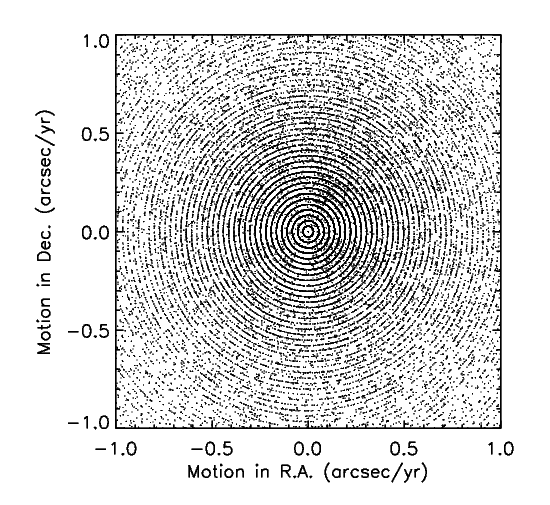 |
| Figure 21 - AllWISE motions in RA and Dec for all sources in coadd 1174p075_ac51. The closely-spaced rings illustrate the quantization phenomenon in offsets of 0.0275 arcsec/yr. |
AllWISE motion measurements exhibit a preponderance of values at 6.875 arcsec/yr. The "pile-up" of motion measures at this value is illustrated in Figure 22. The algorithm for minimization of χ2 in the phase space of source position and motion parameters has a maximum number of iterations of 250. Each iteration step for motion uses a step size of 0.0275 arcsec/yr. A spurious or pure-noise solution that has not converged after the maximum number of steps will lead to a motion value of 6.875 arcsec/yr, leading to the pile-up of sources having that value in the figure. This phenomenon is further discussed in Section V.3.b.ii.4.
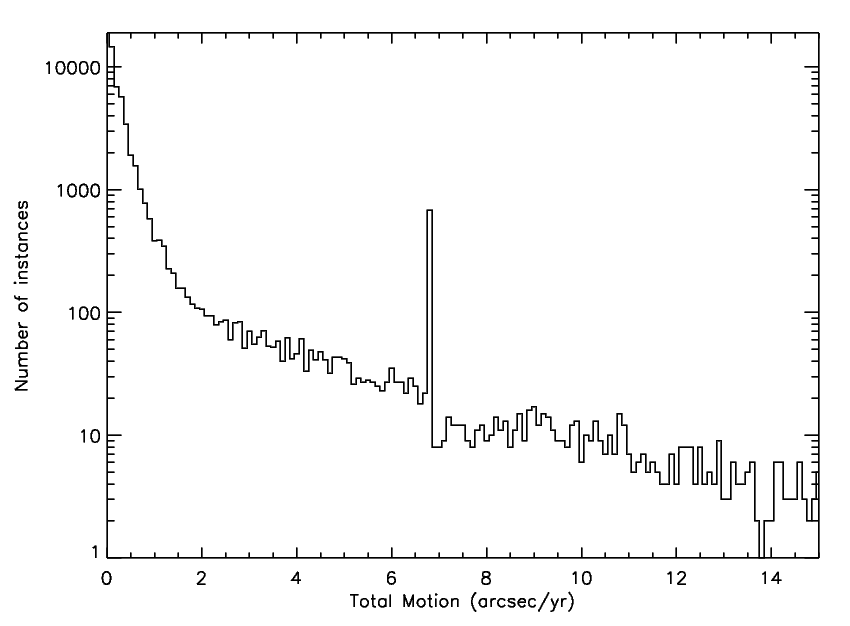 |
| Figure 22 - Histogram of AllWISE total motion values of all sources in coadd 1627m531_ac51. Total motion is the root-sum-square combination of motions in R.A. and Dec. The local maximum or peak near 6.875 arcsec/yr illustrates the so-called "pile-up" phenomenon in AllWISE motions. |
Last update: 7 October 2015